

Abstract
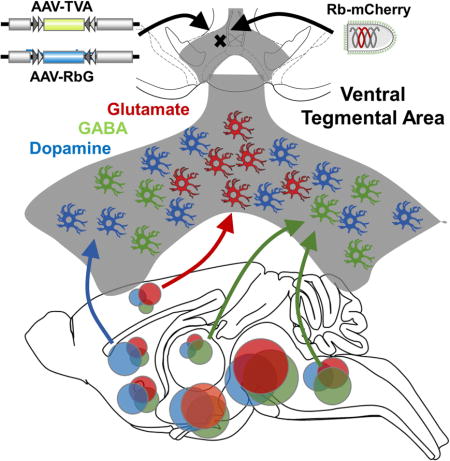
The ventral tegmental area (VTA) plays a central role in the neural circuit control of behavioral reinforcement. Though considered a dopaminergic nucleus, the VTA contains substantial heterogeneity in neurotransmitter type, containing also GABA and glutamate neurons. Here we used a combinatorial viral approach to transsynaptically label afferents to defined VTA dopamine, GABA, or glutamate neurons. Surprisingly, we find that these populations received qualitatively similar inputs, with dominant and comparable projections from the lateral hypothalamus, raphe, and ventral pallidum. However, notable differences were observed with striatal regions and globus pallidus providing a greater share of input to VTA dopamine neurons, cortical input preferentially on to glutamate neurons, and GABA neurons receiving proportionally more input from the lateral habenula and laterodorsal tegmental nucleus. By comparing inputs to each of the transmitter-defined VTA cell types this study sheds important light on the systems-level organization of diverse inputs to VTA.
Keywords: ventral tegmental area, VTA, vesicular glutamate transporter, VGLUT2, dopamine, glutamate, GABA, rabies virus, transsynaptic tracing
eTOC blurb
Afferents to ventral tegmental area (VTA) neurons control reward-seeking behaviors, but their relative arrangement onto heterogeneous VTA cell types has remained largely unknown. Faget et al. now use an optimized transsynaptic retrograde tracing approach to provide a comprehensive map of inputs to each transmitter-defined VTA cell type.
Introduction
The ventral tegmental area (VTA) along with its cortical, striatal, and limbic projections are key circuits involved in encoding, energizing, and adapting behavioral responses to salient stimuli. A thorough understanding of the input-output VTA network is required for our comprehension of addiction and other maladaptive behavioral disorders. But like many brain areas, cells in the VTA do not represent a homogenous structure, but are rather highly heterogeneous whether organized across anatomical, neurochemical, or functional domains (Fields et al., 2007; Lammel et al., 2014). One fundamental source of heterogeneity is the neurotransmitter identity and the constellation of gene products required to synthesize, package, release, and reuptake recycling neurotransmitters. Although dopamine neurons in the VTA are best studied, GABA- and glutamate-releasing neurons are also abundant, as are neurons capable of co-releasing combinations of these. The recent demonstration that VTA neurons express the vesicular glutamate transporter 2 (VGLUT2) (Kawano et al., 2006), and the ability of some dopamine neurons to co-release glutamate (Chuhma et al., 2014; Hnasko et al., 2010; Hnasko and Edwards, 2012; Stuber et al., 2010; Tecuapetla et al., 2010) has led to a surge of interest in VTA glutamate neurons. We and others have begun to characterize their physiological properties, projection targets, and functional roles (Alsio et al., 2011; Hnasko et al., 2012; Root et al., 2014; Taylor et al., 2014). However, the afferent inputs to VTA glutamate neurons and how the inputs compare to VTA dopamine and GABA neurons remain unknown.
Retrograde tracing has been widely used to map sources of afferent input from a target brain region. However, classical tracers such as horseradish peroxidase or fluorogold do not readily discriminate based on cell type. Several rabies or herpes based viral vectors have been developed that target genetically defined cell types and spread transsynaptically to label afferent inputs (Callaway, 2008; Card and Enquist, 2014; Osakada et al., 2011; Wall et al., 2010; Wickersham et al., 2007). Combined use of modified rabies virus (Rb) together with ‘helper’ Adeno-associated virus (AAV) vectors have proven particularly amenable toward this goal across a variety of structures and neuron types (Wall et al., 2013; Weissbourd et al., 2014). Indeed, recent studies have used such approaches to characterize inputs onto VTA or substantia nigra dopamine neurons (Beier et al., 2015; Lerner et al., 2015; Menegas et al., 2015; Ogawa et al., 2014; Watabe-Uchida et al., 2012).
Here we compare the afferent inputs to genetically defined VTA glutamate, dopamine, and GABA neurons using mCherry-expressing and glycoprotein-deleted rabies virus pseudotyped with an EnvA envelope protein (Osakada and Callaway, 2013). This vector was used in combination with optimized helper AAVs that allow for more accurate assessment of ‘starter cells’, enhancement of trans-synaptic spreading, and titration to reduce leakage. Our analysis of VTA inputs indicate that all the major sources of VTA input target each of the transmitter-defined cell types. For example, irrespective of VTA cell type, the dorsal raphe (DR) and lateral hypothalamus (LH) provided the greatest number of cells with afferent connections. Inputs to VTA glutamate neurons were similar to VTA dopamine neurons, but glutamate cells received proportionally less input from ventral striatal regions. Still largely similar, the VTA GABA and dopamine neurons proved most distinct, with dopamine neurons again receiving input from proportionally more striatal neurons, and GABA neurons receiving proportionally more from lateral habenula (LHb) and hindbrain nuclei. By mapping the afferents to each of the three major transmitter-defined VTA cell populations this study allows for a more thorough understanding of the functional relevance of VTA inputs/outputs in addiction and motivational processes.
Results
Previous work has used Rabies virus (Rb)-based approaches to assess cell-type specific afferent inputs to midbrain dopamine neurons (Beier et al., 2015; Lerner et al., 2015; Menegas et al., 2015; Watabe-Uchida et al., 2012). Here we compare whole-brain inputs to each of the three known populations of VTA cell types defined by their recycling neurotransmitter. To define the afferents to genetically identified VTA glutamate neurons we used knock-in mice expressing Cre recombinase under the control of the Slc17a6 locus (vesicular glutamate transporter; VGLUT2-IRES-Cre). To compare glutamate-releasing neurons with neighboring populations of dopamine or GABA neurons in the VTA we used Slc6a3 (dopamine transporter; DAT-IRES-Cre) or Slc32a1 knock-in mice (vesicular GABA transporter, VGAT-IRES-Cre).
Strategy for labeling inputs to defined VTA cell types and key controls
To enable selective visualization of primary inputs to neurotransmitter-defined populations we used a modified Rabies virus EnvA-Rb-ΔG-mCherry (hereafter called Rb-mCherry) in combination with two improved Cre-dependent helper viruses. Rb-mCherry was modified to delete the Rabies glycoprotein (RbG) from the viral genome to prevent transsynaptic spreading and in its place inserted a mCherry fluorescent tag. To restrict initial cellular transduction, Rb was pseudo-typed with the avian sarcoma leukosis virus coat protein EnvA, thus requiring the presence of an avian TVA receptor for primary transduction. To allow for cell-type restricted transduction and subsequent transsynaptic propagation of the modified Rb, mice first received stereotactic injections of two optimized helper Adeno-associated virus (AAV) vectors. The first, AAV2/1-eSyn-DIO-TVA950:YFP (hereafter referred to as AAV-TVA), allows for initial cellular transduction of EnvA-pseudotyped Rb via Cre-dependent expression of an avian TVA receptor fused with yellow fluorescent protein (TVA:YFP). A second, AAV2/1-EF1α-DIO-H2B-tagBFP-Flagx3-T2Am-cB19G (hereafter referred to as AAV-RbG) was mixed with the first and permits retrograde transsynaptic spread by driving Cre-dependent co-expression of the RbG plus a nuclear reporter. To increase efficiency of transsynaptic spreading and reliably detect starter cells, we made three modifications to the H2B-GFP-F2A-B19G cassette used in previous studies (Osakada et al., 2011). The cassette H2B-tagBFP-Flagx3-T2Am-cB19G included (1) codon optimization to increase RbG expression for trans-complementation of Rb-ΔG, (2) a distinctly colored FLAG-tagged histone-bound blue fluorescent protein (BFP) for labeling starter cells, and (3) enhanced multicistronic expression using the improved 2A element T2Am. Three weeks after delivery of the helper virus to the VTA, Rb-mCherry was injected at the same site to infect primary Cre-expressing ‘starter’ cells in the VTA. One week later mice were sacrificed and whole brains sectioned to identify inputs (Figure 1A,B).
Figure 1. Strategy for cell-type specific transsynaptic tracing using modified Rabies virus.
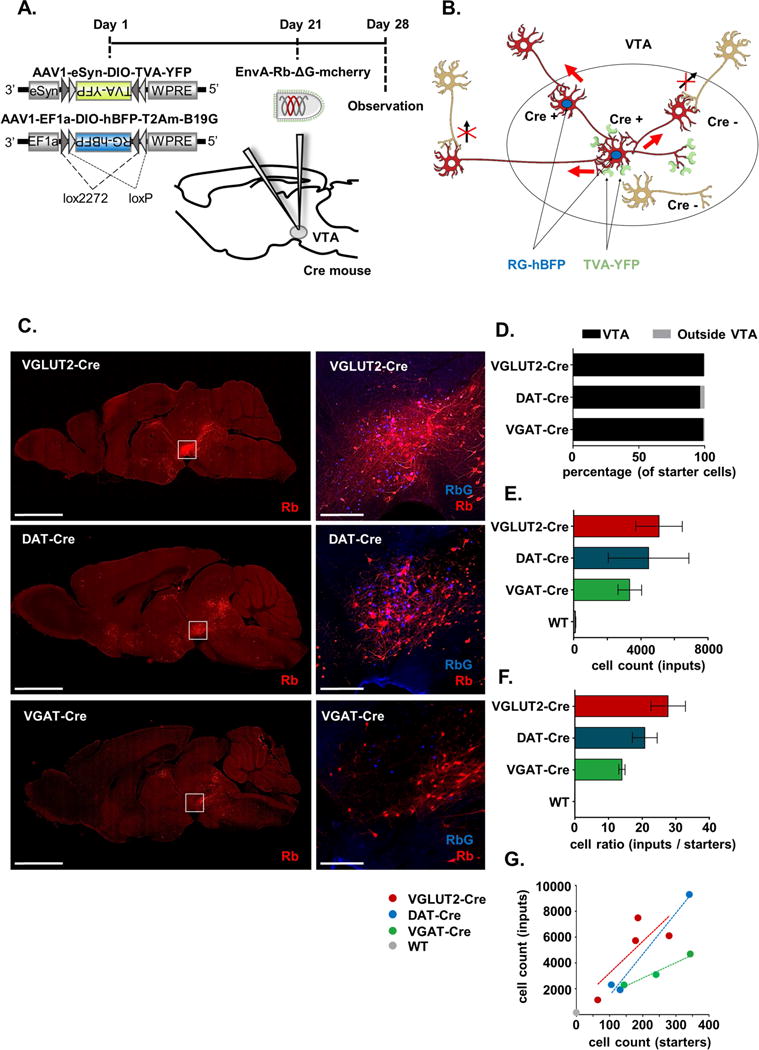
A. Timeline of viral injections. B. Schematic illustrating strategy to achieve cell type-specific transsynaptic tracing. TVA receptors (green) and RbG-hBFP (blue nuclei) expression are Cre-dependent. EnvA-Rb-ΔG-mCherry initially infects TVA-expressing cells and relies on RbG-hBFP expression for transsynaptic spread to afferent inputs. Cre positive starter cells are defined as those expressing both RbG (BFP) and Rb (mCherry). C. Native Rb-mCherry and RbG:BFP fluorescence in sagittal sections from Cre-expressing mouse lines; white boxes and higher power images represent VTA; scale = 2.5 mm (left) and 250 μm (right). D. Percentages of starter cells present within and outside of the VTA. E. Unadjusted (raw) counts of the total number of input cells (± SEM). F. Ratio of input cell counts to starter cell counts (± SEM). G. Scatterplots of input cell counts and starter cell counts, points represent individual animals and lines represent linear regressions. See also Figure S1 and S2.
However, to verify the specificity of the strategy we performed three essential control experiments. First, to determine if the modified Rb-mCherry relies exclusively on TVA for initial cellular transduction we injected Rb-mCherry without prior injection of the helper AAVs. This is an important control to ensure that each batch of pseudotyped Rb is not functionally contaminated with RbG-coated Rb, although we confirmed no infection of HEK293t cells with the EnvA-pseudotyped Rb-mCherry used for in vivo injection. In 5 animals injected and brains sectioned, we never detected mCherry+ cells (Figure S1A), demonstrating that the EnvA pseudotyping entirely prevented Rb-mCherry entry absent cellular TVA expression.
Leakage of the TVA-expressing helper virus in non-Cre expressing cells was encountered in previous studies (Watabe-Uchida et al., 2012). Even though leak TVA expression may be undetectable by immunochemistry, it can be revealed by our second control experiment where we injected both AAV helpers at ‘stock’ concentrations (i.e., greater than 2 × 10¹²) into Cre-negative wild type (WT) mice prior to injection of the Rb-mCherry (n=2). In WT mice, we observed substantial mCherry+ cells in the VTA (Figure S1B). This, despite no observed TVA:YFP (or hBFP) fluorescence (Figure S1B), suggests a very low ‘leak’ expression of TVA:YFP independent of Cre-mediated recombination, thereby allowing for Rb entry via high-affinity interaction of TVA with EnvA followed by Rb amplification. Importantly, and consistent with previous observations, we saw no evidence of Rb-driven mCherry expression outside of the immediate injection sites, indicating that transsynaptic spread does not occur absent robust RbG expression. Nonetheless, the presence of large numbers of mCherry+ cells near the injection site in WT mice limits identification of local or proximal connections. Because very little TVA expression is required for initial transduction, we reasoned that dilution of the AAV-TVA would allow us to identify conditions under which injection into WT mice led to few mCherry+ cells, while injection into Cre-expressing mice led to labeling of many cells. Indeed, a 1:2000 dilution of stock AAV-TVA (i.e., 200 nl at 2.4 × 10¹⁰ genomes/ml) led to minimal mCherry-labeling in the VTA of WT controls (Figure S1B) compared to Cre+ mice (Figure 1C).
In some circuits some preparations of AAV can drive gene expression in afferent populations of neurons, presumably by AAV transduction of terminals and retrograde transport to cell bodies (Castle et al., 2014; Menegas et al., 2015; Watabe-Uchida et al., 2012). It is thus possible that Cre+ cells that project to VTA may express low levels of TVA via the retrograde AAV mechanism. Even low levels of TVA, if trafficked to nerve terminals in the VTA, may allow for Rb transduction and mCherry expression. Such a phenomenon would invalidate our ability to define inputs to specific VTA cell-types because VGLUT2-Cre+ or VGAT-Cre+ neurons in afferent regions could express mCherry irrespective of which cell type they target. Thus for our third control experiment we injected diluted AAV-TVA without the second helper AAV-RbG, into groups of VGLUT2-, DAT-, or VGAT-Cre mice (n=3/genotype). Three weeks later we injected Rb-mCherry and, as expected, observed mCherry+ cells in the VTA. But in regions known to receive input from VTA neurons we identified only mCherry+ fibers (Figure S1C); no mCherry-expressing cell bodies were detected distal from the site of injection (Figure S1C). We therefore conclude that using our conditions any retrograde transport of AAV-TVA is insufficient to allow for direct Rb-mCherry transduction following VTA injection.
Identification of VTA ‘starter’ cell types defined by transmitter
Mice expressing Cre under the control of VGLUT2 (n=6), DAT (n=6), or VGAT (n=5), as well as WT mice (n=4) were each injected with diluted AAV-TVA and AAV-RbG into the VTA. Three weeks later they were injected with Rb-mCherry into the same location and sacrificed one week later (Figure 1A). Starter cells were identified as cells expressing both the RbG (defined as nuclear hBFP+) and mCherry (Figure 1C). We defined starter cells thus because it is the expression of the RbG that allows Rb to shed and spread transsynaptically. Zero starter cells were detected in WT mice and mice with starter cells best restricted to VTA were included in the cell counts (n=3–4/genotype) (Figure 1D, Figure 2). In all included cases, greater than 90% of starter cells were located within the VTA (File S1). Anatomical specificity of the starter cell population was important for all cell types, but arguably most critical for the VGAT-Cre mice, where spread into the GABA neuron-rich interpeduncular nucleus (IP) led to massive Rb-mCherry in the medial habenula (MHb) (Figure S2). Though an equivalent number of starter cells were labeled across the three genotypes, VTA glutamate neurons appeared to receive more inputs per starter cells (27.8 ± 5.1 input cells/starter cell) than GABA neurons (14.1 ± 0.9), with VTA dopamine neurons intermediate (20.8 ± 3.7) (Figure 1F,G).
Figure 2. Localization of starter cells within VTA.
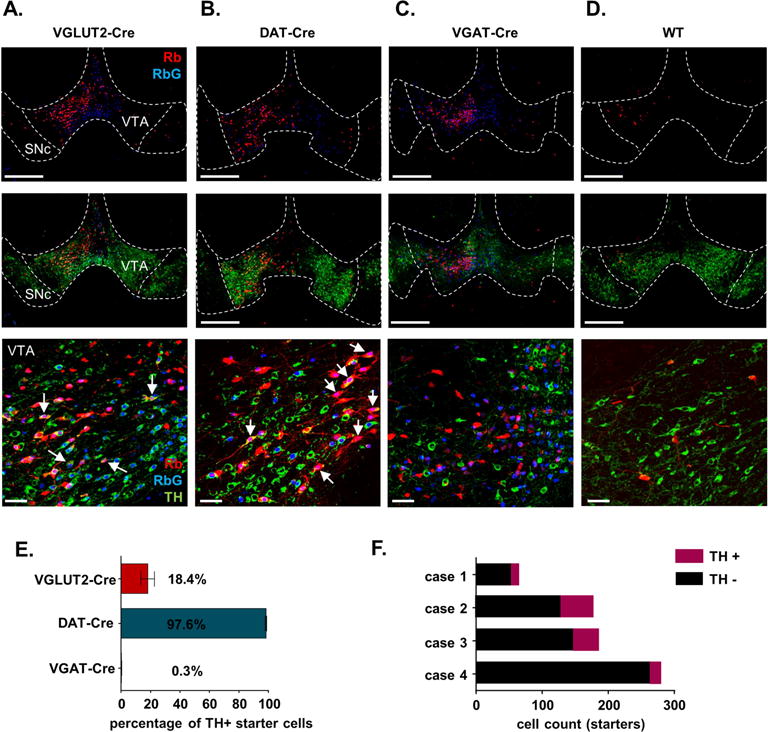
A–D. Representative coronal images of starter cells contained within VTA. Native Rabies-mCherry fluorescence is shown in red. Immunolabeling was used to better visualize RbG-expressing cells that co-express the histone-bound FLAG-tagged BFP as shown in blue. And costaining to identify TH-expressing dopamine neurons (green). Arrows represent triple-labeled cells, i.e., starter cells that co-localize for TH. Scale = 200 μm (upper panels), and 50 μm (lower panel). E. Proportion of starter cells that label for TH across genotype (± SEM). F. Cell counts of TH-negative and TH-positive starter cells for each of the 4 VGLUT2-Cre mice used in this study.
To verify that starter cells appropriately represented transmitter-defined cell types, we stained sections through the VTA for the dopamine neuron marker tyrosine hydroxylase (TH). Because native BFP fluorescence was particularly sensitive to immunohistochemical procedures and showed more pronounced photobleaching upon imaging, we co-labeled for the FLAG epitope to better visualize nuclear BFP expression. As expected, 97.6 ± 1.2% of starter cells in DAT-Cre mice were TH+ (Figure 2B,E). We found that 18.4 ± 4.5% of VGLUT2-Cre starter cells were TH+ (Figure 2A,E,F), consistent with numerous reports demonstrating overlap of TH with VGLUT2 expression and co-release of dopamine with glutamate (Hnasko et al., 2010; Hnasko et al., 2012; Stuber et al., 2010; Yamaguchi et al., 2011). Finally, consistent with previous evidence demonstrating that canonical GABAergic markers do not appreciably co-localize with dopaminergic markers (Chieng et al., 2011), only 0.3 ± 0.2% of the VGAT-Cre starter cells were TH+ (Figure 2C,E).
Identification of inputs to transmitter-defined VTA cell types
To assess input cell numbers we manually counted mCherry+ cells throughout the rostrocaudal axis of the brain, sampling every fifth 30-μm section from Bregma +2.8mm to −5.8mm. Macrostructure features and DAPI counterstain were used to classify mCherry+ cells by brain region according to the Paxinos mouse brain Atlas (Paxinos & Franklin, 2001). Brain regions were then organized into sub-area and area. For example, nucleus accumbens core (region) is included in the ventral striatum (sub-area) of the striatum (area). mCherry+ cells detected in the VTA itself and in regions directly surrounding the VTA, that is, the substantia nigra pars compacta (SNc), interpeduncular nucleus (IP), and red nucleus (R) (File S1) were excluded in the total input cell count because we could not distinguish cells expressing low levels of TVA and thus competent for direct infection by injected Rb-mCherry, from cells making local connections. Cells detected in the medial habenula (MHb) were not included in this analysis as the presence of a small number of starter cells in the IP (specifically in VGAT-Cre animals) led to large numbers of mCherry-labeled cells in the MHb (Figure S2).
Examples of major inputs across cell type are shown in Figure 3. Compared to other cell types, the VTA glutamate neurons received more input per starter cell from cortex; dopamine neurons received more inputs per starter cell from striatum; and GABA neurons tended to receive less input overall when considered as a function of starters (Figure 3H). However, interpretation of input data normalized by starter cells is complicated by the distinct possibility of convergent inputs, resulting in fewer inputs per starter cell as the number of starter cells increase. This can be visualized as shallower slopes, notably for inputs/starter to VTA GABA neurons (Figure 3A–G). Thus we also calculated the total fraction of input each cell type receives as a fraction of all inputs to that cell type; e.g., calculating that just 3.6 ± 0.3% of all inputs to dopamine neurons come from cortical regions. These data can then be represented and considered in a variety of ways; though it is essential to hold in mind that the number of cells making afferent connections (inputs) to a defined VTA cell type need not denote functional significance. Spreadsheets with all cell counts broken down by brain areas, sub-areas, and regions are provided in File S1.
Figure 3. Inputs to transmitter-defined VTA cells normalized by starter cell counts.
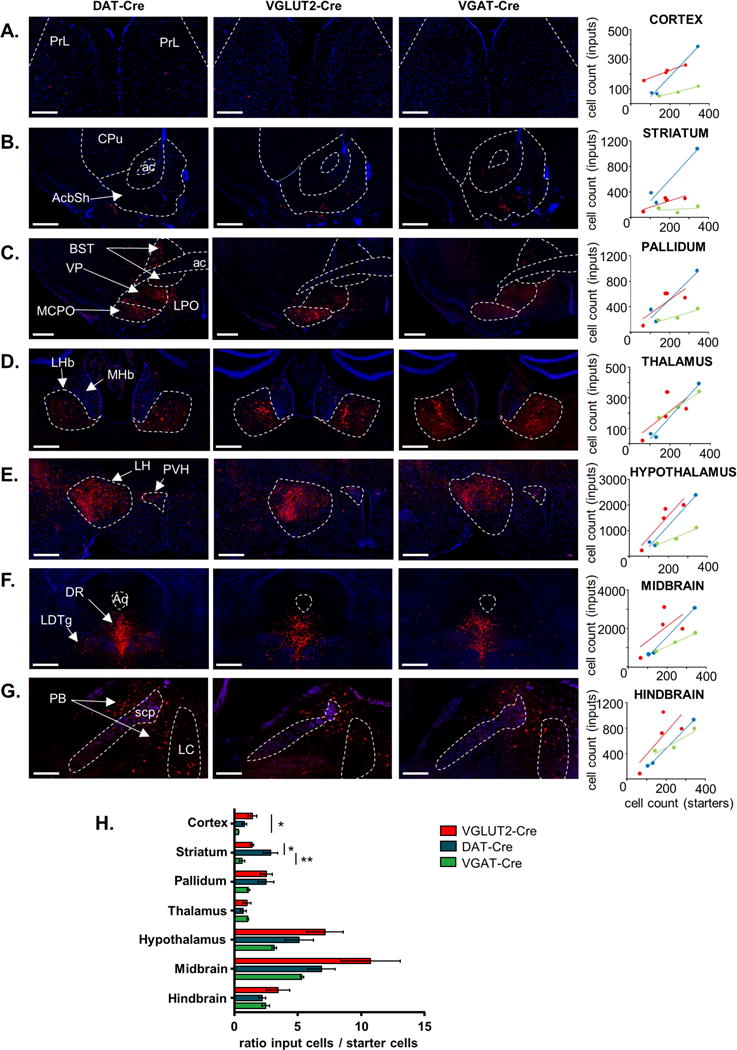
A–G. Example coronal images showing Rb-mCherry+ (red) input cells to transmitter-defined VTA cells from select brain regions. Scatterplots: individual points represent animals and lines are linear regressions. Annotations: ac: anterior commissure, PrL: prelimbic cortex, CPu: caudate putamen, AcbSh: Nucleus accumbens shell: BST: bed nucleus of the stria terminalis, VP: ventral pallidum, MCPO: magnocellular preoptic nucleus, LPO: lateral preoptic area, MHb: medial habenular nucleus, LHb: lateral habenular nucleus, LH: lateral hypothalamus, PVH: paraventricular nucleus of the hypothalamus, DR: dorsal raphe nucleus, LDTg: laterodorsal tegmental nucleus, PB: parabrachial nucleus, LC: locus coeruleus Aq: aqueduct, scp: superior cerebellar peduncle. Blue contrast represents DAPI (A–E) or background autofluorescence (F–G); scale= 500 μm (B, C, E, F) and 250 μm (A, D, G). H. Histogram representing ratio of input cell numbers relative to starter cell counts for the three genetically-defined VTA cell type across major brain areas (± SEM); *:p<0.05, **:p<0.01.
We found that all of the main inputs to VTA project to each of the transmitter-defined cell types (Figure 4A,B). These results are consistent with recent observations by others examining inputs to projection-target defined dopamine neurons (Beier et al., 2015; Watabe-Uchida et al., 2012); and indicate that inputs to VTA are not qualitatively constrained by VTA cell type. However, even at the macro level of brain area, quantitative differences begin to emerge. For example, VTA dopamine neurons receive a higher proportion of their input from striatal areas, whereas VTA GABA neurons receive a greater proportion of their input from thalamic and hindbrain regions (Figure 4A,B). These data also indicate that most afferent control over VTA neurons arise from outside the telencephalon. For example, the midbrain, hindbrain, and hypothalamus represent a combined 68 ± 3, 75 ± 3, and 78 ± 1% of all inputs to, respectively, VTA dopamine, glutamate, or GABA neurons. Of course these brain areas include many sub-areas, each composed of multiple discrete regions, many of which are themselves heterogeneous.
Figure 4. Inputs to transmitter-defined VTA neurons normalized to total inputs.
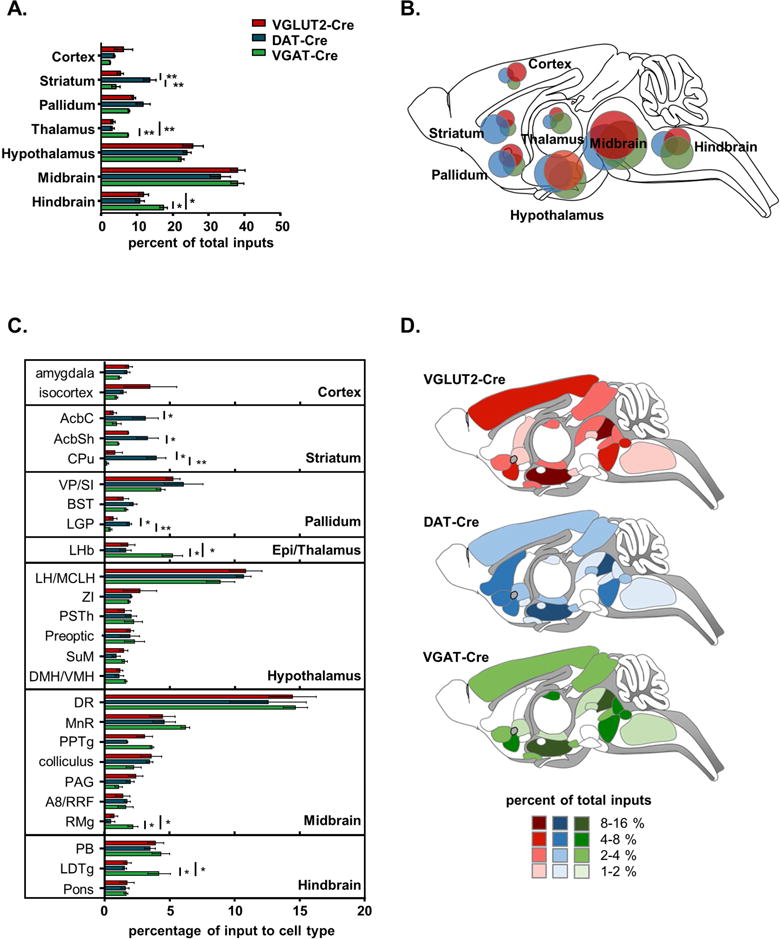
A. Percentages of total inputs per major brain area across transmitter-defined cell types (± SEM). B. Schematic of input weights by major brain area; areas of circles are proportional to fraction of total inputs coming from each brain area. C. Percentages of total inputs per sub-area or region, with the top 25 inputs represented (± SEM). D. Color-coded schematic of input weights by subarea or region the percentages of total inputs per regions for each VTA cell type. Regions or sub-areas accounting for less than 1% of total input are not included in this representation. See Figure S3 for brain region key and File S1 for detailed counts. *: p<0.05, **: p<0.01, ***: p<0.001.
Dissecting these macro brain areas into the 25 sub-areas and regions that provided the greatest share of input (i.e., 75–80% of the total VTA input) revealed additional distinctions (Figure 4C,D and Figure 5). For example each of the 3 striatal regions examined as well as the globus pallidus (LGP) preferentially targeted dopamine neurons. Cortical regions tended to preferentially target VGLUT2+ neurons. Neurons in the lateral habenula (LHb) displayed a clear preference for VGAT+ neurons in the VTA, though they did not entirely avoid dopamine or glutamate cells. Also notable, VGAT+ neurons received proportionally more input from the laterodorsal tegmental nucleus (LDTg) and raphe magnus nucleus (RMg). Many other regions also provide input to VTA, though no other regions represented more than 1% of the total input; for a detailed list of regions and percentages of inputs see File S1.
Figure 5. Differential analysis of inputs to transmitter-defined VTA cells types.
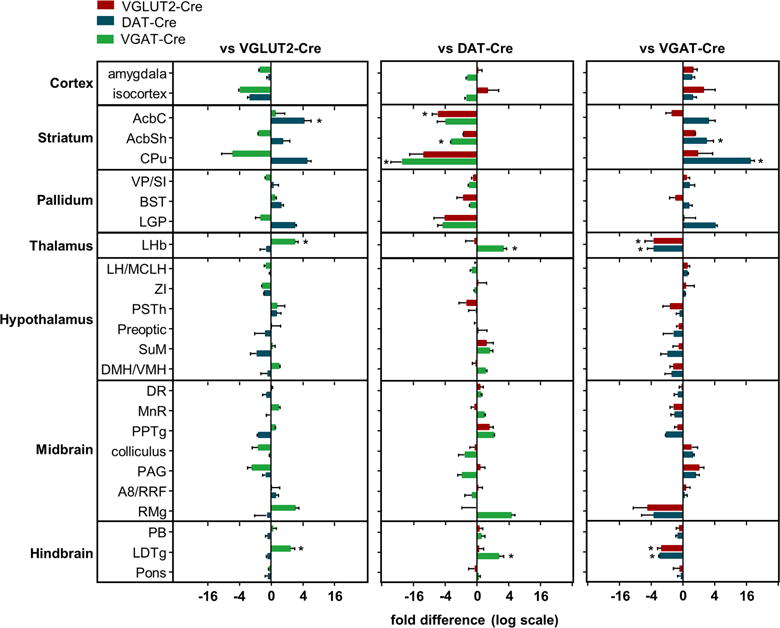
Data normalized to total inputs and assessed by negative binomial models and the DESeq package. Analysis allowing for comprehensive pairwise comparisons are represented here as fold differences (on a log scale) in weighted inputs relative to the other VTA cell types (± SEM). For a detailed description see Supplemental Experimental procedures and Tables S1–S6. *: p<0.05.
Immunochemical characterization of VTA afferents by cell type
The largest source of VTA input from the telencephalon was from the ventral pallidum (VP), providing 6.1 ± 1.5, 5.3 ± 0.5 and 4.3 ± 0.3 % of total input to VTA dopamine, glutamate, and GABA neurons, respectively. The VP is composed principally of GABAergic projection neurons (Root et al., 2015), a sub-population of which label for the calcium-binding protein parvalbumin (PV). We labeled sections through the VP for PV and quantified the fraction of Rb-mCherry labeled cells that co-label for PV. Though not reaching statistical significance in our small sample size, VTA dopamine neurons tend to receive more input from PV-labeled cells per starter neuron (Figure 6A), suggesting that PV neurons may play a specialized role in the control of dopamine neurons.
Figure 6. Immunohistochemical characterization of afferent inputs to VTA from ventral pallidum and lateral hypothalamus.
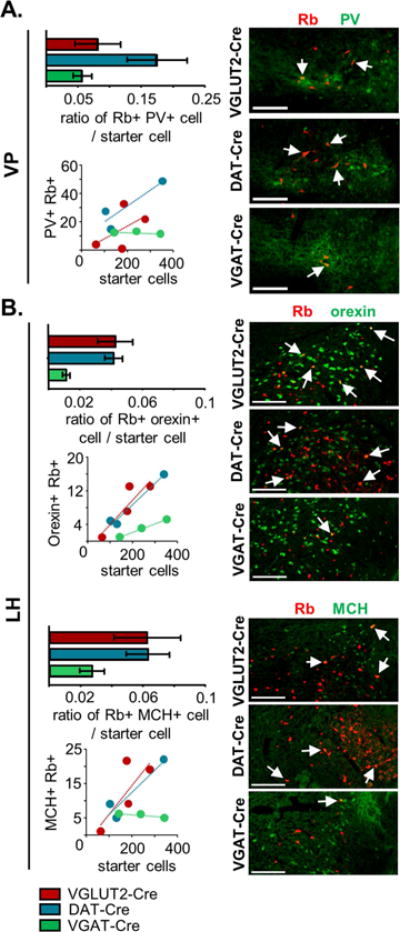
A. Quantification of pallidal parvalbumin (PV)-expressing afferents to transmitter-defined VTA cell types. Histogram represents the ratio of Rb-mCherry+ cells immunolabeled with anti-PV in the ventral pallidum (VP) relative to the number of starter cells (± SEM). B. Quantification of hypothalamic orexin-expressing and melanocortin concentrating-hormone (MCH)-expressing afferents to VTA cell types. Histograms represent the ratio of Rb-mCherry+ cells immunolabeled with anti-orexin (top) or anti-melanocortin concentrating-hormone (MCH) (bottom) in the lateral hypothalamus (LH) relative to the number of starter cells (± SEM). Points in scatterplots represent individual animals and lines are linear regressions. Example coronal images for each genotype show Rb-mCherry expression (red) along with immunostaining (green) against PV, orexin, or MCH. Arrows represent co-localizing cells; scale = 200 μm. See also Figure S4.
The largest two inputs to the VTA were from the dorsal raphe (DR) and the lateral hypothalamus (LH), and from these regions we observed no significant difference by transmitter-defined cell type (Figure 4C). However, the DR and LH are composed of heterogeneous populations of projection neurons and subpopulations of neurons may preferentially target transmitter-defined VTA neurons. In the LH we characterized two subpopulations of neurons using the peptide markers melanocortin-concentrating hormone (MCH) and orexin (also called hypocretin); each of which labeled only a small fraction of Rb+ VTA inputs from LH. The number of orexin co-labeled LH inputs per VTA starter cell was greater in the VGLUT2-Cre and DAT-Cre compared to VGAT-Cre mice (Figure 6B). In the case of MCH, a lower ratio of Rb/MCH inputs per starter cell was also observed for the VTA GABA population but again did not reach statistical significance (Figure 6B).
As noted earlier, VTA dopamine neurons received a smaller fraction of their inputs from the PPTg and LDTg when compared to glutamate and especially GABA neurons (Figure 4C). The PPTg and LDTg are well known sources of cholinergic projection neurons, though GABA and glutamate neurons are also abundant, cholinergic neurons represent about 25% of the total (Wang and Morales, 2009). However, the number of Rb-mCherry+ cells co-positive for ChAT did not differ as a function of starter cells (Figure S4A). The DR was the largest single source of inputs to the VTA in our study. Known best for its serotonin neurons, the DR and median raphe (MnR) also contain large populations of GABA and glutamate projection neurons (Gocho et al., 2013). We therefore labeled for TpH to identify the proportion of serotonergic inputs by VTA cell type (Figure S4B), though no significant differences were observed.
Discussion
Using classical tracers neuroanatomists have described VTA connectivity to and from a multitude of brain regions (Bjorklund and Dunnett, 2007; Carr and Sesack, 2000; Fields et al., 2007; Geisler and Zahm, 2005; Ikemoto, 2007; Phillipson, 1979; Swanson, 1982). However, as we begin to appreciate the physiological and behavioral relevance of VTA heterogeneity in behavior and disease (Fields et al., 2007; Lammel et al., 2014; Volman et al., 2013), it becomes crucial to understand how heterogeneous VTA cell types are controlled via afferent connectivity. Modern tracing vectors coupled with mouse genetics make it possible to subsect across various dimensions of heterogeneity and trace connections; indeed, two recent studies have focused on projection target-defined VTA dopamine neurons (Beier et al., 2015; Menegas et al., 2015). However, the VTA also contains sizable populations of GABA and glutamate-releasing neurons that play discrete roles in regulating reward-related processes. In this study we provide a comprehensive description of inputs to each of these neurotransmitter-defined VTA cell types. To our surprise, we found that each of these transmitter-defined populations receive qualitatively similar afferent input, with more afferents labeled in dorsal raphe, lateral hypothalamus, ventral pallidum, and striatal regions. Nonetheless, quantitative differences were observed with glutamate neurons tending to receive proportionally more input from cortical regions, dopamine neurons from basal ganglia, and GABA neurons from the lateral habenula and LDTg. Further, comparing the ratio of inputs to starter cells reveals that inputs to VTA GABA neurons show more convergence, consistent with a more uniform model of afferent control.
The most pronounced finding in our study is that the organization of afferent input to VTA are, qualitatively, independent of transmitter-defined VTA cell type. This is counter to our initial hypothesis that excitatory, inhibitory, and neuromodulatory VTA cell types, that convey distinct types of reward-relevant information, might receive highly distinctive patterns of afferent input. However, our results are generally concordant with recent studies using similar approaches to compare the inputs to dopamine neurons defined by their projection target. Those studies did identify some distinctive connections to subpopulations of dopamine neurons that target the lateral NAc (Beier et al., 2015) or posterior striatum (Menegas et al., 2015); but overall indicated that inputs to projection-target defined VTA dopamine neurons were quite similar.
Though qualitative similarity was the rule, we did identify several significant quantitative differences. For example, though the cortex provides a proportionally small and diffuse input to VTA, cortical regions as a whole make more inputs per starter cell on to VTA glutamate neurons. These inputs comes from a variety of cortical regions, predominantly including somatosensory, motor, insular, and cingulate cortices. That proportionally few input cells were observed in cortical regions appears to be compatible with earlier whole-brain quantitative approaches (Geisler and Zahm, 2005; Phillipson, 1979). The small number of input cells observed in the anterior cortex could be interpreted in different ways: (i) cortical inputs may be relatively less influential than subcortical inputs to VTA, (ii) relatively few cortical neurons could make strong or large numbers of synapses, (iii) cortico-VTA synapses may be less efficiently labeled using our tracing strategy. Indeed, the high sensitivity of Rb-based approaches may lead to overweighting the implied influence of afferent regions that contain many connected cells with low synaptic incidence; whereas regions that may contain fewer connected cells but with high synaptic incidence, or making synapses resistant to transsynaptic spread, could be underweighted.
We also find that basal ganglia nuclei, including the shell and core regions of the NAc as well as the dorsal striatum (CPu) and external globus pallidus (LGP) each provide proportionally more input to dopamine compared to non-dopamine VTA neurons. This finding is in apparent contradiction to optogenetic circuit-mapping studies that found that NAc projection neurons preferentially target non-dopamine VTA neurons (Bocklisch et al., 2013; Xia et al., 2011). It is possible that the NAc to VTA dopamine projections we here and others have identified anatomically (Beier et al., 2015; Bolam and Smith, 1990; Grace and Bunney, 1985; Lerner et al., 2015; Menegas et al., 2015; Watabe-Uchida et al., 2012) synapse on to distal dopamine dendrites absent in the horizontal slice preparations, differ across species, or are primarily peptidergic.
VGAT+ neurons in the VTA also display several distinct features when compared to DAT+ and VGLUT2+ neighbors. First, they tend to receive more convergent input, i.e., fewer input cells per starter cell when more starter cells are labeled. This suggests that afferent control over VTA GABA neurons is more homogenous, and consequently GABA output may function in a more uniform manner. Indeed, we also report here that VTA GABA neurons receive proportionally more input from the LHb. Though we find that LHb does not entirely avoid VTA dopamine and glutamate neurons, this finding is very much consistent with current models where LHb functionally inhibits VTA dopamine neurons through feed-forward activation of GABA neurons (Balcita-Pedicino et al., 2011; Brinschwitz et al., 2010; Proulx et al., 2014). We also observed a proportionally larger input from the LDTg to VTA GABA neurons, which is interesting in light of the observation that photostimulation of a mixed LDTg input to VTA was sufficient to drive a dopamine-dependent conditioned place preference (Lammel et al., 2014); potentially highlighting that the proportional weight of an input region need not correlate with functional importance.
The most abundant inputs irrespective of cell type were from dorsal raphe, lateral hypothalamus, and ventral pallidum. We used immunohistochemical approaches to immunochemically identify subpopulations of cells within these and other select regions for peptide markers as well as enzymatic markers indicative of serotonin or acetylcholine biosynthesis. Though orexin+ and MCH+ inputs from LH tended to preferentially target non-GABA neurons in the VTA; and PV+ neurons may have preferentially targeted dopamine neurons, these observations did not reach statistical significance once corrected for multiple comparisons. This highlights an important limitation of ours and previous studies using similar approaches to quantitatively compare VTA inputs: low sample size, large numbers of measurements, and consequently low statistical power for group comparisons. The VTA receives inputs from a large number of brain regions and thus several hundred measurements are made per group; and these measurements range across several orders of magnitude, limiting the utility of statistical tests which rely on normality. We thus limited our quantitative assessments to two approaches. One-way ANOVAs were used to compare the three genotypes within equi-variant regions followed by a Tukey posthoc correction for multiple comparisons. This approach applies separate ANOVAs across each brain region and fails to consider the dataset in its entirety. Because of the small sample size and a large number of comparisons, we also applied methods developed to probe changes in gene expression across groups (Love et al., 2014). This approach leverages information across region in estimating the parameters of negative binomial generalized linear models fit to each region. This analysis, represented in Figure 5 (see also Supplemental Experimental procedures and Tables S1–S6), allows for pairwise comparisons of inputs across region and cell type and produced results highly concordant with ANOVA.
Beier and colleagues recently published a report comparing inputs to VTA dopamine versus GABA neurons. Though the overall pattern and respective weights of the afferents were similar across our studies, there are several notable differences. As discussed above, we find that striatal regions preferentially target dopamine neurons while GABA neurons receive proportionally more input from LHb and LDTg; whereas the previous study reported no significant differences between these cell types (Beier et al., 2015). Several methodological differences could contribute to this including our use of different Cre-driver lines, viral serotypes and promoters, or differences in the number and location of starter cells. Potentially relating to the latter is our strategy of injecting AAV-TVA helper virus diluted by two to three orders of magnitude compared to previous studies targeting VTA cell types. We adopted this strategy to limit the potential for low level expression of TVA outside of the VTA due to spread or retrograde transport of AAV, or outside of the cell-type of interest due to leak TVA expression from the DIO cassette. Indeed, though the pseudotyped Rb vector we used produced no detectable mCherry expression when injected into mice not prior injected with helpers, copious mCherry+ cells were present at the injection site in wild-type mice (lacking Cre) previously injected with ‘stock’ concentrations (i.e., >1012) of helper AAVs. That we did not find Rb-mCherry expression at sites distal to the VTA, nor evidence of TVA:YFP or RbG-BFP fluorescence within the VTA, suggests that very low level Cre-independent ‘leak’ expression of TVA:YFP suffices for entry of pseudo-typed Rb-mCherry, but that higher Cre-dependent expression of RbG is required for transsynaptic spread (Miyamichi et al., 2013; Weissbourd et al., 2014). By selecting a highly diluted concentration of AAV-TVA we minimized the potential for primary infection by Rb-mCherry in Cre-negative cells and increased the proportion of starter cells restricted to VTA. However, this strategy also reduces the total number of starter cells which may introduce greater sampling bias. Another difference between our approach and that taken in prior studies is our use of a bicistronic AAV helper vector to express histone-bound (i.e., nuclear) FLAG-tagged BFP in RbG-expressing cells. Because it is the expression of the RbG that allows for transsynaptic spread, any neuron expressing Rb-mCherry and RbG-BFP will function as a starter cell, whether or not it expresses TVA or was infected by primary (i.e., injected Rb-mCherry) or subsequently by Rb-mCherry amplified in vivo.
Using this approach we were able to target equivalent number of starter cells for each of the three cell types. Though our injections were medially biased to focus on the VGLUT2+ population, these results suggest that the relative proportions of these cell types, especially in medial VTA, may be more balanced than generally appreciated. Indeed, estimates of VGLUT2+ VTA cells vary greatly depending on the approach used (Kawano et al., 2006; Nair-Roberts et al., 2008; Yamaguchi et al., 2011), and Cre-dependent AAV-mediated expression may be particularly sensitive to low expression levels. Additionally, the ability of VTA neurons to co-release multiple transmitters dictates that some cells will be represented in more than one group. In this study, we found that 18.4 ± 4.5 % of VGLUT2+ starter cells labeled for the dopamine neuron marker TH, likely contributing to the similarity between inputs received on to DAT+ and VGLUT2+ cell types. Dopamine neurons can also co-release GABA, however GABA co-release relies on non-canonical mechanisms of GABA synthesis and vesicular packaging (Kim et al., 2015; Tritsch et al., 2012), and we find that fewer than 1% of VGAT-Cre starters co-labeled for TH. Selective labeling of and tracing of inputs only to neurons that express both dopamine and glutamate markers, or to glutamate but not dopamine markers would be of great interest but will require the development of new mouse driver lines and viral vectors.
In summary, we showed that VTA glutamate, dopamine, and GABA neurons receive qualitatively similar but quantitatively distinct patterns of input from many and diverse brain regions. Dopamine and GABA neurons show several marked differences, while the VGLUT2+ neurons are generally intermediate between the two, perhaps an expression of their ability to co-release either dopamine or GABA. This work adds to our growing body of knowledge on the input/output relationship of VTA cell types and will be used to further unravel the functional importance of distinct mesolimbic sub-circuits. Understanding how distinct populations of anatomically and neurochemically distinct circuits are connected to control behavior promises to provide opportunities to treat intractable mental illness such as addiction.
Experimental procedures
Animals
Both male and female mice were included and all experiments performed in accordance with protocols approved by the University of California San Diego Institutional Animal Care and Use Committee (IACUC). Mice were intracranially injected into the VTA with 200 nL of 1:1 mixture AAV-TVA and AAV-RbG and 3 weeks later, 125 nL of Rb-mCherry injected at the same coordinates. Animals were transcardially perfused with 4% paraformaldehyde seven days after Rb-mCherry injection and 30-μm coronal sections were collected for quantitative assessment and immunostaining. See Supplemental Experimental Procedures for details.
Cell counts
Counting of starter cells, afferent input cells and immunohistochemically-characterized cells was conducted manually and blindly on one 30-μm section every 150μm along the rostral caudal extent of the brain. Cells were considered starters when clearly visible native cytoplasmic mCherry fluorescence and nuclear immunolabel against the Flag epitope on RbG. TH was assessed on the same sections and cells identified as TH positive when soma and cell processes clearly overlapped for TH immunolabel and native mCherry. Neurons were considered VTA afferent inputs when the red fluorescence (mCherry) was filling objects that showed clear borders and processes. Regions were identified by a single investigator using the Paxinos Mouse Brain Atlas (Paxinos & Franklin 2001) and grouped into areas and sub-areas based on the Allen Brain Atlas classification. For details on immunohistochemical characterization, counting, and statistics see Supplemental Experimental Procedures.
Supplementary Material
Highlights.
Dopamine, GABA and glutamate VTA neurons receive qualitatively similar inputs
Hypothalamus and raphe provide the largest inputs to each VTA cell type
Dopamine neurons receive proportionally more input from basal ganglia
Glutamate neurons receive more cortical inputs
Acknowledgments
The project was supported by funds from National Institutes of Health (NIH) grants K01DA026504 (TSH) and R01DA036612 (TSH). LF is an Attias Family Foundation Investigator supported by a 2014 NARSAD Young Investigator Grant from the Brain & Behavior Research Foundation. Support was also received through the Tobacco-related disease research program fellowship 22FT-0063 (JHY), Japan Society for the Promotion of Science (FO), and the Japan Science and Technology Agency (FO). Biostatistical analyses were supported by NIH grant UL1TR001442 to the UCSD CTRI. Work in the lab of EMC was supported by NIH grants EY022577 and MH063912, the Gatsby Charitable Foundation, and a Hughes Collaborative Innovation Award from HHMI.
Footnotes
Publisher's Disclaimer: This is a PDF file of an unedited manuscript that has been accepted for publication. As a service to our customers we are providing this early version of the manuscript. The manuscript will undergo copyediting, typesetting, and review of the resulting proof before it is published in its final citable form. Please note that during the production process errors may be discovered which could affect the content, and all legal disclaimers that apply to the journal pertain.
Contributions
Conceptualization, LF & TSH; Methodology, LF, FO, EMC, JHY & TSH; Formal Analysis, LF & JAP; Investigation, LF, JD, RR and ABJ; Writing, LF & TSH.
References
- Alsio J, Nordenankar K, Arvidsson E, Birgner C, Mahmoudi S, Halbout B, Smith C, Fortin GM, Olson L, Descarries L, et al. Enhanced sucrose and cocaine self-administration and cue-induced drug seeking after loss of VGLUT2 in midbrain dopamine neurons in mice. J Neurosci. 2011;31:12593–12603. doi: 10.1523/JNEUROSCI.2397-11.2011. [DOI] [PMC free article] [PubMed] [Google Scholar]
- Balcita-Pedicino JJ, Omelchenko N, Bell R, Sesack SR. The inhibitory influence of the lateral habenula on midbrain dopamine cells: ultrastructural evidence for indirect mediation via the rostromedial mesopontine tegmental nucleus. J Comp Neurol. 2011;519:1143–1164. doi: 10.1002/cne.22561. [DOI] [PMC free article] [PubMed] [Google Scholar]
- Beier KT, Steinberg EE, DeLoach KE, Xie S, Miyamichi K, Schwarz L, Gao XJ, Kremer EJ, Malenka RC, Luo L. Circuit Architecture of VTA Dopamine Neurons Revealed by Systematic Input-Output Mapping. Cell. 2015;162:622–634. doi: 10.1016/j.cell.2015.07.015. [DOI] [PMC free article] [PubMed] [Google Scholar]
- Bjorklund A, Dunnett SB. Dopamine neuron systems in the brain: an update. Trends Neurosci. 2007;30:194–202. doi: 10.1016/j.tins.2007.03.006. [DOI] [PubMed] [Google Scholar]
- Bocklisch C, Pascoli V, Wong JC, House DR, Yvon C, de Roo M, Tan KR, Luscher C. Cocaine disinhibits dopamine neurons by potentiation of GABA transmission in the ventral tegmental area. Science. 2013;341:1521–1525. doi: 10.1126/science.1237059. [DOI] [PubMed] [Google Scholar]
- Bolam JP, Smith Y. The GABA and substance P input to dopaminergic neurones in the substantia nigra of the rat. Brain Res. 1990;529:57–78. doi: 10.1016/0006-8993(90)90811-o. [DOI] [PubMed] [Google Scholar]
- Brinschwitz K, Dittgen A, Madai VI, Lommel R, Geisler S, Veh RW. Glutamatergic axons from the lateral habenula mainly terminate on GABAergic neurons of the ventral midbrain. Neuroscience. 2010;168:463–476. doi: 10.1016/j.neuroscience.2010.03.050. [DOI] [PubMed] [Google Scholar]
- Callaway EM. Transneuronal circuit tracing with neurotropic viruses. Curr Opin Neurobiol. 2008;18:617–623. doi: 10.1016/j.conb.2009.03.007. [DOI] [PMC free article] [PubMed] [Google Scholar]
- Card JP, Enquist LW. Transneuronal circuit analysis with pseudorabies viruses. Curr Protoc Neurosci. 2014;68:1 5 1–1 5 39. doi: 10.1002/0471142301.ns0105s68. [DOI] [PMC free article] [PubMed] [Google Scholar]
- Carr DB, Sesack SR. GABA-containing neurons in the rat ventral tegmental area project to the prefrontal cortex. Synapse. 2000;38:114–123. doi: 10.1002/1098-2396(200011)38:2<114::AID-SYN2>3.0.CO;2-R. [DOI] [PubMed] [Google Scholar]
- Castle MJ, Gershenson ZT, Giles AR, Holzbaur EL, Wolfe JH. Adeno-associated virus serotypes 1, 8, and 9 share conserved mechanisms for anterograde and retrograde axonal transport. Hum Gene Ther. 2014;25:705–720. doi: 10.1089/hum.2013.189. [DOI] [PMC free article] [PubMed] [Google Scholar]
- Chieng B, Azriel Y, Mohammadi S, Christie MJ. Distinct cellular properties of identified dopaminergic and GABAergic neurons in the mouse ventral tegmental area. J Physiol. 2011;589:3775–3787. doi: 10.1113/jphysiol.2011.210807. [DOI] [PMC free article] [PubMed] [Google Scholar]
- Chuhma N, Mingote S, Moore H, Rayport S. Dopamine neurons control striatal cholinergic neurons via regionally heterogeneous dopamine and glutamate signaling. Neuron. 2014;81:901–912. doi: 10.1016/j.neuron.2013.12.027. [DOI] [PMC free article] [PubMed] [Google Scholar]
- Fields HL, Hjelmstad GO, Margolis EB, Nicola SM. Ventral tegmental area neurons in learned appetitive behavior and positive reinforcement. Annu Rev Neurosci. 2007;30:289–316. doi: 10.1146/annurev.neuro.30.051606.094341. [DOI] [PubMed] [Google Scholar]
- Geisler S, Zahm DS. Afferents of the ventral tegmental area in the rat-anatomical substratum for integrative functions. J Comp Neurol. 2005;490:270–294. doi: 10.1002/cne.20668. [DOI] [PubMed] [Google Scholar]
- Gocho Y, Sakai A, Yanagawa Y, Suzuki H, Saitow F. Electrophysiological and pharmacological properties of GABAergic cells in the dorsal raphe nucleus. J Physiol Sci. 2013;63:147–154. doi: 10.1007/s12576-012-0250-7. [DOI] [PMC free article] [PubMed] [Google Scholar]
- Grace AA, Bunney BS. Opposing effects of striatonigral feedback pathways on midbrain dopamine cell activity. Brain Res. 1985;333:271–284. doi: 10.1016/0006-8993(85)91581-1. [DOI] [PubMed] [Google Scholar]
- Hnasko TS, Chuhma N, Zhang H, Goh GY, Sulzer D, Palmiter RD, Rayport S, Edwards RH. Vesicular glutamate transport promotes dopamine storage and glutamate corelease in vivo. Neuron. 2010;65:643–656. doi: 10.1016/j.neuron.2010.02.012. [DOI] [PMC free article] [PubMed] [Google Scholar]
- Hnasko TS, Edwards RH. Neurotransmitter corelease: mechanism and physiological role. Annu Rev Physiol. 2012;74:225–243. doi: 10.1146/annurev-physiol-020911-153315. [DOI] [PMC free article] [PubMed] [Google Scholar]
- Hnasko TS, Hjelmstad GO, Fields HL, Edwards RH. Ventral tegmental area glutamate neurons: electrophysiological properties and projections. J Neurosci. 2012;32:15076–15085. doi: 10.1523/JNEUROSCI.3128-12.2012. [DOI] [PMC free article] [PubMed] [Google Scholar]
- Ikemoto S. Dopamine reward circuitry: two projection systems from the ventral midbrain to the nucleus accumbens-olfactory tubercle complex. Brain Res Rev. 2007;56:27–78. doi: 10.1016/j.brainresrev.2007.05.004. [DOI] [PMC free article] [PubMed] [Google Scholar]
- Kawano M, Kawasaki A, Sakata-Haga H, Fukui Y, Kawano H, Nogami H, Hisano S. Particular subpopulations of midbrain and hypothalamic dopamine neurons express vesicular glutamate transporter 2 in the rat brain. J Comp Neurol. 2006;498:581–592. doi: 10.1002/cne.21054. [DOI] [PubMed] [Google Scholar]
- Kim JI, Ganesan S, Luo SX, Wu YW, Park E, Huang EJ, Chen L, Ding JB. Aldehyde dehydrogenase 1a1 mediates a GABA synthesis pathway in midbrain dopaminergic neurons. Science. 2015;350:102–106. doi: 10.1126/science.aac4690. [DOI] [PMC free article] [PubMed] [Google Scholar]
- Lammel S, Lim BK, Malenka RC. Reward and aversion in a heterogeneous midbrain dopamine system. Neuropharmacology. 2014;76(Pt B):351–359. doi: 10.1016/j.neuropharm.2013.03.019. [DOI] [PMC free article] [PubMed] [Google Scholar]
- Lerner TN, Shilyansky C, Davidson TJ, Evans KE, Beier KT, Zalocusky KA, Crow AK, Malenka RC, Luo L, Tomer R, et al. Intact-Brain Analyses Reveal Distinct Information Carried by SNc Dopamine Subcircuits. Cell. 2015;162:635–647. doi: 10.1016/j.cell.2015.07.014. [DOI] [PMC free article] [PubMed] [Google Scholar]
- Love MI, Huber W, Anders S. Moderated estimation of fold change and dispersion for RNA-seq data with DESeq2. Genome Biol. 2014;15:550. doi: 10.1186/s13059-014-0550-8. [DOI] [PMC free article] [PubMed] [Google Scholar]
- Menegas W, Bergan JF, Ogawa SK, Isogai Y, Umadevi Venkataraju K, Osten P, Uchida N, Watabe-Uchida M. Dopamine neurons projecting to the posterior striatum form an anatomically distinct subclass. Elife. 2015;4 doi: 10.7554/eLife.10032. [DOI] [PMC free article] [PubMed] [Google Scholar]
- Miyamichi K, Shlomai-Fuchs Y, Shu M, Weissbourd BC, Luo L, Mizrahi A. Dissecting local circuits: parvalbumin interneurons underlie broad feedback control of olfactory bulb output. Neuron. 2013;80:1232–1245. doi: 10.1016/j.neuron.2013.08.027. [DOI] [PMC free article] [PubMed] [Google Scholar]
- Nair-Roberts RG, Chatelain-Badie SD, Benson E, White-Cooper H, Bolam JP, Ungless MA. Stereological estimates of dopaminergic, GABAergic and glutamatergic neurons in the ventral tegmental area, substantia nigra and retrorubral field in the rat. Neuroscience. 2008;152:1024–1031. doi: 10.1016/j.neuroscience.2008.01.046. [DOI] [PMC free article] [PubMed] [Google Scholar]
- Ogawa SK, Cohen JY, Hwang D, Uchida N, Watabe-Uchida M. Organization of monosynaptic inputs to the serotonin and dopamine neuromodulatory systems. Cell Rep. 2014;8:1105–1118. doi: 10.1016/j.celrep.2014.06.042. [DOI] [PMC free article] [PubMed] [Google Scholar]
- Osakada F, Callaway EM. Design and generation of recombinant rabies virus vectors. Nat Protoc. 2013;8:1583–1601. doi: 10.1038/nprot.2013.094. [DOI] [PMC free article] [PubMed] [Google Scholar]
- Osakada F, Mori T, Cetin AH, Marshel JH, Virgen B, Callaway EM. New rabies virus variants for monitoring and manipulating activity and gene expression in defined neural circuits. Neuron. 2011;71:617–631. doi: 10.1016/j.neuron.2011.07.005. [DOI] [PMC free article] [PubMed] [Google Scholar]
- Phillipson OT. Afferent projections to the ventral tegmental area of Tsai and interfascicular nucleus: a horseradish peroxidase study in the rat. J Comp Neurol. 1979;187:117–143. doi: 10.1002/cne.901870108. [DOI] [PubMed] [Google Scholar]
- Proulx CD, Hikosaka O, Malinow R. Reward processing by the lateral habenula in normal and depressive behaviors. Nat Neurosci. 2014;17:1146–1152. doi: 10.1038/nn.3779. [DOI] [PMC free article] [PubMed] [Google Scholar]
- Root DH, Mejias-Aponte CA, Zhang S, Wang HL, Hoffman AF, Lupica CR, Morales M. Single rodent mesohabenular axons release glutamate and GABA. Nat Neurosci. 2014;17:1543–1551. doi: 10.1038/nn.3823. [DOI] [PMC free article] [PubMed] [Google Scholar]
- Root DH, Melendez RI, Zaborszky L, Napier TC. The ventral pallidum: Subregion-specific functional anatomy and roles in motivated behaviors. Prog Neurobiol. 2015;130:29–70. doi: 10.1016/j.pneurobio.2015.03.005. [DOI] [PMC free article] [PubMed] [Google Scholar]
- Stuber GD, Hnasko TS, Britt JP, Edwards RH, Bonci A. Dopaminergic terminals in the nucleus accumbens but not the dorsal striatum corelease glutamate. J Neurosci. 2010;30:8229–8233. doi: 10.1523/JNEUROSCI.1754-10.2010. [DOI] [PMC free article] [PubMed] [Google Scholar]
- Swanson LW. The projections of the ventral tegmental area and adjacent regions: a combined fluorescent retrograde tracer and immunofluorescence study in the rat. Brain Res Bull. 1982;9:321–353. doi: 10.1016/0361-9230(82)90145-9. [DOI] [PubMed] [Google Scholar]
- Taylor SR, Badurek S, Dileone RJ, Nashmi R, Minichiello L, Picciotto MR. GABAergic and glutamatergic efferents of the mouse ventral tegmental area. J Comp Neurol. 2014;522:3308–3334. doi: 10.1002/cne.23603. [DOI] [PMC free article] [PubMed] [Google Scholar]
- Tecuapetla F, Patel JC, Xenias H, English D, Tadros I, Shah F, Berlin J, Deisseroth K, Rice ME, Tepper JM, et al. Glutamatergic signaling by mesolimbic dopamine neurons in the nucleus accumbens. J Neurosci. 2010;30:7105–7110. doi: 10.1523/JNEUROSCI.0265-10.2010. [DOI] [PMC free article] [PubMed] [Google Scholar]
- Tritsch NX, Ding JB, Sabatini BL. Dopaminergic neurons inhibit striatal output through non-canonical release of GABA. Nature. 2012;490:262–266. doi: 10.1038/nature11466. [DOI] [PMC free article] [PubMed] [Google Scholar]
- Volman SF, Lammel S, Margolis EB, Kim Y, Richard JM, Roitman MF, Lobo MK. New insights into the specificity and plasticity of reward and aversion encoding in the mesolimbic system. J Neurosci. 2013;33:17569–17576. doi: 10.1523/JNEUROSCI.3250-13.2013. [DOI] [PMC free article] [PubMed] [Google Scholar]
- Wall NR, De La Parra M, Callaway EM, Kreitzer AC. Differential innervation of direct- and indirect-pathway striatal projection neurons. Neuron. 2013;79:347–360. doi: 10.1016/j.neuron.2013.05.014. [DOI] [PMC free article] [PubMed] [Google Scholar]
- Wall NR, Wickersham IR, Cetin A, De La Parra M, Callaway EM. Monosynaptic circuit tracing in vivo through Cre-dependent targeting and complementation of modified rabies virus. Proc Natl Acad Sci U S A. 2010;107:21848–21853. doi: 10.1073/pnas.1011756107. [DOI] [PMC free article] [PubMed] [Google Scholar]
- Wang HL, Morales M. Pedunculopontine and laterodorsal tegmental nuclei contain distinct populations of cholinergic, glutamatergic and GABAergic neurons in the rat. Eur J Neurosci. 2009;29:340–358. doi: 10.1111/j.1460-9568.2008.06576.x. [DOI] [PMC free article] [PubMed] [Google Scholar]
- Watabe-Uchida M, Zhu L, Ogawa SK, Vamanrao A, Uchida N. Whole-brain mapping of direct inputs to midbrain dopamine neurons. Neuron. 2012;74:858–873. doi: 10.1016/j.neuron.2012.03.017. [DOI] [PubMed] [Google Scholar]
- Weissbourd B, Ren J, DeLoach KE, Guenthner CJ, Miyamichi K, Luo L. Presynaptic partners of dorsal raphe serotonergic and GABAergic neurons. Neuron. 2014;83:645–662. doi: 10.1016/j.neuron.2014.06.024. [DOI] [PMC free article] [PubMed] [Google Scholar]
- Wickersham IR, Finke S, Conzelmann KK, Callaway EM. Retrograde neuronal tracing with a deletion-mutant rabies virus. Nat Methods. 2007;4:47–49. doi: 10.1038/NMETH999. [DOI] [PMC free article] [PubMed] [Google Scholar]
- Xia Y, Driscoll JR, Wilbrecht L, Margolis EB, Fields HL, Hjelmstad GO. Nucleus accumbens medium spiny neurons target non-dopaminergic neurons in the ventral tegmental area. J Neurosci. 2011;31:7811–7816. doi: 10.1523/JNEUROSCI.1504-11.2011. [DOI] [PMC free article] [PubMed] [Google Scholar]
- Yamaguchi T, Wang HL, Li X, Ng TH, Morales M. Mesocorticolimbic glutamatergic pathway. J Neurosci. 2011;31:8476–8490. doi: 10.1523/JNEUROSCI.1598-11.2011. [DOI] [PMC free article] [PubMed] [Google Scholar]
Associated Data
This section collects any data citations, data availability statements, or supplementary materials included in this article.