Abstract
The Purkinje network is an integral part of the excitation system in the human heart. Yet, to date, there is no in vivo imaging technique to accurately reconstruct its geometry and structure. Computational modeling of the Purkinje network is increasingly recognized as an alternative strategy to visualize, simulate, and understand the role of the Purkinje system. However, most computational models either have to be generated manually, or fail to smoothly cover the irregular surfaces inside the left and right ventricles. Here we present a new algorithm to reliably create robust Purkinje networks within the human heart. We made the source code of this algorithm freely available online. Using Monte Carlo simulations, we demonstrate that the fractal tree algorithm with our new projection method generates denser and more compact Purkinje networks than previous approaches on irregular surfaces. Under similar conditions, our algorithm generates a network with 1219 ± 61 branches, three times more than a conventional algorithm with 419 ± 107 branches. With a coverage of 11 ± 3 mm, the surface density of our new Purkije network is twice as dense as the conventional network with 22 ± 7 mm. To demonstrate the importance of a dense Purkinje network in cardiac electrophysiology, we simulated three cases of excitation: with our new Purkinje network, with left-sided Purkinje network, and without Purkinje network. Simulations with our new Purkinje network predicted more realistic activation sequences and activation times than simulations without. Six-lead electrocardiograms of the three case studies agreed with the clinical electrocardiograms under physiological conditions, under pathological conditions of right bundle branch block, and under pathological conditions of trifascicular block. Taken together, our results underpin the importance of the Purkinje network in realistic human heart simulations. Human heart modeling has the potential to support the design of personalized strategies for single- or bi-ventricular pacing, radiofrequency ablation, and cardiac defibrillation with the common goal to restore a normal heart rhythm.
Keywords: Cardiac modeling, finite element method, excitation, electrophysiology, Purkinje network, bundle branch block
1. Introduction
In the United States alone, almost half a million people die each year as a result of heart rhythm disorders (American Heart Association, 2015). Abnormal heart rhythms are a consequence of uncoordinated electrical excitation and disturbed electrical conduction, which may critically reduce mechanical function (Mann et al., 2015). One of the key components of the cardiac excitation system is the Purkinje network. Composed of specialized fast-conducting cells, the Purkinje network is located in the subendocardium, right beneath the inner wall of the heart. Purkinje cells are larger than cardiomyocytes, with fewer myofibrils and more of mitochondria, to conduct the excitation wave efficiently and more rapidly than any other cell in the heart. A functional Purkinje network is essential to create synchronized contractions of the left and right ventricles and maintain a consistent cardiac rhythm (Dubin, 1996).
The electric activation of our heart originates in the sinoatrial node located in the right atrium. From here, it spreads through the atria and reaches the atrioventricular node, the only electric connection between the atria and the ventricles. The bundle of His connects the atrioventricular node to the Purkinje network, which branches from the basal septum into the left and right ventricles. Purkinje fibers were first observed more than a century ago (Tawara, 1906); yet, to date, there is no in vivo imaging technique to fully reconstruct their geometry (Çetingül et al., 2011). This limitation has given rise to various methods to create model systems of the Purkinje network, both for visualization purposes and computational simulations.
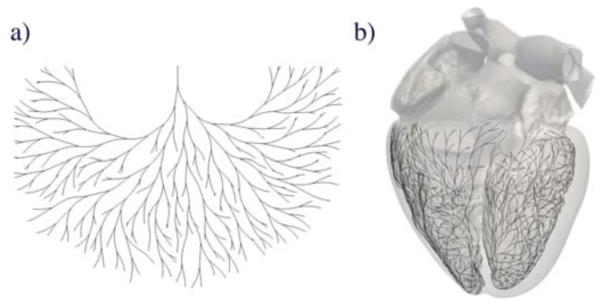
The inherent complexity of the Purkinje network makes its manual generation complicated and time consuming (Krishnamoorthi et al., 2014). Recently, algorithms based on fractal trees (Lindenmayer, 1968) have emerged has a tool for automatic network generation. Figure 1 illustrates a two-dimensional fractal network and its projection onto the irregular endocardial surfaces of the left and right ventricles. The first attempt to create Purkinje network models using fractal trees was motivated by studying high-frequency electrocardiograms (Abboud et al., 1991). The underlying network consisted of straight segments, which were placed in a simplified representation of the ventricles. Recent models introduced non-straight branches with controllable curvature (Ijiri et al., 2008), and generated hierarchical networks with sub-sequentially smaller fibers (Sebastian et al., 2011, 2013). Alternatively, other classes of models focused on creating patient specific Purkinje networks (Vergara et al., 2014) by optimizing the resulting activation times (Palamara et al., 2014). However, all these approaches represent the ventricles as regular, smooth surfaces, and ignore non-smooth but important substructures such as the papillary muscles.
Figure 1.
Generation of the Purkinje network in the human heart. (a) Two-dimensional fractal network; (b) Three-dimensional fractal network projected onto the irregular, non-smooth endocardial surfaces of the left and right ventricles of the human heart.
The papillary muscles are often completely covered by the Purkinje network (Veenstra et al., 1984), and a dysfunctional Purkinje-fiber-papillary-muscle interaction can become the origin of severe arrhythmias and ventricular fibrillation (Li et al., 1992; Pak et al., 2006). In addition to their electrical importance, the papillary muscles also play a crucial mechanical role in activating the mitral and tricuspid valves at precisely the right point within the cardiac cycle. Including the papillary muscles is therefore especially relevant when modeling the behavior of the whole heart (Baillargeon et al., 2014). To work around the difficulty of covering the irregular papillary muscle surface of a rabbit heart with a Purkinje network, a recent study suggests to subdivide each network branch into several small segments (Bordas et al., 2011). Motivated by this idea, we propose a novel fractal tree algorithm for the automatic generation of Purkinje networks in the human heart. This method provides controllable curvature of the branches and is suitable for both regular and irregular surfaces independent of segment length. More importantly, it is able simulate the essential features of cardiac excitation under physiological and pathological conditions.
2. Methods
In this section, we briefly describe the generic algorithms to create a two-dimensional fractal network in Section 2.1 and to project a three-dimensional fractal network onto a non-smooth surface in Section 2.2. We then illustrate how to use these algorithms to generate a Purkinje network on the endocardial surfaces of the left and right ventricles in Section 2.3 and summarize the Monte Carlo method for sensitivity analyses with respect to the fractal network parameters in Section 2.4. Finally, we summarize the finite element method used to simulate realistic excitation sequences in Section 2.5, introduce the Living Heart model as the basis for our human heart model in Section 2.6, and show how to extract electrocardiograms for model calibration and model validation in Section 2.7. The source code of our algorithm for generating three-dimensional fractal trees on given triangulated surfaces is freely available online at https://simtk.org/home/fractal-tree and https://github.com/fsahli/fractal-tree.
2.1. Two-dimensional fractal network
To create a two-dimensional fractal network, we selected the initial node of the network and defined the direction in which the initial branch will grow (Ijiri et al., 2008). From the end terminal of the initial branch, we created two new branches and iteratively continued this process (Lindenmayer, 1968) as described in Algorithm 1.
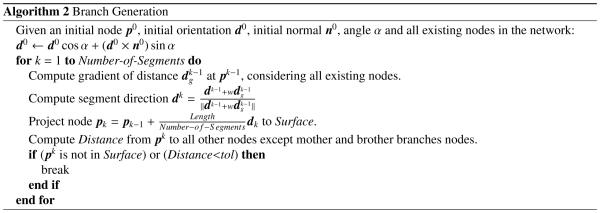
Figure 2 illustrates the iterative generation of the two-dimensional fractal network. Branches are represented as polylines of n segments and n+1 nodes that repel each other to generate curved lines. This is accomplished by determining the direction of each segment in the branch with respect to the direction of the previous segment and by the gradient of the distance of all existing nodes.
Figure 2.
Generation of two-dimensional fractal network. The initial branch divides into two new branches. Each branch further divides into segments. The direction of each segment is determined by the direction of the previous segment and by the gradient of the distance of all previous nodes.
The algorithm uses three kinematic parameters to determine the shape of the network: the branch length, the branch angle, and the repulsion parameter. The repulsion parameter regulates the branch curvature: the larger the repulsion parameter, the more the branches repel each other. The gradient of the distance is computed with a central finite difference approximation,
| (1) |
where ε was set to 0.01 mm and ei represent the Cartesian basis vectors. The function distCP(·) returns the distance from any point to the closest node in the network using a k-d tree. K-d trees are binary structures constructed by recursively splitting the space of points with planes. We used the same strategy to determine collision between two nodes. To detect potential collision, we considered all nodes in the network, except the ones in the mother and brother branches. If the distance between a new node and any existing node is less than a tolerance, the branch can no longer grow and the new node is removed. If desired, we could create a closed loop by adding the closest node in the network as the last node in the branch. Our network algorithm contains three sources of randomness: First, we calculate the length of each branch from a random normal distribution with mean l and variance 0.4 l2. Second, we shuffle the order of growing branches in each generation to randomly distribute the influence of curvature with respect to existing nodes. Last, we shuffle the order in which we grow child branches. Figure 1 illustrates a typical two-dimensional fractal network generated by using this algorithm.
2.2. Three-dimensional fractal network on non-smooth surface
To create a three-dimensional fractal networks on a non-smooth surface, we used the two-dimensional network algorithm from Section 2.1 as a basis. However, we now grew the network directly on a non-smooth surface by immediately projecting every newly created node back onto the surface. We implemented two projection techniques, the original one-step projection and a new two-step projection as described in Algorithm 2, which we made freely available online at https://simtk.org/home/fractal-tree and https://github.com/fsahli/fractal-tree.
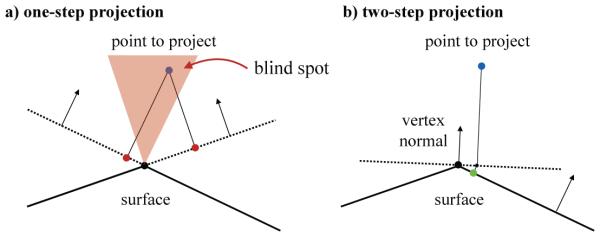
Figure 3 illustrates the original one-step projection method and the proposed two-step projection method that projects newly generated nodes onto the surface. The original one-step projection uses the normal of the triangular element to project the node onto the plane defined by each triangle (Ijiri et al., 2008). Then, the method checks if the node is inside a triangle. While this method works well when applied to regular, smooth surfaces, it fails when the surface is irregular and non-smooth. When sharp angles are present in the surface, the one-step projection method has blind spots where it senses that the new node lies outside the region of interest. This failure to project the new node stops the growth process of the branch. To fix this issue, we added a pre-projection of the node using a vertex normal. This vertex normal is defined as the weighted sum of all normals of neighboring triangles. Then, we projected the pre-projected node onto the surface using the projection method from the initial algorithm and verified that the node lies inside a triangular element. An additional complexity of the three-dimensional algorithm is the calculation of the gradient of the distance. Instead of using the geodesic distance between nodes, which is very expensive to compute, we used the Euclidean distance. Then, we projected the resulting gradient onto the surface using the triangular normal associated with the node of interest.
Figure 3.
Generation of a three-dimensional fractal network on a non-smooth surface. Projection of newly created nodes onto the surface. a) One-step projection, showing a case where the projection fails. b) Two-step projection of the same case. The node is first projected onto a plane defined by the vertex normal and then projected onto the surface.
2.3. Purkinje network on endocardial surface
To generate a realistic Purkinje network, we used a detailed triangular surface mesh of the left and right ventricles of a human heart (Baillargeon et al., 2014).
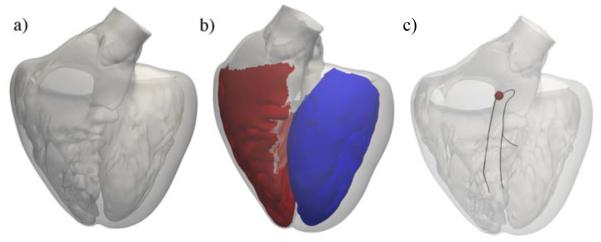
Figure 4 illustrates the geometry with the papillary muscles, which create an irregular, non-smooth endocardial surface. To limit the region were the Purkinje network can grow, we extracted the left and right endocardial surface regions. We explicitly excluded the septum from the right endocardial surface because the right bundle branch is not branched until it reaches the right ventricular apex (Waller et al., 1993). This anatomical observation is further supported by the fact that septal depolarization happens from left to right (Dubin, 1996; Durrer et al., 1970). We defined a right bundle branch, a left anterior fascicle, and a left posterior fascicle (Keller et al., 2009; Dux-Santoy et al., 2013). The end nodes of these three structures mark the initial nodes to grow the Purkinje network.
Figure 4.
Generation of a Purkinje network on the endocardial surface of a human heart. (a) Surface mesh of the left and right ventricles including the papillary muscles; (b) Surface regions to grow the Purkinje network in the left ventricle (blue) and right ventricle (red); (c) Initial branches of the right bundle branch, the left anterior fascicle, and the left posterior fascicle; the activation point is marked in red.
2.4. Monte Carlo method
To asses the influence of the algorithmic parameters on the network generation, we performed Monte Carlo simulations. First, we compared the one-step projection method against the two-step projection method. We used the left ventricular surface to generate a network with a branch length l = 8 mm, a branch angle α = 0.15 rad, and a repulsion parameter w = 0.1. We generated 1,000 Purkinje networks for each method and computed the number of branches and the maximum distance from a node on the surface to a node within the network. The latter is an indicator of how well the network covers the surface: the larger this distance, the bigger the area that is not covered by fibers. We also performed a sensitivity analysis of the three geometrical parameters of the network, the branch length, the branch angle, and the repulsion parameter. We used a branch length of l = 8 mm, an branch angle of α = 0.15, and a repulsion parameter of w = 0.1 as base values and varied each parameter individually while keeping the other two fixed. We created 500 networks for each parameter combination and averaged the results.
2.5. Finite element method
To test whether our Purkinje network is capable of generating physiological excitation sequences in a human heart, we performed finite element simulations of cardiac excitation using a bidomain model (Dal et al., 2012). The finite-element model considered a linear tetrahedral spatial discretization and implicit time integration, for which adequate time-step size was selected to guarantee convergence of the numerical scheme (Hurtado and Henao, 2014). In this model, the transmembrane potential of individual cardiomyocytes, φ = φi − φe, is represented as the difference of the intracellular potential φi and the extracellular potential φe. The bidomain model is parameterized in terms of two fields of global unknowns, the transmembrane potential φ and the extracellular potential φe,
| (2) |
where Di and D are normalized conductances and f φ(φ, r) characterizes the local action potential profile (Dal et al., 2013). Here we select an Aliev-Panfilov model,
| (3) |
in terms of a cubic polynominal, c1φ(φ − α)(1 − φ), where c1 is a scaling parameter and α is the oscillation threshold (Aliev and Panfilov, 1996). The coupling term, c2φ r, introduces another scaling parameter c2 and the scalar-valued recovery variable r, which is governed by a local evolution equation (Göktepe and Kuhl, 2009; Hurtado et al., 2015),
| (4) |
Here, is a weighting factor with and b is an additional parameter that modifies the action potential duration. Before implementing the resulting weak form of the governing equations into the nonlinear finite element platform Abaqus/Standard (Abaqus 6.14, 2014), we mapped the resulting fields into the physiological domain via Φ = 100φ − 80 mV and τ = 12.9t ms, to create transmembrane potentials Φ that range from −80 mV to +20 mV and span a physiological time τ of 200-300 ms (Kotikanyadanam et al., 2010).
By computing the action potential duration for several values of b, we obtained an empirical relation, b = 114.14 APD−1.057. We used this relation to assign different values of b to different regions across the heart according to their local activation times (Hurtado and Kuhl, 2014). Specifically, we used the following relationship, APD= 500 − 3 AT ms, where APD denotes the action potential duration and AT is the activation time. This heterogeneous assignment of the action potential duration generates a repolarization wave that travels exactly in the opposite direction of the depolarization wave.
Table 1 specifies the local parameters of the Aliev-Panfilov model. For the global parameters of the myocardial tissue, we introduced conductivity tensors of transversely isotropic form,
Table 1.
Parameters of the Aliev-Panfilov model.
| a | c 1 | c 2 | μ 1 | μ 2 | γ |
|---|---|---|---|---|---|
| 0.05 | 52 | 8 | 0.1 | 0.3 | 0.002 |
| (5) |
Table 2 summarizes the intra- and extra-cellular conductivities in fiber direction, and , and in cross-fiber direction, and , adopted from the literature (Niederer et al., 2011). The fiber orientation f of each element was interpolated from generic fiber orientation illustrations (Baillargeon et al., 2014). We amplified the properties in Table 2 by 27.5 times for the Purkinje network to approximately match its condition velocity of 2 m/s.
Table 2.
Conductivity parameters (mm2/ms) of the bidomain model.
| 0.121 | 0.013 | 0.442 | 0.171 |
We simulated three cases: the physiological healthy excitation with intact Purkinje network; the pathological excitation with Purkinje network and right bundle branch block; and the pathological excitation without Purkinje network. For the case of right bundle branch block, we decreased the conduction velocity of the right bundle branch to the value of the surrounding ventricular tissue. For the healthy and right bundle branch block cases, we excited the Purkinje network at the atrioventricular node. For the case of no Purkinje network, we excited the ventricular tissue directly at the atrioventricular node. The initial values of the transmembrane potential were set to −80 mV for all nodes and the extracellular potential of the first node of the mesh was set to 0 mV as a reference potential. We used zero-flux boundary conditions for the outer surface.
2.6. Living Heart model
For the finite element simulation, we used the left and right ventricles of the Living Heart model (Baillargeon et al., 2014) created from magnetic resonance images of a healthy, 21-year old, 50th percentile U.S. male (Zygote Media Group, 2014). The discretization of the ventricles consists of 384,371 linear tetrahedral elements and 82,594 nodes. To create the Purkinje network, we used the two-step projection algorithm with a branch length of 8 mm, a branch angle of 0.15 rad, and a repulsion parameter of 0.1. Networks generated by the one-step projection method were not considered at this stage given the poor coverage of the ventricular surface and the inaccurate electrocardiograms extracted from the excitation sequences.
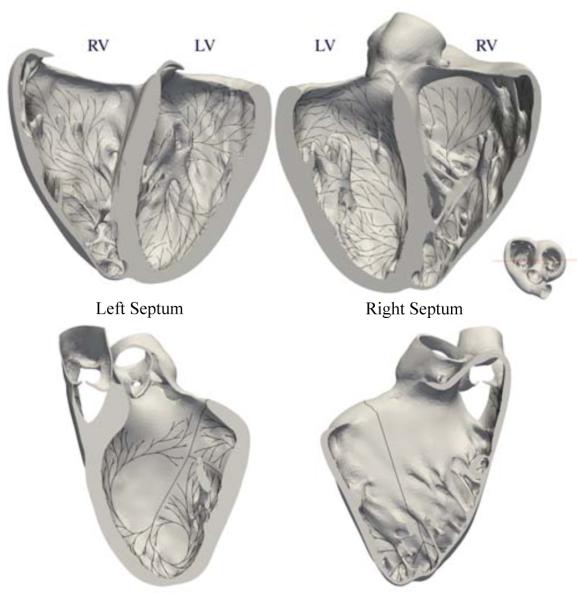
Figure 5 illustrates the resulting Purkinje network, which consists of 1,868 branches and 1,046 terminals. In the finite element model, the network is represented by 10,757 line elements and 10,758 nodes. Only the 1,046 terminals of the Purkinje network are connected to the endocardial surface using multi-point constraints (Abaqus 6.14, 2014).
Figure 5.
Purkinje network to calculate realistic excitation sequences. The network consists of 1,868 branches and 1,046 terminals, represented by 10,757 line elements and 10,758 nodes. Only the 1,046 terminals are connected to the endocardial surface using multi-point constraints.
2.7. Electrocardiograms
To assess the macroscopic bioelectrical response of the ventricles, we extracted electrocardiograms from the simulated excitation sequences. We determined the electrode position on the left arm, right arm, and left leg from magnetic resonance images. We then computed the temporal evolution of the electrical potential φa at all three electrodes a = 1, 2, 3 (Plonsey and Barr, 2007),
| (6) |
where dtorso is the conductivity of the torso, Di is the intracellular conductivity, and xa is the electrode position. Similar to the clinical electrocardiogram, we applied a moving average filter using a width of 1.5 ms. From the resulting electrical potentials at the three electrode positions, we created a six-lead electrocardiogram, in which lead I measures the potential difference between the right and left arm, lead II between the right and and the left leg, lead III between the left arm and the left leg. The augmented limb lead aVR is related to the right arm, aVL is related to the left arm, and aVL is related to the left leg (Dubin, 1996).
3. Results
3.1. Monte Carlo simulations
The results of the Monte Carlo simulations are summarized in Table 3 and Figures 6, 7, and 8.
Table 3.
Monte Carlo simulations. Comparison of one-step and two-step projection methods by means of the number of branches and the maximum distance of non-coverage.
| Method | Number of Branches (−) |
Max. Distance (mm) |
|---|---|---|
|
| ||
| One-step Projection | 419.3 ± 107.3 | 22.4 ± 6.7 |
| Two-step Projection | 1219.8 ± 61.1 | 11.4 ± 2.6 |
Figure 6.
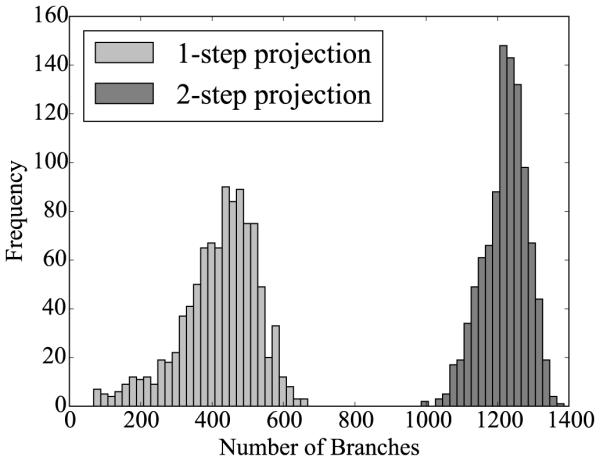
Histograms of Monte Carlo simulations for the one-step and two-step projection methods. The number of branches is plotted for sets of 1,000 randomly generated networks. The number of branches is larger and the dispersion is smaller for the two-step projection method.
Figure 7.
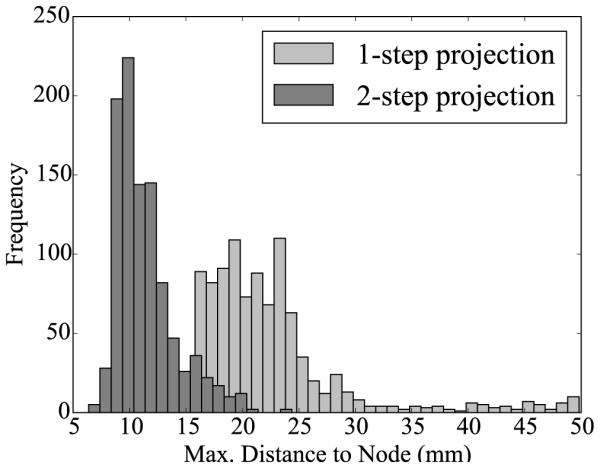
Histograms of Monte Carlo simulations for the one-step and two-step projection methods. The maximum distance from a node in the mesh to a node on the surface is plotted for sets of 1,000 randomly generated networks. The maximum distance is smaller for the two-step projection method, implying that the surface area is better covered by fibers by the two-step projection method.
Figure 8.
Monte Carlo simulations for sensitivity analyses with respect to branch length, the branch angle, and the repulsion parameter. The number of branches tends to decrease when increasing the branch length, the branch angle and the repulsion parameter. Error bars represent ± standard deviations.
Table 3 and Figures 6 and 7 show the comparison between the original one-step and the new two-step projection method. With 1219.8 ± 61.1, the two-step method generates on average three times as many branches as the one-step method with 419.3 ± 107.3. With 11.4 ± 2.6 mm, the maximum distance of non-coverage of the two-step method is on average of half the distance of the one-step method with 22.4 ± 6.7 mm. This implies that the network generated by the two-step method can cover certain regions that are invisible to the original one-step method. The two-step dispersion is lower for both the number of branches and the maximum distance, suggesting that the new two-step method is more consistent than the original one-step method.
Figure 8 illustrates the sensitivity of the two-step projection method with respect to the branch length, the branch angle, and the repulsion parameter. Increasing the branch length decreases the number of branches in a hyperbolic fashion. This could be expected: the larger the branches, the less branches fit in a given space. Increasing the branch angle and the repulsion parameter produce a similar effect on the network: decreasing the overall number of branches. When branch angle or repulsion parameter are large, branches tend to use more space in between them, which reduces the total number of branches.
3.2. Finite element simulation
The results of the finite element simulations are summarized in Figures 9 and 10.
Figure 9.
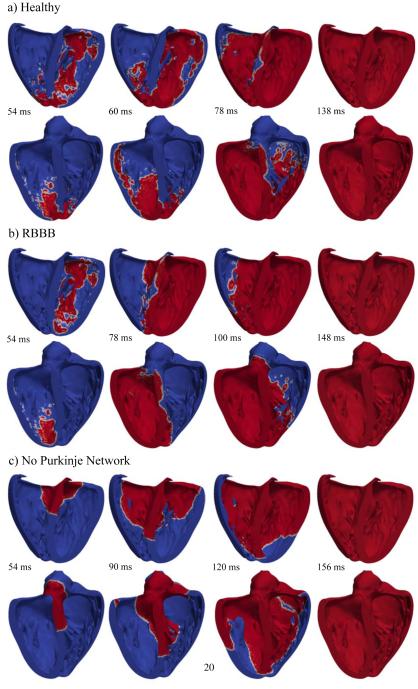
Activation sequences of the left and right ventricles. (a) Simulation with Purkinje network under physiological healthy conditions; (b) Simulation with Purkinjenetwork under pathological conditions of right bundle branch block; (c) Simulation without Purkinjenetwork. The color code indicates the transmembrane potential φ; red corresponds to the excited state of φ= +20 mV and blue to the relaxed state of φ= −80 mV.
Figure 10.
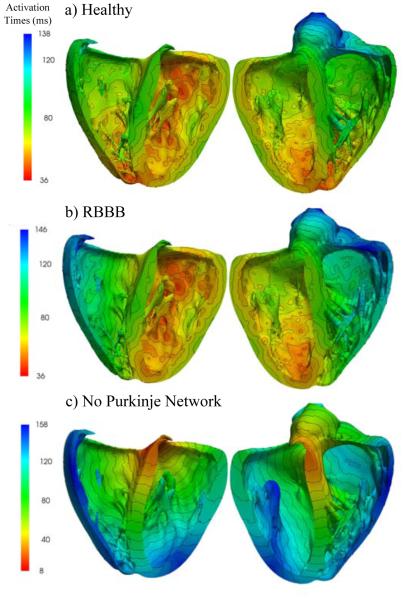
Activation times of the left and right ventricles. (a) Simulation with Purkinje network under physiological healthy conditions; (b) Simulation with Purkinjenetwork under pathological conditions of right bundle branch block; (c) Simulation without Purkinjenetwork. The color code indicates the activation times t;red corresponds to early activation and blue to late activation.
Figure 9 compares the activation sequences of the simulations with Purkinje network under physiological healthy conditions, with Purkinje network under pathological conditions of right bundle branch block, and without Purkinje network. Red colors indicate the excited state of φ = +20 mV and blue colors the relaxed state of φ = −80 mV. Under physiological healthy conditions, the activation sequence shows a non-smooth propagating wavefront, which rapidly excites the left and right ventricles from apex to base. Under pathological conditions of right bundle branch block, the left ventricle is activated similarly to the healthy, physiological case, whereas the right ventricle is activated via slow, smooth diffusion of the excitation front from the septum to the lateral wall. Without Purkinje network, both left and right ventricles are activated via slow, smooth diffusion of the electric potential starting at the atrioventricular node and progressing from base to apex.
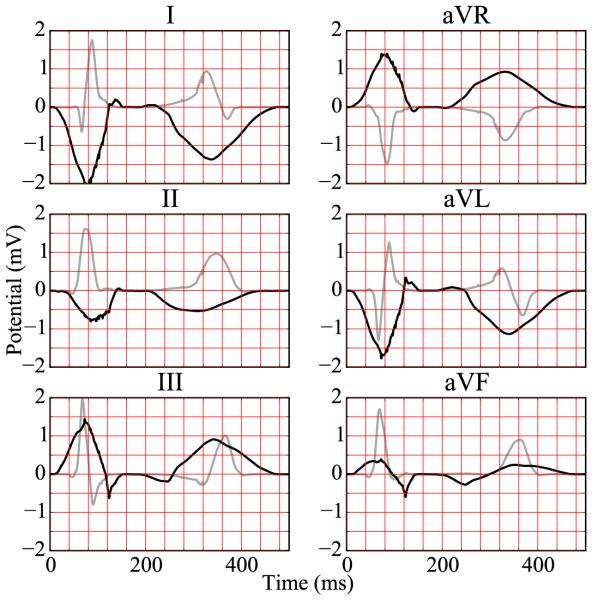
Figure 10 illustrates the activation times of the simulations with Purkinje network under physiological healthy conditions, with Purkinje network under pathological conditions of right bundle branch block, and without the Purkinje network. Red colors indicate the early activation and blue late activation. Under physiological healthy conditions, the heart is activated via the three conductions systems of the right bundle branch, the left anterior fascicle, and the left posterior fascicle. The simulated activation times and regions are in agreement with the activation times reported in the literature (Durrer et al., 1970). Similar to what has been measured, the first zones to activate in the simulation are the regions close to the apex in the left and right ventricles and the postero-basal region of the left ventricle. Also, septal depolarization occurs from the left to the right surface. Both ventricles are excited rapidly within a activation time of 138 ms. Under the pathological conditions of right bundle branch block, the left ventricle is activated first. The right ventricle follows slowly after through smooth wave propagation from the septum towards the lateral wall as indicated through the parallel isolines of activation times. The activation of both ventricles takes a total of 146 ms, and is slightly slower than in the physiological healthy case. Without Purkinje network, both left and right ventricles are activated through a smoothly propagating wave that starts at the atrioventricular node and slowly propagates outwards. Cell-to-cell diffusion is the only mechanism of signal propagation. This creates unphysiological excitation patterns characterized through a system of parallel isolines of activation times. These activation sequences closely mimic the pathological condition of trifascicular block, the simultaneous blockage of the right bundle branch, the left anterior fascicle, and the left posterior fascicle (Dubin, 1996). With trifascicular block, the overall activation takes a total of 158 ms and is markedly slower than with a fully functional fast Purkinje network.
3.3. Electrocardiograms
The electrocardiograms associated with the physiological excitation sequence, the pathological excitation sequence, and the case without Purkinje network are summarized in Figures 11, 12, and 13.
Figure 11.
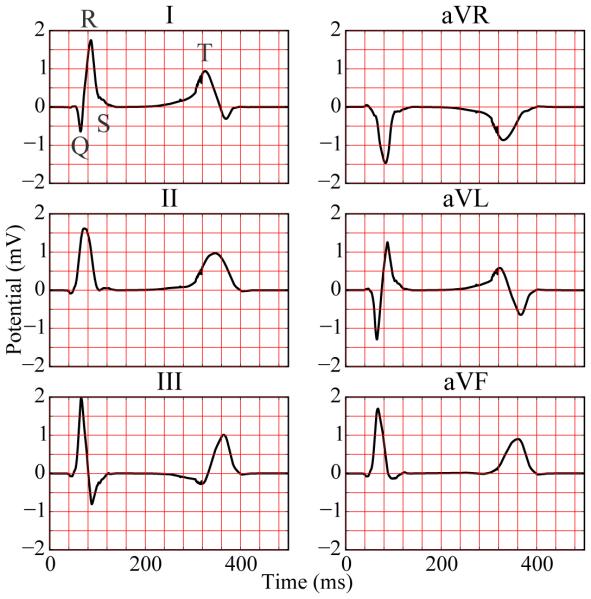
Six-lead electrocardiogram extracted from excitation sequence with Purkinje network simulating physiological conditions of healthy excitation.
Figure 12.
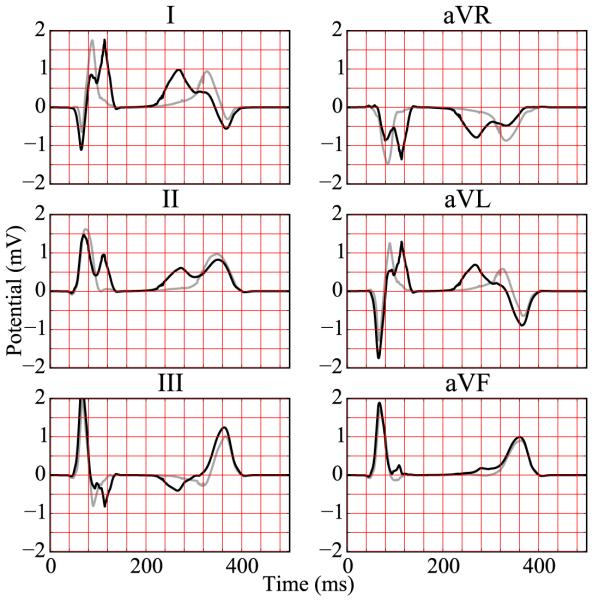
Six-lead electrocardiogram extracted from excitation sequence with Purkinje network simulating pathological conditions of right bundle branch block. The electrocardiogram for healthy excitation is represented in light gray for comparison.
Figure 13.
Six-lead electrocardiogram extracted from excitation sequence without Purkinje network simulating pathological conditions of trifascicular block. The electrocardiogram for healthy excitation is represented in light gray for comparison.
Under physiological healthy conditions, the computed electrocardiogram in Figure 11 nicely captures the QRS complex and the T wave. The durations of the QRS complex of 80 ms, the QT interval of 360 ms, and the T wave of 200 ms represent realistic values for a healthy human excitation pattern (Dubin, 1996). The model accurately captures the characteristic profile and polarity of the T wave through regionally varying action potential durations (Hurtado and Kuhl, 2014; Perotti et al., 2015). Under the pathological conditions of right bundle branch block, the computed electrocardiogram in Figure 12 displays a widened QRS complex, which adopts an R,R’ configuration or M shape. This characteristic double-peak configuration is caused by the delayed depolarization of the right ventricle (Dubin, 1996). The excitation wave travels to the right ventricle mainly by diffusion from the left ventricle. A few fibers that activate the tissue locally initiate a superposed non-smooth activation pattern, as illustrated at time=100 ms in Figure 9. Without Purkinje network, the computed electrocardiogram in Figure 13 fails to capture the characteristic QRS complex. In the absence of the fast conducting Purkinje network, the tissue is activated via slow, smooth excitation fronts, which widens the activation pattern beyond the healthy limit.
4. Discussion
The Purkinje network is a crucial component in the electrical excitation of the human heart. It controls the activation sequences of the ventricles, the papillary muscles, and the mitral and tricuspid valves. Its dysfunction is associated with diseases such as arrhythmias and with sudden cardiac death (Mann et al., 2015). Yet, because of the inherent difficulty of imaging Purkinje networks in vivo, their inclusion in electrophysiological models remains challenging (Krishnamoorthi et al., 2014). Here we proposed an algorithm to incorporate the Purkinje network in the left and right ventricles of a human heart model (Baillargeon et al., 2014). Our algorithm can efficiently handle complex geometries using advanced computational tools including k-d trees.
We demonstrated the importance of Purkinje networks by computing electrocardiograms that agree well with healthy human recordings (Hurtado and Kuhl, 2014). Our simulated durations of the QRS complex, the QT interval, and the T wave are in excellent agreement with healthy human excitation patterns. A limitation of our study is that we only simulated six-lead electrocardiograms. Including the chest leads can be accomplished by embedding the ventricles in a torso model. The reading from these leads could provide additional information, particularly for the diseased states. Another limitation is that we have not yet included the atria. However, the conceptual flexibility of our method would allow us to generate an atrial conduction system and simulate excitation patterns of the whole heart. The electrocardiogram would then be completed by the P-wave, which would allow us to simulate pathologies of atrial enlargement, atrioventricular block, and pericarditis. In this study, we have already shown that a loss of the ventricular condition system, either partially in right bundle branch block or completely in trifascicular block, causes a delayed depolarization either of the right ventricle or of both ventricles. Right bundle branch block manifests itself in a double-peak R,R’ configuration in the electrocardiogram (Dubin, 1996), which our model predicts both qualitatively and quantitatively.
Our representations of the Purkinje network are in good agreement with two-dimensional images of Purkinje networks (Ijiri et al., 2008). As three-dimensional data become available, we will compare our network to medical images of real networks. This will help us to calibrate the geometric parameters in our algorithm to create physiologically realistic Purkinje network models (Palamara et al., 2014). Ultimately, we would like to move to the coupled electromechanics problem (Göktepe and Kuhl, 2010; Berberoglu et al., 2014) and explore the influence of the Purkinje network on non-electrical metrics, such as local tissue strain distributions and global pressure-volume loops (Genet et al., 2015). These insights will help the research community elucidate the interplay between electrical conduction disturbances and the loss of mechanical function.
Acknowledgments
This model was developed within the Living Heart project, and we acknowledge the technical support Brian Baillargeon at Dassault Systèmes Simulia Corporation. This study was supported by the Stanford School of Engineering Fellowship and Becas Chile-Fulbright Fellowship to Francisco Sahli Costabal, by Conicyt Chile thorugh Fondecyt Grant 11121224 to Daniel Hurtado, and by the National Institutes of Health Grant U54GM072970 to Ellen Kuhl.
Footnotes
Publisher's Disclaimer: This is a PDF file of an unedited manuscript that has been accepted for publication. As a service to our customers we are providing this early version of the manuscript. The manuscript will undergo copyediting, typesetting, and review of the resulting proof before it is published in its final citable form. Please note that during the production process errors may be discovered which could affect the content, and all legal disclaimers that apply to the journal pertain.
URL: http://biomechanics.stanford.edu (Ellen Kuhl)
Conflict of interest statement
None.
References
- Abaqus 6.14 . Abaqus Analysis User’s Guide. Dassault Systèmes; SIMULIA: 2014. [Google Scholar]
- Abboud S, Berenfeld O, Sadeh D. Simulation of high-resolution qrs complex using a ventricular model with a fractal conduction system. effects of ischemia on high-frequency qrs potentials. Circ. Res. 1991;68(6):1751–1760. doi: 10.1161/01.res.68.6.1751. [DOI] [PubMed] [Google Scholar]
- Aliev RR, Panfilov AV. A simple two-variable model of cardiac excitation. Chaos, Solitons and Fractals. 1996;7(3):293–301. [Google Scholar]
- American Heart Association . Heart Disease and Stroke Statistics - 2015 Update. American Heart Association; Dallas, Texas: 2015. [Google Scholar]
- Baillargeon B, Rebelo N, Fox D, Taylor R,E,K. The living heart project: A robust and integrative simulator for human heart function. Eur. J. Mech. A/Solids. 2014;48:38–47. doi: 10.1016/j.euromechsol.2014.04.001. [DOI] [PMC free article] [PubMed] [Google Scholar]
- Berberoglu E, Solmaz HO, Göktepe S. Computational modeling of coupled cardiac electromechanics incorporating cardiac dysfunctions. Eur. J. Mech. A/Solids. 2014;48:60–73. [Google Scholar]
- Bordas R, Gillow K, Lou Q, Efimov IR, Gavaghan D, Kohl P, Grau V, Rodriguez B. Rabbit-specific ventricular model of cardiac electrophysiological function including specialized conduction system. Progr. Biophys. Mol. Bio. 2011;107(1):90–100. doi: 10.1016/j.pbiomolbio.2011.05.002. [DOI] [PMC free article] [PubMed] [Google Scholar]
- Çetingül HE, Plank G, Trayanova N, Vidal R. Estimation of local orientations in fibrous structures with applications to the Purkinje system. IEEE Transactions on Biomedical Engineering. 2011;58(6):1762–1772. doi: 10.1109/TBME.2011.2116119. [DOI] [PMC free article] [PubMed] [Google Scholar]
- Dal H, Göktepe S, Kaliske M, Kuhl E. A fully implicit finite element method for bidomain models of cardiac electrophysiology. Comp. Meth. Biomech. Biomed. Eng. 2012;15(6):645–656. doi: 10.1080/10255842.2011.554410. [DOI] [PubMed] [Google Scholar]
- Dal H, Göktepe S, Kaliske M, Kuhl E. A fully implicit finite element method for bidomain models of cardiac electromechanics. Comp. Meth. Appl. Mech. Eng. 2013;253:323–336. doi: 10.1016/j.cma.2012.07.004. [DOI] [PMC free article] [PubMed] [Google Scholar]
- Dubin D. Rapid Interpretation of EKG’s. Cover Publishing Company; 1996. 1996. [Google Scholar]
- Durrer D, van Dam RT, Freud GE, Janse MJ, Meijler FL, Arzbaecher RC. Total excitation of the isolated human heart. Circulation. 1970;41(6):899–912. doi: 10.1161/01.cir.41.6.899. [DOI] [PubMed] [Google Scholar]
- Dux-Santoy L, Sebastian R, Rodriguez JF, Ferrero JM. Modeling the different sections of the cardiac conduction system to obtain realistic electrocardiograms. Conf. Proc. IEEE Eng. Med. Biol. Soc. 20132013:6846–6849. doi: 10.1109/EMBC.2013.6611130. [DOI] [PubMed] [Google Scholar]
- Genet M, Lee LC, Baillargeon B, Guccione JM, Kuhl E. Modeling pathologies of systolic and diastolic heart failure. Ann. Biomed. Eng. 2015 doi: 10.1007/s10439-015-1351-2. doi: 10.1007/s10439–015–1351–2. [DOI] [PMC free article] [PubMed] [Google Scholar]
- Göktepe S, Kuhl E. Computational modeling of cardiac electrophysiology: A novel finite element approach. Int. J. Num. Meth. Eng. 2009;79(2):156–178. [Google Scholar]
- Göktepe S, Kuhl E. Electromechanics of the heart: A unified approach to the strongly coupled excitation-contraction problem. Computational Mechanics. 2010;45:227–243. [Google Scholar]
- Hurtado D, Kuhl E. Computational modelling of electrocardiograms: Repolarisation and t-wave polarity in the human heart. Comp. Meth. Biomech. Biomed. Eng. 2014;17(9):986–996. doi: 10.1080/10255842.2012.729582. [DOI] [PMC free article] [PubMed] [Google Scholar]
- Hurtado DE, Castro S, Gizzi A. Computational modeling of non-linear diffusion in cardiac electrophysiology: A novel porous-medium approach. Comp. Meth. Appl. Mech. Eng. 2015 accepted for publication. [Google Scholar]
- Hurtado DE, Henao D. Gradient flows and variational principles for cardiac electrophysiology: toward efficient and robust numerical simulations of the electrical activity of the heart. Comp. Meth. Appl. Mech. Eng. 2014;273:238–254. [Google Scholar]
- Ijiri T, Ashihara T, Yamaguchi T, Takayama K, Igarashi T, Shimada T, Namba T, Haraguchi R, Nakazawa K. A procedural method for modeling the Purkinje fibers of the heart. J. Physiol. Sci. 2008;58(7):481–486. doi: 10.2170/physiolsci.RP003208. [DOI] [PubMed] [Google Scholar]
- Keller DUJ, Kalayciyan R, Dössel O, Seemann G. Fast creation of endocardial stimulation profiles for the realistic simulation of body surface ECGs. IFMBE Proceedings. 2009;25(4):145–148. [Google Scholar]
- Kotikanyadanam M, Göktepe S, Kuhl E. Computational modeling of electrocardiograms: A finite element approach toward cardiac excitation. Comm. Num. Meth. Eng. 2010;26(5):524–533. [Google Scholar]
- Krishnamoorthi S, Perotti LE, Borgstrom NP, Ajijola O. a., Frid A, Ponnaluri AV, Weiss JN, Qu Z, Klug WS, Ennis DB, Garfinkel A. Simulation methods and validation criteria for modeling cardiac ventricular electrophysiology. PLoS ONE. 2014;9(12):e114494. doi: 10.1371/journal.pone.0114494. [DOI] [PMC free article] [PubMed] [Google Scholar]
- Li Z-Y, Maldonado C, Zee-Cheng C, Hiromasa S, Kupersmith J. Purkinje fibre-papillary muscle interaction in the genesis of triggered activity in a guinea pig model. Cardiovasc. Res. 1992;26(5):543–548. doi: 10.1093/cvr/26.5.543. [DOI] [PubMed] [Google Scholar]
- Lindenmayer A. Mathematical models for cellular interactions in development. J. Theoret. Bio. 1968;18:300–315. doi: 10.1016/0022-5193(68)90080-5. [DOI] [PubMed] [Google Scholar]
- Mann DL,P,ZD, Libby P, Bonow RO,E,B. Braunwald’s Heart Disease: A Textbook of Cardiovascular Medicine. Elsevier; Saunders: 2015. [Google Scholar]
- Niederer S. a., Kerfoot E, Benson AP, Bernabeu MO, Bernus O, Bradley C, Cherry EM, Clayton R, Fenton FH, Garny A, Heidenreich E, Land S, Maleckar M, Pathmanathan P, Plank G, Rodríguez JF, Roy I, Sachse FB, Seemann G, Skavhaug O, Smith NP. Verification of cardiac tissue electrophysiology simulators using an n-version benchmark. Phil. Trans. A. 2011;369:4331–4351. doi: 10.1098/rsta.2011.0139. [DOI] [PMC free article] [PubMed] [Google Scholar]
- Pak H-N, Kim Y-H, Lim HE, Chou C-C, Miyauchi Y, Fang YH, Sun K, Hwang C, Chen P-S. Role of the posterior papillary muscle and Purkinje potentials in the mechanism of ventricular fibrillation in open chest dogs and swine: Effects of catheter ablation. J. Cardiovasc. Electrophys. 2006;17(7):777–783. doi: 10.1111/j.1540-8167.2006.00511.x. [DOI] [PubMed] [Google Scholar]
- Palamara S, Vergara C, Catanzariti D, Faggiano E, Pangrazzi C, Centonze M, Nobile F, Maines M, Quarteroni A. Computational generation of the Purkinje network driven by clinical measurements: the case of pathological propagations. Int. J. Num. Meth. Biomed. Eng. 2014;30(12):1558–1577. doi: 10.1002/cnm.2689. [DOI] [PubMed] [Google Scholar]
- Perotti LE, Krishnamoorthi S, Borgstrom NP, Ennis DB, Klug WS. Regional segmentation of ventricular models to achieve repolarization dispersion in cardiac electrophysiology modeling. Int. J. Num. Meth. Biomed. Eng. 2015;e02718:1–17. doi: 10.1002/cnm.2718. [DOI] [PMC free article] [PubMed] [Google Scholar]
- Plonsey R, Barr RC. Bioelectricity: A Quantitative Approach. Springer Science & Business Media. 2007 [Google Scholar]
- Sebastian R, Zimmerman V, Romero D, Frangi AF. Construction of a computational anatomical model of the peripheral cardiac conduction system. IEEE Trans. Biomed. Eng. 2011;58:3479–3482. doi: 10.1109/TBME.2011.2166553. [DOI] [PubMed] [Google Scholar]
- Sebastian R, Zimmerman V, Romero D, Sanchez-Quintana D, Frangi AF. Characterization and modeling of the peripheral cardiac conduction system. IEEE Trans. Med. Img. 2013;32(1):45–55. doi: 10.1109/TMI.2012.2221474. [DOI] [PubMed] [Google Scholar]
- Tawara S. Das Reizleitungssystem des Säugetierherzens. Fischer. 1906 [Google Scholar]
- Veenstra RD, Joyner RW, Rawling D. a. Purkinje and ventricular activation sequences of canine papillary muscle. Effects of quinidine and calcium on the Purkinje-ventricular conduction delay. Circ. Res. 1984;54(5):500–515. doi: 10.1161/01.res.54.5.500. [DOI] [PubMed] [Google Scholar]
- Vergara C, Palamara S, Catanzariti D, Nobile F, Faggiano E, Pangrazzi C, Centonze M, Maines M, Quarteroni A, Vergara G. Patient-specific generation of the Purkinje network driven by clinical measurements of a normal propagation. Med. Bio. Eng. Comp. 2014;52(10):813–826. doi: 10.1007/s11517-014-1183-5. [DOI] [PubMed] [Google Scholar]
- Waller BF, Gering LE, Branyas NA, Slack JD. Anatomy, histology, and pathology of the cardiac conduction system: Part II. Clinical cardiology. 1993;16(4):347–352. doi: 10.1002/clc.4960160410. [DOI] [PubMed] [Google Scholar]
- Zygote Media Group Zygote Solid 3d Heart GenerationsI & II Development Report. Technical Development of 3D Anatomical Systems. 2014 [Google Scholar]


