Abstract.
Rod-dominated transient retinal phototropism (TRP) has been recently observed in freshly isolated mouse and frog retinas. Comparative confocal microscopy and optical coherence tomography revealed that the TRP was predominantly elicited from the rod outer segment (OS). However, the biophysical mechanism of rod OS dynamics is still unknown. Mouse and frog retinal slices, which displayed a cross-section of retinal photoreceptors and other functional layers, were used to test the effect of light stimulation on rod OSs. Time-lapse microscopy revealed stimulus-evoked conformational changes of rod OSs. In the center of the stimulated region, the length of the rod OS shrunk, while in the peripheral region, the rod OS swung toward the center region. Our experimental observation and theoretical analysis suggest that the TRP may reflect unbalanced rod disc-shape changes due to localized visible light stimulation.
Keywords: retina, rod photoreceptor, transient retinal phototropism, conformational changes
1. Introduction
Located at the back of the eye, the retina is a complex neural system that consists of multiple types of neural cells for light capturing and visual information processing.1 Retinal rod and cone photoreceptors are the first-order neurons responsible for converting light energy into biochemical and bioelectrical activities, i.e., phototransduction processes.2 It is well known that the cone photoreceptors are responsible for photopic vision and rod photoreceptors are responsible for scotopic vision. Early studies showed that retinal cone photoreceptors exhibited differential sensitivities to light entering the eye from different portions of the pupil.3 The sensitivity to the light entering from the center of the pupil was higher than that of the light entering from the periphery of the pupil.4 This phenomenon is described as the Stiles–Crawford effect (SCE). In general, it is believed that physical properties, such as the shape and orientation of retinal photoreceptors, govern SCE.5,6 Retinal photoreceptors are physically oriented toward the center of the pupil,7 and that architecture makes them most sensitive to the light entering from the center of the pupil. It is known that SCE is predominantly observed in cone photoreceptors.8 However, why it is absent in rod photoreceptors is still not well understood.9 Recently, oblique light stimulation evoked transient retinal phototropism (TRP) has been detected in amphibian (frog) and mammalian (mouse) retinas.10 High-resolution microscopy of freshly isolated retinas indicated that TRP is predominated by rod photoreceptors.10 We speculate that the rod-dominated TRP may provide a quick compensation for the light inefficiency of oblique illumination, and the time course of the observed TRP can be too short to be detectable by the psychophysical methods used for traditional SCE studies.3,9 Comparative confocal microscopy and optical coherence tomography revealed that TRP was predominantly elicited from the rod outer segment (OS).11 However, the biophysical mechanism of rod OS dynamics is still unknown.
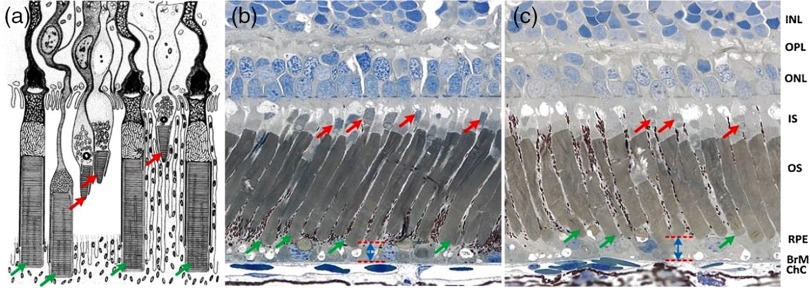
This study was designed to investigate conformational changes of rod OSs correlated with localized visible stimulation. Retinal slices, which display a cross-section of retinal photoreceptors and other functional layers, were used to test the effect of light stimulation on rod OSs. High spatiotemporal resolution near-infrared (NIR) light microscopy was employed to monitor photoreceptor changes in retinal slices stimulated by visible light flashes. Leopard frogs (Rana Pipiens) and mice (Mus musculus) were used in this study. We selected frog retinas as the primary specimens while mouse retinas were used to verify the photoreceptor movement in mammals. The frog retinas were selected as a primary specimen because of the following reasons: 1) frog photoreceptors are relatively large and allow unambiguous observation of individual photoreceptors, 2) frog rod and cone photoreceptors can be easily separated based on their cellular diameters. It is known that the diameter of rod photoreceptors ( to ) is much larger than that of cone photoreceptors ( to ), and 3) frog rod and cone photoreceptors are stratified into different depths, which allows easy evaluation of rod OSs.12 Schematic diagram of retinal photoreceptors of leopard frog [Fig. 1(a)] and histological images [Figs. 1(b) and 1(c)] verify that the OS tips of cone and rod photoreceptors are located at different depths. The red and green arrows show cone and rod photoreceptors, respectively. Moreover, comparative histological images of dark-adapted [Fig. 1(b)] and light-adapted [Fig. 1(c)] retinas showed increased distances between the rod tips and Bruch’s membrane. In other words, reduced rod OS length was observed in the light-adapted retina compared to that in a dark-adapted retina. Therefore, we speculated that the visible light stimulation may produce transient rod OS changes, and TRP may reflect unbalanced rod disc-shape changes due to localized light phototransduction.
Fig. 1.
(a) Schematic diagram of retinal photoreceptors of the leopard frog adapted from Ref. 12, (b) histological images of dark-adapted and (c) light-adapted frog eyes adapted from Ref. 13. The red arrows indicate cone photoreceptors and the green arrows indicate rod photoreceptors. INL, inner nuclear layer; OPL, outer plexiform layer; ONL, outer nuclear layer; IS, inner segment; OS, outer segment; RPE, retina pigment epithelium; BrM, Bruch’s membrane; ChC, choriocapillaris.
2. Methods
2.1. Sample Preparation
Retinal samples were prepared in a dark room with dim red light illumination. After 4 h of dark adaptation, eyes were enucleated from euthanized frogs or mice. The eyeball was hemisected along the equator with fine scissors and the anterior structures were removed from the retina. The retina was separated from the retinal pigment epithelium (RPE). The isolated retina was then cut into retinal slices with thickness. Without RPE, retinal slices provided a simple preparation to enable easy observation of individual photoreceptors and quantitative calculation of photoreceptor movements. The entire sample preparation procedure was performed in Ringer’s solution containing NaCl, KCl, , , , and D-glucose.14–16 Retinal slices were immersed in a chamber filled with Ringer’s solution and placed under an NIR light microscope for optical imaging. Retinal slices were illuminated from the side, which comprised a cross-section of retinal photoreceptors and other functional layers. All experiments were performed following the protocols approved by the Animal Care Committee at the University of Illinois at Chicago.
2.2. Experimental Setup
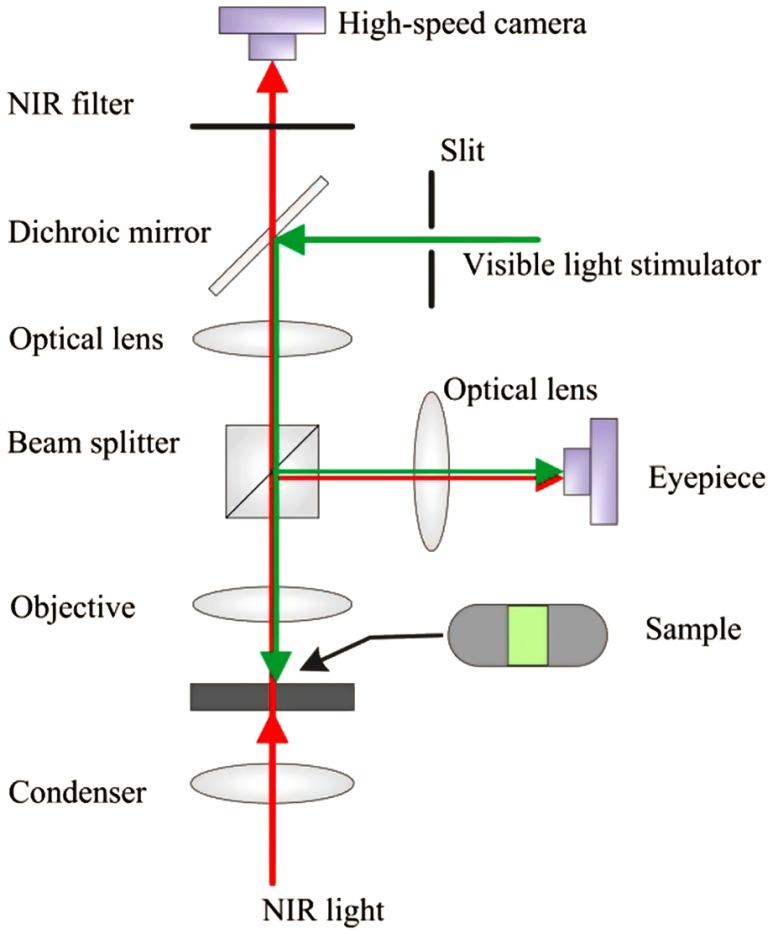
An NIR light microscope (BX531WI, Olympus, Japan) with a NA 0.8 water immersion objective lens was used for this study. Figure 2 shows a schematic diagram of the experimental setup that has been used for intrinsic optical signal (IOS)17,18 and TRP10 studies in freshly isolated retinas. A high-speed camera (Neo 5.5, Andor Technology Ltd., Belfast, Ireland) was used for dynamic NIR microscopy imaging. The NIR light for optical imaging was produced by a halogen lamp with a band-pass filter (wavelength band: 775 to 1000 nm). The stimulus light was provided by a fiber-coupled light-emitting diode with a central wavelength of 550 nm (wavelength range: 450 to 650 nm). The retinal slices were stimulated by a rectangular shape stimulus light pattern. The width of the stimulus light pattern was controlled by an adjustable slit in the stimulus path. Adjustable light intensity was controlled with neural density filters. For illustrated measurements in this article, we selected the following stimulus intensities: , , , and , with 1 s stimulus duration. All illustrated images in this article were captured at a speed of , with a frame resolution of . The entire experiment for each retinal preparation was completed within 2 h after animal euthanasia.
Fig. 2.
Schematic diagram of experimental setup. The NIR light was used for retinal imaging. The visible light stimulator was used for retinal stimulation. A slit was used to limit the visible stimulus light into a rectangle shape. In front of the high-speed camera, the NIR filter was used to block visible stimulus light.
2.3. Data Processing
Optical flow is a well-established method for calculating target movements between two images. It identifies movements in sequential images, which makes the method suitable for tracking movements of retinal cells.11 To verify the photoreceptor displacement, we adopted optical flow MATLAB® software developed by Sun et al.19 Stimulus-evoked photoreceptor movement was quantified in magnitude and direction maps by comparing the images before and after the stimulation. In order to automatically segment active areas and inactive areas in a displacement magnitude map, Otsu’s thresholding method20 was used. The active area is the location with detectable photoreceptor displacement, while the inactive area is the location without detectable displacement. Segmented active areas were color coded in the direction map.
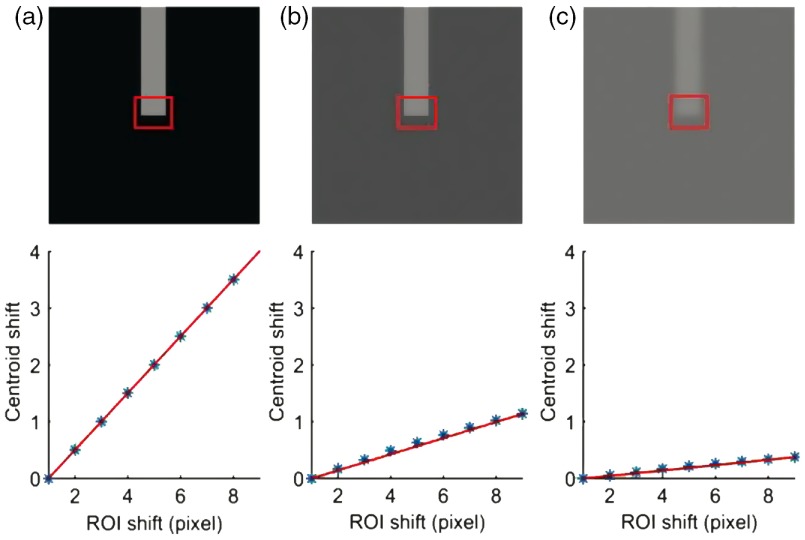
Centroid detection algorithm was used to study the stimulus-evoked OS changes’ kinetics of individual rod photoreceptors. A similar algorithm has been well established for single molecule localization to achieve super-resolution imaging, such as photoactivated localization microscopy (PALM) and stochastic optical reconstruction microscopy, at nanometer resolution.21–24 In this study, a small rectangular window was drawn on the tip of the rod OS and the intensity centroid of the window was tracked in each frame of the video. If the background of the image was completely black (i.e., zero intensity), the centroid movement in the vertical direction should be exactly half of the physical length change of the photoreceptor tip; i.e., if the photoreceptor was shrunk by 2 pixels in the vertical direction, the centroid should move 1 pixel in the vertical direction. However, the background of the image recorded with microscopy was not totally black. In fact, the contrast between the photoreceptor and background was poor due to the transparency of retinal tissues. Because the centroid detection method is sensitive to the background level, it requires background correction for reliable measurement. The performance of the centroid detection method can be improved by using a simple background filtering approach or by using a more robust background-corrected centroid estimation method, such as super-resolution analysis tools (QuickPALM).21 We resolved this problem by calibrating each photoreceptor in the first frame of each image sequence. First, a small rectangular window was drawn which covers approximately half background and half photoreceptor tip as shown in Fig. 3(a). The window was shifted up to 4 pixels above and 4 pixels below the original position, with one pixel interval in the vertical direction. At each position of the selected window, the centroid was calculated. The centroid movement in the vertical direction was plotted against the magnitude of the window shift in the vertical direction. The relation between these two variables was almost linear. A best fit line was plotted and the slope of the line was calculated. The slope of the line provided the relation between the photoreceptor movement and centroid movement when the background was nonzero.
Fig. 3.
Effect of the background on the centroid calculation. The first row shows a simulated photoreceptor at three different contrasts compared to its background: (a) high contrast, (b) intermediate contrast, and (c) low contrast. The calibration factor was calculated by shifting a small rectangular area [i.e., a region of interest (ROI)] one pixel at a time in the vertical direction. The second row shows shifting of x-coordinates of the centroid when ROI shifts in the vertical direction. The calibration factor for the high-contrast image (a) was 0.50, the calibration factor for the intermediate-contrast image (b) was 0.14, and the calibration factor for the low-contrast image (c) was 0.05.
We tested this technique on a simulated rectangular photoreceptor created with intensities , as shown in Fig. 3(a). The centroids were calculated by placing the photoreceptor in three different (high, intermediate, and low) background conditions. First, the simulated photoreceptor was placed on a completely black background [Fig. 3(a)]; i.e., all the background pixels had zero intensity. The calibration factor was 0.50, which indicated that the photoreceptor movement was two times that of the centroid movement. Second, the simulated photoreceptor was placed on backgrounds with intensities that were nearly half of the photoreceptor intensity [Fig. 3(b)]. The background was formed by creating pixel values with intensities to create slightly different intensities in the background region. The calibration factor for intermediate contrast conditions was 0.14, which indicated that photoreceptor movements were nearly seven times that of the centroid movement. Third, the simulated photoreceptor was placed on the background with a slightly lower intensity () than that of the photoreceptors [Fig. 3(c)]. The calibration factor for low-contrast conditions was 0.05, indicating that the photoreceptor movement was 20 times of the centroid movement. The aforementioned centroid displacement method was used to calculate the stimulus-evoked OS change kinetics of individual rod photoreceptors of retinal slices. To verify the reliability of the observed rod OS changes, we repeated the measurements with nine retinal slices under identical experimental condition.
3. Results
3.1. Video Microscopy of Stimulus-Evoked Rod Outer Segment Changes
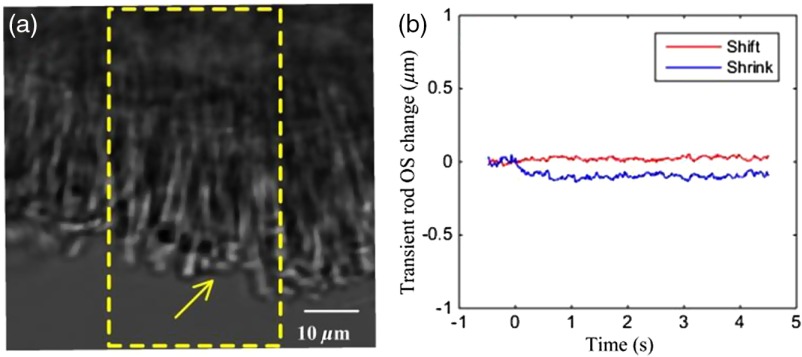
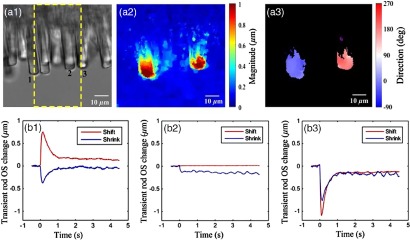
Figures 4 and 5 illustrate representative measurement with mouse and frog retinal slices, respectively. Individual mouse photoreceptors can be ambiguously observed in Fig. 4(a), and stimulus-evoked OS change of a single mouse rod photoreceptor (yellow arrowhead) is shown in Fig. 4(b). Compared to a mouse photoreceptor, individual photoreceptors can be easily observed in Fig. 5(a1). Movie clips associated with Figs. 4(a) and 5(a1) revealed rapid rod OS length and orientation changes in mouse and frog retinas. Each movie represents a 5.0 s time-lapse microscopy video clip that consists of a 0.5 s prestimulus, 1.0 s stimulus, and 3.5 s post-stimulus recordings. The magnitude and direction of rod OS change varied with the photoreceptor position within the stimulation area. In the center of the stimulation region, the length of the OS shrunk, while in the peripheral region, the OS swung toward the center of the stimulation area in the plane perpendicular to the incident stimulus light. The diameters of mouse photoreceptors (both rods and cones to ) were relatively smaller than those of frog photoreceptors (rod: to , cone: to ).25,26 For easy calculation of individual photoreceptor movements, we used frog retinal slices for quantitative analysis of rod OS changes at the center and periphery of the stimulus pattern.
Fig. 4.
(a) Stimulus-evoked mouse rod OS movement (Video 1, MOV, 56 KB) [URL: http://dx.doi.org/10.1117/1.JBO.21.6.065006.1]. The yellow window indicates the stimulation area. (b) OS changes of a mouse rod photoreceptor (yellow arrowhead) at the center of the stimulus window.
Fig. 5.
(a1) Stimulus-evoked frog rod OS movement (Video 2, MOV, 64 KB) [URL: http://dx.doi.org/10.1117/1.JBO.21.6.065006.2]. The yellow window indicates the stimulation area. Corresponding optic flow visualization results are shown in (a2) and (a3). (a2) Rod OS magnitude map derived from the image and (a3) rod OS direction map. Inactive area mapped by black background. Active/inactive areas are separated according to the displacement magnitude using Otsu’s thresholding method. The active area is the location with detectable photoreceptor displacement, while the inactive area is the location without detectable displacement. The distribution around 0 and 180 deg represents moving toward right and left, respectively, while that around 90 deg represents shrinkage. Stimulus-evoked OS changes in frog rod photoreceptors at the left edge (rod 1), center (rod 2), and right edge (rod 3) of the window are shown in (b1), (b2), and (b3), respectively. At the center of the stimulus pattern, the rod OS tip movement was predominated by shrinkage, i.e., OS length reduction. At the left and right edges of the stimulus pattern, the rod OS tip movement was predominated by a shift toward the center of the stimulus.
3.2. Quantitative Comparison of Transient Rod Outer Segment Changes
Figures 5(a2) and 5(a3) show the magnitude and direction map derived from the two microscopy images taken before and after 100 ms of the stimulation using the optic flow method described in Sec. 2. The magnitude map is color coded [Fig. 5(a2)]. The direction map revealed that photoreceptors located at the left edge of the stimulation center moved toward the 0 deg direction (right direction), whereas photoreceptors located at the right edge of the stimulation center moved toward 180 deg (left direction). While the optical flow map revealed robust rod OS shifts at the right and left edges of the stimulus pattern, it was not sensitive enough to disclose the small rod OS shrinkage at the center of the stimulus pattern. Figure 5(b) illustrates stimulus-evoked OS changes’ kinetics of individual rod photoreceptors. At the left edge (rod 1) of the stimulus pattern, the rod OS tip movement was predominated by a shift to the right [Fig. 5(b1)]. At the center (rod 2) of the stimulus pattern, the rod OS tip movement was predominated by shrinkage of , i.e., OS length reduction [Fig. 5(b2)]. At the right edge (rod 3) of the stimulus pattern, the rod OS tip movement was predominated by a shift to the left [Fig. 5(b3)].
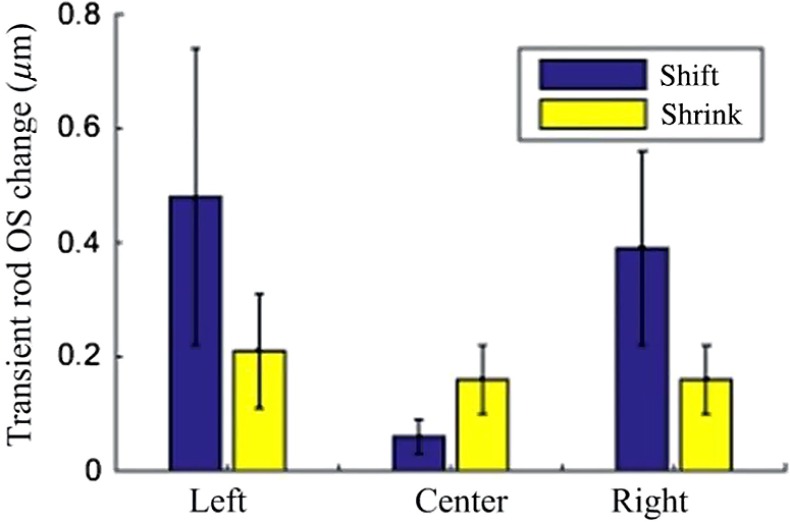
We repeated the measurements with nine retinal slices under identical experimental conditions. The average transverse movement (tip shift) and shrinkage (length reduction) of nine left-edge, nine center, and nine right-edge rods are shown in Fig. 6. Our results revealed that the peripheral rod OS tip shifted toward the center of the stimulus pattern, while the center rod OS length reduced unambiguously. As shown in Fig. 6, the average shrinkage and shift of the photoreceptors located at the center of the stimulation area were and , respectively. Similarly, the average shrinkage and shift at the left peripheral region of the stimulation area were and , respectively, and the average shrinkage and shift at the right peripheral region of the stimulation area were and , respectively. The average shift of the photoreceptors located at the center of the stimulation area was smaller than the average shrinkage. In contrary, the average shrinkage of the photoreceptors located in the peripheral regions was smaller than the average shift. The left and right photoreceptor shifts were significantly different () from that of the central photoreceptor, whereas the remainder of the comparisons were not statistically different.
Fig. 6.
Averaged stimulus-evoked OS changes from nine rod photoreceptors at the left edge, center, and right edge of the stimulus pattern. The OS tip movement was predominated by a shrinkage response at the center of the stimulus pattern and by a shift response at the peripheral region of the stimulus pattern.
3.3. Effect of Stimulus Strength on Rod Outer Segment Changes
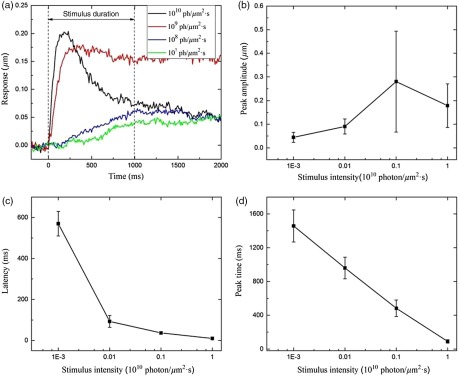
To further understand the stimulus-evoked photoreceptor kinetics, we measured the effect of stimulus light intensity on the rod OS shift response. Individual photoreceptors at the left/right edges of the stimulus pattern were selected for measurement. Experimental data were collected from 12 retinal slices with four different stimulus intensities. For each stimulus intensity, three retinal slices were measured. We measured the latency time (the time delay before detectable response), peak time (the time to peak magnitude), and peak amplitude. Figure 7 shows the averaged rod OS responses (latency, peak time, and peak amplitude) corresponding to four stimulus intensities. It was observed that the peak amplitude increased with enhanced stimulus intensity [Fig. 7(b)]. However, the latency decreased with enhanced stimulus intensity [Fig. 7(c)]. Similarly, the peak time, i.e., time to peak, decreased with enhanced stimulus intensity [Fig. 7(d)].
Fig. 7.
Effect of stimulus strength on rod OS changes. (a) Rod OS changes elicited by different stimulus intensities, (b) averaged peak amplitude ( rods) versus stimulus strength, (c) averaged latency ( rods) versus stimulus strength, and (d) averaged peak time ( rods) versus stimulus strength.
4. Discussion
Rods and cones are specialized for different aspects of vision. It is known that cones are less sensitive but allow color vision in bright light conditions. In contrary, rods are extremely sensitive but only provide monochromatic vision in dim light conditions. Phototransduction takes place in the photoreceptor OS, especially in the membranous discs. It is established that the visual pigment rhodopsin is embedded in the OS discs.27 However, the format of rhodopsin organization in the disc membrane is still controversial.27 In history, it was proposed that the rhodopsin can be freely diffusing in the disc membrane.28,29 However, recent studies revealed a variable fraction of immobile rhodopsin and heterogeneity of rhodopsin diffusion.27,30,31 In this study, our observed OS morphological change, due to local stimulation, provides additional evidence to support the existence of immobile rhodopsin and multiple-order architecture of rhodopsin organization in the photoreceptor. We speculate that local conformational change occurred due to visible light stimulation. Predominant OS length shrink was observed when the rod was fully covered by the stimulus pattern, while predominant OS tip shift was detected when the rod was partially covered by the stimulus pattern. A similar model has been proposed by Asai et al.32 Previous studies have reported swollen disc membranes and shrinkage with respect to the osmotic pressure of the bathing medium,33 rod OS volume changes due to the illumination,34–37 permeability changes in the photoreceptor disc membranes due to the illumination,38 bleaching that causes the rhodopsin to sink into the lipid core,39 conformational changes, such as turbidity, viscosity, and light scattering intensity of the disc membrane upon its bleaching,32 intradistal space expansion and contraction with respect to the osmotic pressure of impermanent substances,40 and birefringence of the rod OS changes after bleaching.41 It has been reported that the illumination generates changes in the outer enveloping plasma membrane, which lead to a reduction in the dark current.38 Although disc membranes in rods are isolated and freely floating in the outer enveloping membrane,42 it is highly possible that disc membranes undergo conformational changes in such a way that the diffusion of ions during phototransduction would be compensated.
The conformational change of the rod OS upon stimulation depends upon the intensity of the stimulus light [Fig. 7(a)]. When the stimulus intensity changed from to , the latency changed from 570 to 10 ms, and the peak time changed from 1457 to 90 ms. The number of bleached rhodopsin molecules increased with enhanced light intensity to accelerate the conformational changes in the rod OS, causing a shortened latency and time-to-peak. Early studies have shown an inverse relation between the light intensity and rhodopsin concentration across the rat retina.43,44 If a rat raised in low light intensity was moved to high light intensity, its rod OS shortened and rhodopsin concentration decreased and vice versa. In our study, the enhanced light intensity accelerated the conformational changes in the rod OS, causing a shortened latency and time-to-peak. The photoreceptor response did not increase after certain stimulus intensity, rather it decreased slightly [Fig. 7(b)]. We speculated that this might involve complications of rod saturation and adaptation mechanisms.
In this study, the OS responses were quantitatively calculated from individual photoreceptors. However, we cannot exclude the possibility that the movement of individual photoreceptors could be influenced by physical connection to their neighboring photoreceptors. We are also aware that the experiment using isolated retina without RPE was different from natural conditions, and the stimulus-evoked movements might be overestimated compared to that in in situ conditions. Further in vivo investigation is required for better understanding of the observed rod OS changes.
Moreover, the stimulus-evoked rod OS changes may contribute to stimulus-evoked IOS signals45 observed in both isolated retinas,11,17,46–48 intact animals,49–51 and human subjects.52–55 Comparative study of the stimulus-evoked TRP and IOS has been discussed in our previous publication.10 Stimulus-evoked IOSs correlated with action potentials and postsynaptic potentials have also been detected in excitable neural tissues56,57 and endocrine cells.58,59 Biophysical sources and physiological mechanisms of the IOSs in neural tissues have been explored by several research groups.56,57,60–63 Multiple physiological processes, such as neurotransmitter secretion,64 reorientation of membrane proteins and phospholipids,56,57,65 and refractive index change of neural tissues66 during neural activation, might contribute to the observed IOSs observed in neural tissues. Water influx in response to ionic currents through gated channels during depolarization causes cellular swelling, which can also produce light scattering61,62,67,68 and polarization changes63 in stimulus-activated excitable cells.
5. Conclusion
In summary, the rods at the center of the stimulation region shrunk as they were exposed to visible light homogenously, while those in the periphery of the stimulation region shifted as each rod was partially exposed to light. The observed rod OS morphological change due to local stimulation provides experimental evidence to support the existence of immobile rhodopsin and multiple-order architecture of rhodopsin organization in the photoreceptor.27,30,31 The rod OS movement due to uneven stimulus light distribution at a single cell level may elucidate the mechanism underlying oblique light stimulus-evoked TRP in rods.10 Further investigation is required to understand the biochemical mechanism of the observed rod OS kinetics. A better study of the TRP may provide a noninvasive IOS biomarker to enable early detection of age-related macular degeneration and other diseases that are known to produce retinal photoreceptor dysfunctions.
Supplementary Material
Acknowledgments
The authors would like to thank Dr. Klaus P. Hofmann and Dr. David R. Pepperberg for valuable discussions about rhodopsin and phototransduction. This research was supported in part by NIH R01 EY023522, NIH R01 EY024628, NIH P30 EY001792, and NSF CBET-1055889.
Biographies
Xiaohui Zhao is an associate professor in the College of Physics Science and Technology, Hebei University. He received his PhD in physical chemistry from Institute of Chemistry, Chinese Academy of Sciences in 2007. His research interest includes biomedical optics and optical material detection.
Damber Thapa is a postdoctoral research associate in the Department of Bioengineering at the University of Illinois at Chicago. He received his PhD in Vision Science from the University of Waterloo in 2015. His research interest includes optics of the eye, adaptive optics for vision, retinal imaging and digital data processing.
Benquan Wang is a PhD candidate in the Department of Bioengineering at the University of Illinois at Chicago. He received his bachelor’s degree in biomedical engineering from Tianjin University in 2012. His research interest includes biomedical optics and retinal study.
Yiming Lu is a PhD candidate in the Department of Bioengineering at the University of Illinois at Chicago. He received his bachelor’s and master’s degree in biomedical engineering from Tianjin University in 2011 and 2014, respectively. His research interest includes biomedical optics, retinal imaging and retinal study.
Shaoyan Gai is an associate professor in the School of Automation, Southeast University of China. He received his PhD from Southeast University of China in 2008. His research interest includes optics instrumentation and vision study.
Xincheng Yao is a professor in the Department of Bioengineering, University of Illinois at Chicago. He received his PhD in Optics from the Institute of Physics, Chinese Academy of Sciences in 2001. His research interest includes biomedical optics instrumentation and retinal imaging.
References
- 1.Kolb H., “Photoreceptors,” in Webvision: The Organization of the Retina and Visual System, Kolb H., Fernandez E., Nelson R., Eds., University of Utah Health Sciences Center, Salt Lake City, Utah: (1995). [PubMed] [Google Scholar]
- 2.Arshavsky V. Y., Lamb T. D., Pugh E. N., Jr., “G proteins and phototransduction,” Annu. Rev. Physiol. 64, 153–187 (2002). 10.1146/annurev.physiol.64.082701.102229 [DOI] [PubMed] [Google Scholar]
- 3.Stiles W., Crawford B., “The luminous efficiency of rays entering the eye pupil at different points,” Proc. R. Soc. London. Ser. B 112, 428–450 (1933). 10.1098/rspb.1933.0020 [DOI] [Google Scholar]
- 4.Burns S. A., et al. , “Variations in photoreceptor directionality across the central retina,” J. Opt. Soc. Am. A 14(9), 2033–2040 (1997). 10.1364/JOSAA.14.002033 [DOI] [PMC free article] [PubMed] [Google Scholar]
- 5.Westheimer G., “Dependence of the magnitude of the Stiles-Crawford effect on retinal location,” J. Physiol. 192(2), 309–315 (1967). 10.1113/jphysiol.1967.sp008301 [DOI] [PMC free article] [PubMed] [Google Scholar]
- 6.Pask C., Stacey A., “Optical properties of retinal photoreceptors and the Campbell effect,” Vis. Res. 38(7), 953–961 (1998). 10.1016/S0042-6989(97)00291-5 [DOI] [PubMed] [Google Scholar]
- 7.Laties A. M., Enoch J. M., “An analysis of retinal receptor orientation. I. Angular relationship of neighboring photoreceptors,” Invest. Ophthalmol. Vis. Sci. 10(1), 69–77 (1971). [PubMed] [Google Scholar]
- 8.Donner K. O., Rushton W. A., “Rod-cone interaction in the frog’s retina analysed by the Stiles-Crawford effect and by dark adaptation,” J. Physiol. 149, 303–317 (1959). 10.1113/jphysiol.1959.sp006341 [DOI] [PMC free article] [PubMed] [Google Scholar]
- 9.Westheimer G., “Directional sensitivity of the retina: 75 years of Stiles-Crawford effect,” Proc. R. Soc. London, Ser. B: Biol. Sci. 275(1653), 2777–2786 (2008). 10.1098/rspb.2008.0712 [DOI] [PMC free article] [PubMed] [Google Scholar]
- 10.Lu R., et al. , “Dynamic near-infrared imaging reveals transient phototropic change in retinal rod photoreceptors,” J. Biomed. Opt. 18(10), 106013 (2013). 10.1117/1.JBO.18.10.106013 [DOI] [PMC free article] [PubMed] [Google Scholar]
- 11.Wang B., et al. , “Functional optical coherence tomography reveals transient phototropic change of photoreceptor outer segments,” Opt. Lett. 39(24), 6923–6926 (2014). 10.1364/OL.39.006923 [DOI] [PMC free article] [PubMed] [Google Scholar]
- 12.Nilsson S. E., “An electron microscopic classification of the retinal receptors of the leopard frog (Rana pipiens),” J. Ultrastruct. Res. 10, 390–416 (1964). 10.1016/S0022-5320(64)80018-6 [DOI] [PubMed] [Google Scholar]
- 13.Zhang Q.-X., et al. , “In vivo optical coherence tomography of light-driven melanosome translocation in retinal pigment epithelium,” Sci. Rep. 3, 2644 (2013). 10.1038/srep02644 [DOI] [PMC free article] [PubMed] [Google Scholar]
- 14.Yao X. C., et al. , “Rapid optical coherence tomography and recording functional scattering changes from activated frog retina,” Appl. Opt. 44(11), 2019–2023 (2005). 10.1364/AO.44.002019 [DOI] [PubMed] [Google Scholar]
- 15.Yao X. C., Zhao Y. B., “Optical dissection of stimulus-evoked retinal activation,” Opt. Express 16(17), 12446–12459 (2008). 10.1364/OE.16.012446 [DOI] [PubMed] [Google Scholar]
- 16.Yao X.-C., Zhao Y.-B., Gorga C. M., “Optical visualization of stimulus-evoked fast neural activity and spreading waves in amphibian retina,” Proc. SPIE 6864, 68640M (2008). 10.1117/12.764048 [DOI] [Google Scholar]
- 17.Li Y.-C., et al. , “Parallel optical monitoring of visual signal propagation from the photoreceptors to the inner retina layers,” Opt. Lett. 35(11), 1810–1812 (2010). 10.1364/OL.35.001810 [DOI] [PMC free article] [PubMed] [Google Scholar]
- 18.Li Y.-G., et al. , “High spatiotemporal resolution imaging of fast intrinsic optical signals activated by retinal flicker stimulation,” Opt. Express 18(7), 7210–7218 (2010). 10.1364/OE.18.007210 [DOI] [PMC free article] [PubMed] [Google Scholar]
- 19.Sun D., Roth S., Black M. J., “Secrets of optical flow estimation and their principles,” in 2010 IEEE Conf. on Computer Vision and Pattern Recognition, pp. 2432–2439 (2010). 10.1109/CVPR.2010.5539939 [DOI] [Google Scholar]
- 20.Otsu N., “A threshold selection methods from grey-level histograms,” IEEE Trans. Syst. Man Cybern. 9(1), 62–66 (1979). 10.1109/TSMC.1979.4310076 [DOI] [Google Scholar]
- 21.Berglund A. J., et al. , “Fast, bias-free algorithm for tracking single particles with variable size and shape,” Opt. Express 16(18), 14064–14075 (2008). 10.1364/OE.16.014064 [DOI] [PubMed] [Google Scholar]
- 22.Cheezum M. K., Walker W. F., Guilford W. H., “Quantitative comparison of algorithms for tracking single fluorescent particles,” Biophys. J. 81(4), 2378–2388 (2001). 10.1016/S0006-3495(01)75884-5 [DOI] [PMC free article] [PubMed] [Google Scholar]
- 23.Crocker J. C., Grier D. G., “Methods of digital video microscopy for colloidal studies,” J. Colloid Interface Sci. 179(1), 298–310 (1996). 10.1006/jcis.1996.0217 [DOI] [Google Scholar]
- 24.Parthasarathy R., “Rapid, accurate particle tracking by calculation of radial symmetry centers,” Nat. Methods 9(7), 724–726 (2012). 10.1038/nmeth.2071 [DOI] [PubMed] [Google Scholar]
- 25.Carter- Dawson L. D., Lavail M. M., “Rods and cones in the mouse retina. I. Structural analysis using light and electron microscopy,” J. Comp. Neurol. 188(2), 245–262 (1979). 10.1002/(ISSN)1096-9861 [DOI] [PubMed] [Google Scholar]
- 26.Mustafi D., Engel A. H., Palczewski K., “Structure of cone photoreceptors,” Prog. Retinal Eye Res. 28(4), 289–302 (2009). 10.1016/j.preteyeres.2009.05.003 [DOI] [PMC free article] [PubMed] [Google Scholar]
- 27.Gunkel M., et al. , “Higher-order architecture of rhodopsin in intact photoreceptors and its implication for phototransduction kinetics,” Structure 23(4), 628–638 (2015). 10.1016/j.str.2015.01.015 [DOI] [PubMed] [Google Scholar]
- 28.Poo M., Cone R. A., “Lateral diffusion of rhodopsin in the photoreceptor membrane,” Nature 247(5441), 438–441 (1974). 10.1038/247438a0 [DOI] [PubMed] [Google Scholar]
- 29.Cone R. A., “Rotational diffusion of rhodopsin in the visual receptor membrane,” Nat. New Biol. 236(63), 39–43 (1972). 10.1038/newbio236039a0 [DOI] [PubMed] [Google Scholar]
- 30.Najafi M., et al. , “Impact of signaling microcompartment geometry on GPCR dynamics in live retinal photoreceptors,” J. Gen. Physiol. 140(3), 249–266 (2012). 10.1085/jgp.201210818 [DOI] [PMC free article] [PubMed] [Google Scholar]
- 31.Govardovskii V. I., et al. , “Lateral diffusion of rhodopsin in photoreceptor membrane: a reappraisal,” Mol. Vis. 15, 1717–1729 (2009). [PMC free article] [PubMed] [Google Scholar]
- 32.Asai H., et al. , “A light-induced conformational change in rod photoreceptor disc membrane,” Exp. Eye Res. 21(3), 259–267 (1975). 10.1016/0014-4835(75)90097-4 [DOI] [PubMed] [Google Scholar]
- 33.Brierley G., et al. , “On the permeability of isolated bovine retinal outer segment fragments,” Biochim. Biophys. Acta, Biomembr. 163(1), 114–116 (1968). 10.1016/0005-2736(68)90040-0 [DOI] [PubMed] [Google Scholar]
- 34.Hofmann K., et al. , “Light-induced axial and radial shrinkage effects and changes of the refractive index in isolated bovine rod outer segments and disc vesicles,” Biophys. Struct. Mech. 8(1–2), 67–93 (1981). 10.1007/BF01047107 [DOI] [PubMed] [Google Scholar]
- 35.Hofmann K., et al. , “Measurements of fast light-induced light-scattering and -absorption changes in outer segments of vertebrate light sensitive rod cells,” Biophys. Struct. Mech. 2(1), 61–77 (1976). 10.1007/BF00535653 [DOI] [PubMed] [Google Scholar]
- 36.McConnell D. G., Rafferty C. N., Dilley R. A., “The light-induced proton uptake in bovine retinal outer segment fragments,” J. Biol. Chem. 243(22), 5820–5826 (1968). [PubMed] [Google Scholar]
- 37.Yagi N., “Structural changes in rod outer segments of frog and mouse after illumination,” Exp. Eye Res. 116, 395–401 (2013). 10.1016/j.exer.2013.09.016 [DOI] [PubMed] [Google Scholar]
- 38.Heller J., Ostwald T. J., Bok D., “Effect of illumination on the membrane permeability of rod photoreceptor discs,” Biochemistry 9(25), 4884–4889 (1970). 10.1021/bi00827a009 [DOI] [PubMed] [Google Scholar]
- 39.Blasie J., “The location of photopigment molecules in the cross-section of frog retinal receptor disk membranes,” Biophys. J. 12(2), 191–204 (1972). 10.1016/S0006-3495(72)86079-X [DOI] [PMC free article] [PubMed] [Google Scholar]
- 40.Heller J., Ostwald T. J., Bok D., “The osmotic behavior of rod photoreceptor outer segment discs,” J. Cell Biol. 48(3), 633–649 (1971). 10.1083/jcb.48.3.633 [DOI] [PMC free article] [PubMed] [Google Scholar]
- 41.Liebman P., et al. , “Membrane structure changes in rod outer segments associated with rhodopsin bleaching,” Nature 251(6), 31–36 (1974). 10.1038/251031a0 [DOI] [PubMed] [Google Scholar]
- 42.Cohen A. I., “Vertebrate retinal cells and their organization,” Biol. Rev. 38(4), 427–459 (1963). 10.1111/brv.1963.38.issue-4 [DOI] [Google Scholar]
- 43.Schremser J.-L., Williams T. P., “Rod outer segment (ROS) renewal as a mechanism for adaptation to a new intensity environment. I. Rhodopsin levels and ROS length,” Exp. Eye Res. 61(1), 17–23 (1995). 10.1016/S0014-4835(95)80054-9 [DOI] [PubMed] [Google Scholar]
- 44.Williams T., et al. , “Reciprocity between light intensity and rhodopsin concentration across the rat retina,” J. Physiol. 516(3), 869–874 (1999). 10.1111/tjp.1999.516.issue-3 [DOI] [PMC free article] [PubMed] [Google Scholar]
- 45.Yao X., Wang B., “Intrinsic optical signal imaging of retinal physiology: a review,” J. Biomed. Opt. 20(9), 090901 (2015). 10.1117/1.JBO.20.9.090901 [DOI] [PMC free article] [PubMed] [Google Scholar]
- 46.Li Y.-G., et al. , “High-speed line-scan confocal imaging of stimulus-evoked intrinsic optical signals in the retina,” Opt. Lett. 35(3), 426–428 (2010). 10.1364/OL.35.000426 [DOI] [PMC free article] [PubMed] [Google Scholar]
- 47.Zhang Q.-X., et al. , “Microlens array recording of localized retinal responses,” Opt. Lett. 35(22), 3838–3840 (2010). 10.1364/OL.35.003838 [DOI] [PMC free article] [PubMed] [Google Scholar]
- 48.Zhao Y.-B., Yao X.-C., “Intrinsic optical imaging of stimulus-modulated physiological responses in amphibian retina,” Opt. Lett. 33(4), 342–344 (2008). 10.1364/OL.33.000342 [DOI] [PubMed] [Google Scholar]
- 49.Zhang Q., et al. , “Functional optical coherence tomography enables in vivo physiological assessment of retinal rod and cone photoreceptors,” Sci. Rep. 5, 9595 (2015). 10.1038/srep09595 [DOI] [PMC free article] [PubMed] [Google Scholar]
- 50.Zhang Q. X., et al. , “In vivo confocal intrinsic optical signal identification of localized retinal dysfunction,” Invest. Ophthalmol. Vis. Sci. 53(13), 8139–8145 (2012). 10.1167/iovs.12-10732 [DOI] [PMC free article] [PubMed] [Google Scholar]
- 51.Zhang Q. X., et al. , “In vivo confocal imaging of fast intrinsic optical signals correlated with frog retinal activation,” Opt. Lett. 36(23), 4692–4694 (2011). 10.1364/OL.36.004692 [DOI] [PMC free article] [PubMed] [Google Scholar]
- 52.Rha J., et al. , “Variable optical activation of human cone photoreceptors visualized using a short coherence light source,” Opt. Lett. 34(24), 3782–3784 (2009). 10.1364/OL.34.003782 [DOI] [PMC free article] [PubMed] [Google Scholar]
- 53.Grieve K., Roorda A., “Intrinsic signals from human cone photoreceptors,” Invest. Ophthalmol. Vis. Sci. 49(2), 713–719 (2008). 10.1167/iovs.07-0837 [DOI] [PubMed] [Google Scholar]
- 54.Jonnal R. S., et al. , “In vivo functional imaging of human cone photoreceptors,” Opt. Express 15(24), 16141–16160 (2007). 10.1364/OE.15.016141 [DOI] [PMC free article] [PubMed] [Google Scholar]
- 55.Abramoff M. D., et al. , “Visual stimulus-induced changes in human near-infrared fundus reflectance,” Invest. Ophthalmol. Vis. Sci. 47(2), 715–721 (2006). 10.1167/iovs.05-0008 [DOI] [PMC free article] [PubMed] [Google Scholar]
- 56.Cohen L. B., Keynes R. D., Hille B., “Light scattering and birefringence changes during nerve activity,” Nature 218(5140), 438–441 (1968). 10.1038/218438a0 [DOI] [PubMed] [Google Scholar]
- 57.Tasaki I., et al. , “Changes in fluorescence, turbidity, and birefringence associated with nerve excitation,” Proc. Natl. Acad. Sci. U. S. A. 61(3), 883–888 (1968). 10.1073/pnas.61.3.883 [DOI] [PMC free article] [PubMed] [Google Scholar]
- 58.Yao X. C., et al. , “Functional imaging of glucose-evoked rat islet activities using transient intrinsic optical signals,” J. Mod. Opt. 59(7), 843–847 (2012). 10.1080/09500340.2012.674564 [DOI] [PMC free article] [PubMed] [Google Scholar]
- 59.Li Y. C., et al. , “Intrinsic optical signal imaging of glucose-stimulated insulin secreting beta-cells,” Opt. Express 19(1), 99–106 (2011). 10.1364/OE.19.000099 [DOI] [PMC free article] [PubMed] [Google Scholar]
- 60.Rector D. M., et al. , “In-vivo observations of rapid scattered light changes associated with neurophysiological activity,” in In-Vivo Optical Imaging of Brain Function, 2nd ed., Frontiers in Neuroscience, Frostig R., Ed., pp. 143–170, CRC Press, Boca Raton, Florida: (2009). [PubMed] [Google Scholar]
- 61.Cohen L. B., “Changes in neuron structure during action potential propagation and synaptic transmission,” Physiol. Rev. 53(2), 373–418 (1973). [DOI] [PubMed] [Google Scholar]
- 62.Yao X. C., Rector D. M., George J. S., “Optical lever recording of displacements from activated lobster nerve bundles and Nitella internodes,” Appl. Opt. 42(16), 2972–2978 (2003). 10.1364/AO.42.002972 [DOI] [PubMed] [Google Scholar]
- 63.Yao X. C., et al. , “Cross-polarized reflected light measurement of fast optical responses associated with neural activation,” Biophys. J. 88(6), 4170–4177 (2005). 10.1529/biophysj.104.052506 [DOI] [PMC free article] [PubMed] [Google Scholar]
- 64.Salzberg B. M., Obaid A. L., Gainer H., “Large and rapid changes in light scattering accompany secretion by nerve terminals in the mammalian neurohypophysis,” J. Gen. Physiol. 86(3), 395–411 (1985). 10.1085/jgp.86.3.395 [DOI] [PMC free article] [PubMed] [Google Scholar]
- 65.Landowne D., “Measuring nerve excitation with polarized light,” Jpn. J. Physiol. 43(Suppl 1), S7–S11 (1993). [PubMed] [Google Scholar]
- 66.Stepnoski R. A., et al. , “Noninvasive detection of changes in membrane potential in cultured neurons by light scattering,” Proc. Natl. Acad. Sci. 88(21), 9382–9386 (1991). 10.1073/pnas.88.21.9382 [DOI] [PMC free article] [PubMed] [Google Scholar]
- 67.Kim G. H., et al. , “A mechanical spike accompanies the action potential in mammalian nerve terminals,” Biophys. J. 92(9), 3122–3129 (2007). 10.1529/biophysj.106.103754 [DOI] [PMC free article] [PubMed] [Google Scholar]
- 68.Tasaki I., Byrne P. M., “Rapid structural changes in nerve fibers evoked by electric current pulses,” Biochem. Biophys. Res. Commun. 188(2), 559–564 (1992). 10.1016/0006-291X(92)91092-5 [DOI] [PubMed] [Google Scholar]
Associated Data
This section collects any data citations, data availability statements, or supplementary materials included in this article.


