

Abstract
Aim
High dose melphalan (HDM) and autologous stem cell transplantation (ASCT) retains a central role in the treatment of myeloma. The aim of this study was to determine whether HDM exposure (area under the concentration vs. time curve, AUC), is significantly associated with transplant outcomes.
Methods
Melphalan concentrations were measured in six to 11 plasma samples collected after HDM (median 192 mg m– 2) to determine melphalan AUC for a total of 114 patients. Binary logistic regression was used to assess whether melphalan AUC was associated with severe (≥ grade 3) oral mucositis. Multivariate Cox regression was used to assess whether melphalan AUC was significantly associated with time to progression, progression‐free survival and overall survival (OS).
Results
Melphalan AUC ranged from 4.9 to 24.6 mg l–1 h, median 12.84 mg l–1 h. Melphalan AUC above the median was a risk factor for severe mucositis (HR 1.21, 95% CI 1.06, 1.38, P = 0.004) but was also associated with significantly improved overall survival (OS) (HR 0.40, 95% CI 0.20, 0.81, P = 0.001), with an estimated median survival of 8.50 years vs. 5.38 years for high vs. low AUC groups. Multivariate analysis did not identify melphalan AUC as being significantly associated with time to progression or progression‐free survival.
Conclusions
This large scale pharmacodynamic analysis of HDM demonstrates that high melphalan exposure is associated with improved survival, with an acceptable increase in transplant toxicity. These results suggest studies targeting a higher AUC are warranted in patients undergoing HDM and ASCT for myeloma.
Keywords: melphalan, pharmacokinetics, treatment outcome
What is Already Known about this Subject
We have previously examined the population pharmacokinetics of high dose melphalan in 100 patients with multiple myeloma who received a 200 mg m– 2 dose (with adjustments for renal impairment or obesity) and we observed a 5‐fold variation in melphalan exposure (AUC), with values ranging from 4.9 to 24.4 mg l–1 h 1.
Melphalan exposure was found to be significantly higher in patients who experienced severe (≥ grade 3) mucositis.
What this Study Adds
Our data set now has prolonged follow up in 114 patients, so in this study we now examine the associations between melphalan exposure and the clinically important transplant‐specific endpoints, such as time to progression, progression‐free survival and overall survival, as well as the incidence of grade 3 or higher mucositis.
We found that high exposure (above the median) is significantly associated with longer overall survival.
High exposure (above the median) is also significantly associated with an increase in severe mucositis.
Introduction
Melphalan is one of the most active chemotherapeutic agents in the treatment of myeloma. It is recognized that dose correlates with disease response, 2, 3, 4 and for 30 years the use of high dose melphalan (HDM) and autologous stem cell transplantation (ASCT) has been incorporated into consolidation therapy for thousands of patients, with an overall median survival (OS) benefit of more than 1 year 5. Although prolonged survival is achieved with the addition of newer immunomodulatory and proteasome inhibitory agents 6, HDM and ASCT remain a recommended standard of care after induction therapy in eligible patients 7, 8, 9. A recent randomized trial confirmed the significant net clinical benefit of response consolidation with HDM and ASCT after lenalidomide and dexamethasone induction in patients with newly diagnosed myeloma, with a significantly longer progression free survival (PFS) in patients undergoing transplant (60% vs. 38% at 3 years) 10.
The standard melphalan dose in single agent HDM therapy for myeloma is a body surface area (BSA) based dose of 200 mg m– 2, used initially in Arkansas 11, and confirmed by Moreau et al. 12 where improved OS was observed for patients receiving 200 mg m– 2 compared with melphalan 140 mg m– 2 and total body irradiation. Subsequent trials have used 200 mg m– 2 as a standard 13, 14, 15 and comparison of 200 mg m– 2 with 100 mg m– 2 demonstrated better outcomes with the higher dose in the tandem transplant setting 16. However, escalated dosing to 220 mg m– 2 was associated with a higher incidence of grade 4 mucositis (>60%), delayed platelet engraftment and cardiac arrhythmias 17. The dose of HDM was escalated with the addition of the cryoprotectant, amifostine, to 280 mg m– 2, but at this dose cardiac arrhythmias were dose limiting 18.
With predominant renal clearance 19, 200 mg m– 2 results in excessive non‐haematological toxicity in patients with renal impairment. A dose reduction to 140 mg m– 2 (Mel‐140) was found tolerable in a small study of 21 patients with a creatinine >177 μmol l–1 20 and Mel‐140 has since remained the recommended dose for such patients. Dosing of patients aged >65–70 years is unclear, with excessive toxicity reported with 200 mg m– 2 21, 22 but possibly inferior outcomes with 100 mg m– 2 23. A weakness of the BSA‐based dosing approach is that it does not adequately reduce the inter‐patient variation in exposure. Consequently, some patients are over‐dosed resulting in excessive toxicity while a significant proportion may be under‐dosed, compromising the efficacy of this therapy associated with significant morbidity.
We previously examined the pharmacokinetics of HDM in 100 patients treated with 200 mg m– 2 (with dose adjustments for renal impairment or obesity) and observed a 5‐fold variation in melphalan exposure (area under the concentration vs. time curve, AUC), with values ranging from 4.9 to 24.4 mg l–1 h 1. Plasma clearance was significantly influenced by creatinine clearance, fat free mass and haematocrit. Pharmacodynamic analysis identified that patients with higher exposure to melphalan had a higher incidence of ≥ grade 3 mucositis 1. As our data set now has prolonged follow‐up in 114 patients, our study can now examine the association between melphalan exposure and the clinically important transplant‐specific endpoints, such as time to progression, progression‐free survival and overall survival.
Methods
Study design
This prospective, multicentre, observational study was registered with the Australian Clinical Trials Registry (Registration number: ACTRN0126000231549) and approved by the Ethics Committees of the six participating hospitals. The Ethics approval numbers were CH62/6/2004–016‐J.Trotman (Concord Hospital), X04‐0105 (Royal Prince Alfred Hospital), 05/65 (Gosford Hospital), 05/06 Kwan (St George Hospital), HREC2004/4/4.13(1831) (Westmead Hospital) and HE05/075 (Wollongong Hospital). All hospitals were members of the Autologous Working Party of the BMT Network NSW. All participants provided written informed consent. Eligible patients were those with symptomatic myeloma receiving HDM conditioning followed by an ASCT. All pre‐transplant, peri‐transplant and post‐transplant care was at the direction of the local investigator, with no modification to treatment as part of study participation.
Melphalan administration and pharmacokinetics
Patients received HDM according to the standard dosing recommendation of the BMT Network, using 200 mg m– 2 for patients with normal renal function. The degree of any dose modification for those with abnormal renal function and obesity, (including the weight entered into the Du Bois formula for body surface area (BSA) 24 for obese patients), remained at the discretion of the treating physician. Sixty‐seven patients had no dose modifications, two patients had higher doses of 212 and 216 mg m– 2 as they were also enrolled in a melphalan dose escalation study, 30 patients had a dose reduction due to abnormal renal function, whilst 12 had a dose reduction due to obesity.
Melphalan was administered immediately after preparation, as a 15–30 min intravenous infusion followed by a 20 ml saline flush. Administration was via a peripheral cannula (n = 92) or a quarantined lumen of a multi‐lumen central line (n = 23). For the first 63 patients a 5 ml blood sample was collected at the completion of the melphalan infusion, then 5, 10, 20, 30, 40 and 50 min and 1, 2, 3, 4 and 8 h later. This initial data allowed the identification of optimal sampling windows by D‐optimality as previously published 1, with reduced sampling (at 5, 15, 30, 40, 75 and 150 min after the end of infusion) for the following 52 patients. Plasma was separated within 15 min and frozen at ‐40 °C within 30 min of collection. Total and unbound plasma melphalan concentrations were measured using our previously published high performance liquid chromatography assay employing ultraviolet detection 25. The assay for total melphalan had excellent inter‐day precision (<6%) and accuracy (<2% deviation from true concentration) and was linear from 0.5 to 40 μg ml–1 concentrations. The limit of detection was 0.1 μg ml–1. Specificity was demonstrated with respect to melphalan hydrolysis products and several drugs that were tested.
The concentration data were used to develop a two compartment population pharmacokinetic model for melphalan using the nonmem VI software. Full details of this model are provided in our previously published manuscript 1. Total and unbound melphalan exposure (area under the concentration vs. time curve, AUC and uAUC) were calculated from individual estimates of total and unbound clearance using the formula, AUC = dose/clearance.
Disease parameters
Immunoglobulin levels, serum electrophoretogram, immunofixation and paraprotein quantitation were recorded: at diagnosis, within 7 days prior to ASCT, at 6 weeks (42 to 49 days), then at 6, 12, 18 and 24 months post‐ASCT and in the event of disease progression or re‐initiation of therapy. Where an abnormal band, detected in either the γ‐ or β‐globulin region, was unable to be quantified the level was estimated by subtracting the laboratory mean of that fraction from the total fraction. The stage of myeloma was recorded using both the Durie–Salmon and International Staging Systems. 26, 27 Disease response criteria conformed to those recently established by the Consensus Recommendation of the International Myeloma Working Group, with the exception that serum free light chains (SFLCs) were not available during the recruitment period. 28.
Transplant assessment
Transplant parameters recorded included stem cell dose infused (CD34+ cells x106 kg–1), transfusion requirements, engraftment parameters and any non‐infectious or gastrointestinal toxicities ≥ grade 3. All grades of infectious and gastrointestinal toxicities, including oral mucositis, colitis, nausea, vomiting and diarrhoea, were recorded daily from 2 days prior to day 28 post‐transplant, using the National Cancer Institute Common Terminology Criteria for Adverse Events (version 3). Since mucositis is a major toxicity of HDM, this was assessed using both the clinical (appearance of the oral mucosa) and functional (symptoms and degree of nutritional support required) scales of the National Cancer Institute Common Terminology Criteria for Adverse Events (version 3). Administration of any maintenance therapy (e.g. steroids or thalidomide) post‐transplant was also recorded.
Endpoints tested for association with melphalan exposure and other potential influential factors
The study endpoints tested for associations with melphalan exposure were time to progression (TTP) post‐transplant, PFS and OS. TTP was measured from the date of ASCT until the first sign of relapse or progression (e.g. reappearance of paraprotein or rise of >25%, or new bone lesions or increase in size of existing bone lesions). PFS was defined as survival without evidence of disease relapse or progression.
The primary toxicity endpoint tested for association with melphalan exposure was the development of ≥ grade 3 oral mucositis, as defined and monitored for in the preceding section.
Statistics
All statistical analyses were performed using IBM SPSS Statistics software, version 21.
Binary logistic regression was used to assess the effect of various risk factors (including melphalan exposure/dose, patient characteristics and disease parameters) on the incidence of severe mucositis (≥ grade 3, either clinical or functional) with each factor first run as a univariate independent variable. Variables with P values <0.1 were considered for inclusion in the multivariate model, after testing for colinearity. The final model was that which provided the best predictions for severe (≥ grade 3) oral mucositis.
Multivariate Cox proportional hazards regression models were developed to identify the factors associated with longer TTP, PFS or OS. Covariates tested included those related to melphalan exposure (AUC, uAUC), and those related to disease parameters (e.g disease stage, paraprotein type) and patient characteristics (e.g. age, weight, BMI and creatinine clearance, calculated with the Cockcroft & Gault equation 29). Each factor was first assessed in a univariate analysis, with some continuous variables also tested as categorical variables (BMI ≥ 30 kg m– 2, AUC ≥ median 12.84 mg l–1 h). Those covariates with a P value of less than 0.25 were selected for further evaluation in the multivariate model. A backwards stepwise technique was used for model building, with the least significant covariate removed at each step. The final model consisted of patient covariates remaining significant at the P < 0.05 level. Results were expressed as hazard ratios and corresponding 95% confidence intervals.
Kaplan–Meier survival analysis was used to examine the influence of high (≥ median of 12.84 mg l–1 h) and low (< 12.84 mg l–1 h) melphalan AUC on TTP, PFS and OS. In this analysis, AUC needed to be recoded as a categorical variable. As a clinical cut‐off point had not been identified, a median split of the data was used because it ensured equivalent sample size in the high and low groups. Significance of differences at (1) 3 years and (2) for the whole period of follow‐up was determined using the log rank test. Median survival times for TTP, PFS and OS were determined for the high and low AUC groups using Life Tables and compared using the Wilcoxon (Genhan) statistic, with the total period of time being subdivided into 6 monthly time intervals.
The Friedman test was used to determine whether paraprotein levels differed significantly at diagnosis, then at pre‐ and post‐high dose melphalan and ASCT. The paired Wilcoxon rank signed test was also used to test whether the paraprotein levels measured prior to high dose melphalan and ASCT were significantly different to those measured post‐ASCT. The Mann–Whitney test was used to compare percentage paraprotein change from diagnosis with pre‐ASCT and from pre‐ to post‐ASCT.
A number of statistical tests were used to investigate possible reasons for the unexpectedly poorer outcomes of the 39 patients receiving maintenance therapy post‐ASCT. The chi square test was used to determine whether this group had a significantly greater proportion of patients with (1) stage 3 disease (Durie–Salmon and International Staging Systems), (2) relapsed or progressive disease or (3) low melphalan AUC. The Mann–Whitney test was used to determine whether there were significant differences in creatinine clearance or in percentage change in paraprotein levels from diagnosis to pre‐ASCT or from pre to post‐ASCT compared with the remainder of the population.
Results
Patient demographics and pre‐transplant characteristics
One hundred and fourteen patients underwent HDM and ASCT between July 2005 and July 2010, with all follow‐up ending on August 1 2013. On this date, the median post‐transplant follow‐up time was 4.4 years (range 0.3 to 9.0). Baseline patient characteristics are shown in Table 1. Of the 114 patients, 22 were treated for relapsed or progressive disease. One hundred and three patients were undergoing their first transplant and 11 their second. A variety of pre‐transplant chemotherapy‐based induction regimens was used with little use of thalidomide or bortezomib, (Table S1). Best response to induction therapy at time of first transplant was complete response in 5%, very good partial response in 3%, partial response in 74% and stable disease in 16% of patients (Table 1). Thirty nine (34.2%) patients received maintenance treatment post‐transplant.
Table 1.
Pre‐transplant characteristics of 114 patients with multiple myeloma
| Patient characteristics, median (range) | |
|---|---|
| Age (years) | 58 (35–73) |
| Weight (kg) | 78 (42–132) |
| Melphalan dose (mg m– 2) | 193 (89–216) |
| Gender (number of patients) | |
| males/females | 68/46 |
| Immunologic isotype (number of patients) | |
| IgG | 71 (62%) |
| IgA | 26 (23%) |
| Biclonal | 1 (1%) |
| Light chain | 14 (13%) |
| Non‐secretory | 2 (2%) |
| Durie and Salmon disease stage (number of patients) | |
| 1A/1B | 35/0 |
| 2A/2B | 38/2 |
| 3A/3B | 26/9 |
| Unknown | 4 |
| International disease stage | |
| 1/2/3/Unknown | 42/39/22/11 |
| Diagnosis parameters, median (range) | |
| Serum creatinine (μmol l–1) | 86 (41–548, n = 106) |
| β2‐microglobulin (mg l–1) | 3.2 (1.2–39, n = 102) |
| Albumin (g l–1) | 38 (8–60, n = 110) |
| Haemoglobin (g l–1) | 112 (73–151, n = 101) |
| Lytic lesions (number Yes/No/unknown) | 65/39/10 |
| Pre‐autograft parameters, median (range) | |
| Serum creatinine (μmol l–1) | 78 (35–501) |
| Creatinine clearance (ml min–1) | 96 (14–255) |
| β2‐microglobulin (mg l–1) | 2.4 (1–15, n = 99) |
| Albumin (g l–1) | 39 (23–52) |
| Maximum response at autograft (number of patients) | |
| Complete | 6 (5%) |
| Very good partial | 3 (3%) |
| Partial | 84 (74%) |
| Minimal | 5 (4%) |
| No change | 13 (11%) |
| Unknown | 3 (2%) |
Melphalan pharmacokinetics
After a median melphalan dose of 193 mg m– 2 (range 89–216 mg m– 2, two patients with dose above 203 mg m– 2), there was five‐fold variability in melphalan exposure, with AUC values ranging from 4.9–24.6 mg l–1 h (median 12.84 mg l–1 h). The unbound melphalan AUC (uAUC) ranged from 1.0–6.4 mg l–1 h (median 2.8 mg l–1 h).
Transplant toxicity
Patients received a median 5.1 x 10⁶ kg–1 CD34+ cells (range 1.3–17.0 x 10⁶ kg–1). Median time to neutrophil recovery to ≥0.5 x 10⁹ l–1 was 11 days (range 6–27 days), and median time to platelet recovery >20 x 109 l–1 was also 11 days (range 0 to 151 days). Seventy‐three patients (64%) required red cell transfusions (median 2 units, range 1–12) and 86 (75%) required platelet transfusions (median 2 single donor equivalents, range 1–32). The frequencies of transplant‐related toxicities ≥ grade 3 are listed in Table 2. Eighty‐two percent of patients experienced febrile neutropenia. One patient, with a melphalan AUC of 18.4 mg l–1 h, died due to bacterial pneumonia on day 100 post‐transplant, giving a 100 day transplant‐related‐mortality (TRM) of 0.83%. Clinical and functional mucositis ≥ grade 3 were experienced by 12 and 20% of patients, respectively. The median duration of mucositis was 5 days (range 0–25). Increased melphalan AUC (continuous) (HR 1.21, 95% CI 1.06, 1.38, P = 0.004) and β2‐microglobulin at ASCT (HR 1.26, 95% CI 1.04, 1.53, P = 0.021) were significantly associated with a higher incidence of severe mucositis in a multiple logistic regression model (Tables S2, Table 3).
Table 2.
Frequency of serious (≥ grade 3) transplant‐related toxicity
| Toxicity | Incidence Number of patients (%) |
|---|---|
| Mucositis | |
| ‐Clinical | 14 (12%) |
| ‐Functional | 23 (20%) |
| Gastrointestinal toxicity | |
| ‐ Nausea | 15 (13%) |
| ‐ Vomiting | 6 (5%) |
| ‐ Diarrhoea | 24 (21%) |
| ‐ Colitis | 3 (3%) |
| Fatigue | 5 (4%) |
| Neurology (e.g. seizures, loss of consciousness) | 4 (4%) |
| Cardiovascular | 1 (1%) |
| Pulmonary | 2 (2%) |
| Haemorrhage (rectal bleeding) | 1 (1%) |
| Hepatobiliary (raised GGT for 84 days) | 1 (1%) |
| Renal failure | 1 (1%) |
Table 3.
Multiple logistic regression analysis of risk factors for the development of severe oral mucositis (≥ grade 3, either functional or clinical) in 114 myeloma patients who had high dose melphalan and ASCT
| Maximum likelihood estimates | Odds ratio estimates | |||||
|---|---|---|---|---|---|---|
| Parameter | Estimate | Standard error | Wald Χ 2 | P value | Odds ratio | 95% CI |
| Intercept | −4.657 | 1.064 | 19.158 | 0.000 | 0.009 | |
| AUC (mg l –1 h) | 0.193 | 0.067 | 8.365 | 0.004 | 1.213 | 1.064, 1.382 |
| β 2 ‐M (mg l –1 ) | 0.229 | 0.099 | 5.298 | 0.021 | 1.257 | 1.035, 1.528 |
AUC, melphalan area under the concentration vs. time curve;
β2‐M, β2‐microglobulin at ASCT.
Disease response post‐transplant
Overall response after induction therapy plus ASCT was complete response in 17/114 (14.9%) patients, very good partial response in 11 (9.6%), partial response in 68 (59.7%), stable disease in 17 (14.9%) and progressive disease in one (0.9%). Ninety‐eight patients (85%) had a recordable paraprotein at diagnosis. The median paraprotein at commencement of induction therapy was 33 g l–1 (range 0–113 g l–1), decreasing to 8 g l–1 (range 0–61 g l–1) pre‐ASCT and 3 g l–1 (range 0–33 g l–1) 6 weeks post‐ASCT (P < 0.001). Paraprotein levels decreased from diagnosis to pre‐ASCT by median 72% (range 0–100%), and from pre‐ to post‐ASCT by median 55% (range 0–100%) but did not differ significantly between the high and low AUC groups.
Time to progression
After median 4.4 years of follow‐up disease progression had occurred in 80/114 (70%) patients. Four patients died prior to relapse and three were lost to follow‐up. Figure 1A is a Kaplan–Meier plot showing the influence of melphalan AUC on TTP. At 3 years freedom from progression was 47% vs. 35% for the high vs. low AUC groups, but this difference was not significant (P = 0.105). Median TTP was 2.59 years for the high AUC group vs. 1.83 years for the low AUC group (P = 0.047). Multivariate analysis (Table S3) identified relapsed or progressive disease as the sole factor associated with shorter TTP, (HR 2.67, 95% CI 1.56, 4.57, P = 0.001). High AUC was not significantly associated with longer TTP (HR 0.66, 95% CI 0.43, 1.03, P = 0.068).
Figure 1.
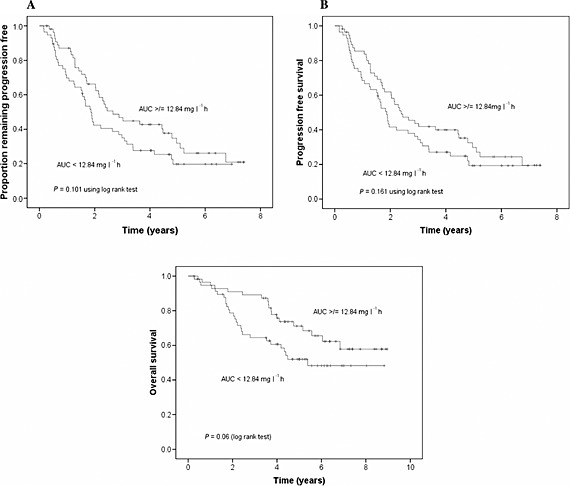
A) Association of melphalan exposure with time to progression, B) association of melphalan exposure with progression‐free survival and C) association of melphalan exposure with overall survival
Progression‐free survival
After median 4.4 years of follow‐up 84/114 (74%) patients had died or relapsed/progressed. Figure 1B is a Kaplan–Meier plot showing the influence of melphalan AUC on PFS. At 3 years the PFS was 44% vs. 34% for the high vs. low AUC groups (P = 0.172). Median PFS was 2.41 years for the high AUC group vs. 1.81 years for the low AUC group (P = 0.089). On multivariate analysis (Table S4) only relapsed/progressive disease prior to ASCT was associated with inferior PFS (HR 2.82, 95% CI 1.69, 4.72, P < 0.001).
Overall survival
After median 4.4 years of follow‐up 46/114 (40%) patients had died. Figure 1C is a Kaplan–Meier plot showing the influence of melphalan AUC on OS. At 3 years OS was 89% vs. 64% for high vs. low melphalan AUC (P = 0.003). Median survival time was 8.50 years for the high AUC group vs. 5.38 years for the low AUC group (P = 0.028). On multivariate analysis (Table 4) high AUC was associated with significantly improved OS (HR, 0.40, P = 0.001). AUC (continuous), when included in the model instead of AUC (categorical), was also significant (HR 0.90, P = 0.031). Elevated β2‐microglobulin at diagnosis (HR 1.08, P = 0.001), progressive disease before ASCT (HR, 3.26, P = 0.003) and maintenance treatment post‐ASCT (HR 2.06, P = 0.04) were associated with shorter overall survival. The observed poorer outcome in 39 patients who received maintenance therapy was unexpected. Investigation of possible reasons for this identified that they had significantly better renal function (median 80 vs.59 ml min–1 70 kg–1, P = 0.001). Twenty‐four of these 39 patients (62%) had melphalan exposure less than the median, but this was not significant using the chi square test (P = 0.073). While this group did have a significantly higher proportion of patients with Durie and Salmon stage 3 disease (58% vs. 16%, P < 0.001) compared with the remainder, there was no difference in disease stage (International Staging System), in the % change in paraprotein levels from diagnosis to pre‐ASCT, or from pre‐ to post‐ASCT, or in the proportion of patients being treated for relapsed or progressive disease.
Table 4.
Cox regression analysis of potential factors significantly associated with overall survival
| Covariate | n | Number of events | Cox univariate analysis | Cox multivariate analysis | ||
|---|---|---|---|---|---|---|
| HR (95% CI) | P | HR (95% CI) | P | |||
| AUC (mg l–1 h) continuous | 114 | 46 | 0.96 (0.88, 1.04) | 0.29 | 0.90 (0.81, 0.99) | 0.031 |
| Unbound AUC Continuous (mg l –1h) | 114 | 46 | 0.97 (0.72, 1.32) | 0.87 | ||
| AUC (categorical) | ||||||
| 1 = AUC ≥ 12.84 mg l–1 h | 57 | 19 | 0.57 (0.32, 1.03) | 0.06 | 0.40 (0.20, 0.81) | 0.001 |
| 0 = AUC < 12.84 mg l–1 h | 57 | 27 | ||||
| Melphalan dose (mg m– 2) | 114 | 46 | 0.99 (0.98, 1.01) | 0.23 | ||
| Melphalan dose (mg kg–1) | 114 | 46 | 0.91 (0.58, 1.42) | 0.67 | ||
| Age (years) | 114 | 46 | 1.03 (0.99, 1.06) | 0.12 | 1.03 (0.99, 1.07) | 0.085 |
| BMI (kg m– 2) | 114 | 46 | 0.96 (0.90, 1.02) | 0.22 | 0.97 (0.90, 1.05) | 0.43 |
| BMI (categorical) | ||||||
| 1 = BMI ≥ 30 kg m– 2 | 40 | 15 | 0.80 (0.43, 1.48) | 0.47 | ||
| 0 = BMI < 30 kg m– 2 | 74 | 24 | ||||
| Gender | ||||||
| 1 = female | 46 | 15 | 0.64 (0.35, 1.19) | 0.16 | 0.55 (0.26, 1.17) | 0.12 |
| 0 = male | 68 | 31 | ||||
| Weight (kg) | 114 | 46 | 0.99 (0.98, 1.01) | 0.57 | ||
| CLcr (ml min–1) | 114 | 46 | 1.0 (0.99, 1.01) | 0.82 | ||
| First ASCT | ||||||
| 1 = yes | 103 | 38 | 0.31 (0.14, 0.68) | 0.003 | 0.55 (0.15, 1.93) | 0.35 |
| 0 = no | 11 | 8 | ||||
| Treatment post‐ASCT | ||||||
| 1 = yes | 39 | 21 | 2.07 (1.15, 3.72) | 0.015 | 2.06 (1.03, 4.11) | 0.041 |
| 0 = no | 71 | 24 | ||||
| Paraprotein type | ||||||
| 1 = IgG | 70 | 32 | 1.55 (0.83, 2.91) | 0.17 | 1.04 (0.47, 2.27) | 0.93 |
| 0 = other | 44 | 14 | ||||
| Disease stage (Durie–Salmon) | ||||||
| 1 = Disease stage 3 | 35 | 18 | 1.95 (1.06, 3.58) | 0.031 | 1.07 (0.46, 2.46) | 0.88 |
| 0 = Disease stage 1 or 2 | 75 | 25 | ||||
| Disease stage (ISS) | ||||||
| 1 = ISS disease stage 3 | 22 | 10 | 0.86 (0.48, 1.54) | 0.61 | ||
| 0 = ISS disease stage 1 or 2 | 79 | 26 | ||||
| Maximum response pre‐ASCT | ||||||
| 1 = CR or VGPR | 19 | 7 | 0.93 (0.41, 2.08) | 0.85 | ||
| 0 = other | 93 | 38 | ||||
| Progressive disease | ||||||
| 1 = Yes | 22 | 13 | 2.33(1.23, 4.44) | 0.01 | 3.26 (1.48, 7.21) | 0.003 |
| 0 = No | 92 | 33 | ||||
| β2‐microglobulin at ASCT (g l–1) | 98 | 39 | 1.11 (0.97, 1.28) | 0.14 | ||
| β2‐microglobulin at diagnosis (g l–1) | 100 | 37 | 1.09 (1.04, 1.14) | 0.000 | 1.08 (1.03, 1.13) | 0.001 |
| Albumin at ASCT (g l–1) | 114 | 46 | 0.99 (0.94, 1.04) | 0.61 | ||
| Albumin at diagnosis (g l–1) | 108 | 43 | 0.98 (0.94, 1.02) | 0.31 | ||
HR, hazard ratio, a value of less than 1 indicates that the factor is associated with decreased mortality and higher survival probability, while a value of greater than 1 indicates increased mortality and lower survival probability.
Discussion
While the use of newer agents both pre and post‐transplant has dominated much clinical research and been key to current survival advances, HDM continues to play a central role in the management of myeloma. The 200 mg m– 2 surface area‐based dose (with modifications in renal impairment and obesity) has been the standard for many years, but pharmacokinetic and pharmacodynamic data was lacking so it was not clear whether this dosing approach provided optimal exposure for every patient. This prospective study of HDM suggests such an approach may be inadequate, as there was a five‐fold range in melphalan exposure, and high exposure (AUC above the median) being associated with a marked survival advantage. This was most marked in the first 2–3 years post‐ASCT, the time period when further adjuvant therapy is most likely to add to the minimal residual disease status induced by HDM. The advantage in disease control was offset by an acceptable increase in ≥ grade 3 gastrointestinal toxicity and no discernible adverse impact on the low transplant–related mortality of <1%.
Our study was conducted in a heterogeneous population in an era that predated extensive use of the newer immunomodulatory induction and post‐transplant therapies, so our post ASCT complete response rate of 14.9% may be lower than that achieved in current patients. Nonetheless, the use of older induction therapy for myeloma is counterbalanced by the prolonged follow‐up that such a study provides and HDM is still a central component of consolidating myeloma therapy in eligible patients. Therefore optimizing melphalan exposure remains relevant and important for achieving a minimal disease burden, complementing the effectiveness of novel therapies. Given the clear benefit of higher exposure to melphalan in the first few years post‐ASCT, optimizing melphalan exposure with HDM would be expected to improve survival long term.
In our previous pharmacokinetic study, we found patients with good renal function tended to have higher melphalan clearance and we estimated the population mean renal clearance to be approximately 40% 1. While the observed inferior survival in patients receiving post‐transplant maintenance most likely reflects selection bias in this study where pre‐ or post‐transplant therapy was at the discretion of the local investigator, it is also likely related to the very good renal function in this population and their consequent lower melphalan exposure. Patients with good renal function may be at risk of underexposure to melphalan and may require dose increases to ensure optimal outcomes, particularly those patients with high risk disease. It should also be noted that there was no information on biologic disease risk such as cytogenetics or FISH, so it was not possible to determine whether these 39 patients had biological factors suggesting high risk disease status.
Logistic regression analysis identified increased melphalan exposure and β2‐microglobulin at ASCT as significantly associated with the occurrence of ≥ grade 3 mucositis. The association with melphalan exposure is consistent with our previous results 1, whilst the association with β2‐microglobulin is most likely related to the fact that β2‐microglobulin correlates with renal function. Although creatinine clearance was also significant, it less correctly predicted patients with ≥ grade 3 mucositis when substituted for β2‐microglobulin in the model.
The absence of paraprotein data for 15% of our patients, and the confounding impact of induction therapy where 82% of patients had already achieved a partial response or better prior to ASCT, likely contributed to a lack of power to correlate higher melphalan exposure with post‐transplant paraprotein response. Similarly, the unreliability of paraprotein measurements at lower levels and use of post‐transplant maintenance therapy in 34% of patients impacts on both TTP and PFS assessments in myeloma, highlighting the limitations of these surrogate endpoints for OS.
While safe, the morbidity of HDM and ASCT is significant for all patients, so it is important to maximize its therapeutic benefit. Having demonstrated that high melphalan exposure correlates with improved overall survival, the next challenge is to determine if it is possible to develop a patient‐specific pharmacokinetic strategy to target this higher exposure without excessive transplant toxicity. We are currently conducting a pilot study evaluating whether pharmacokinetic analysis of a test dose of melphalan (20 mg m– 2) targets a desired AUC with a high degree of accuracy and feasibity. In our current study we are collecting serum free light chain and FISH analysis data as well as documenting the effect of high melphalan exposure across populations with different induction therapies and genetic profiles. Melphalan pharmacokinetic analysis in a larger and contemporary cohort would also be valuable to allow identification of a significant association between melphalan AUC and PFS. It will be similarly important to analyze the impact of genetic polymorphisms for the drug handling glutathione transferase (GST) enzymes which have been associated with significantly greater toxicity and mucositis in patients undergoing ASCT 30.
Melphalan for injection has marginal solubility and limited chemical stability upon reconstitution and dilution. Delays in drug administration, long infusion times and delayed sample processing all have the potential to affect the accuracy and reproducibility of pharmacokinetic results. In our study, shorter infusion times were recommended (ideally within 0.5 h) and it was also stressed that blood samples should be separated and the plasma frozen within half an hour of collection, or, if delays were expected, then blood samples could be collected on to ice. Melphalan for injection contains propylene glycol solubilizer that has the potential to cause to renal and cardiac side effects that limit the ability to deliver higher doses. There is now a new formulation of melphalan, propylene glycol‐free, Capitsol‐enabled melphalan, which has been shown to be bioequivalent to melphalan for injection in myeloma patients undergoing ASCT, but it does produce 10% higher AUC values 31. It is likely that our results showing an association between high AUC and improved survival are also applicable to Capitsol‐enabled melphalan. An improved toxicity profile is also expected, but this would need to be studied prospectively, also collecting pharmacokinetic and outcome data. Improved stability might allow dose administration using slower infusion rates and longer durations, with improved accuracy of pharmacokinetic determinations.
HDM is the most commonly used transplant conditioning regimen prior to ASCT. After 30 years, optimizing its use remains central to the quest to prolonging survival for patients with myeloma.
Competing Interests
All authors have completed the Unified Competing Interest form at www.icmje.org/coi_disclosure.pdf (available on request from the corresponding author) and declare no support from any organization for the submitted work, no financial relationships with any organizations that might have an interest in the submitted work in the previous 3 years and no other relationships or activities that could appear to have influenced the submitted work.
This study was supported by NH and MRC Project Grant 396702 and by Cancer Trials NSW (PK‐10‐01). Christa E. Nath is supported by the Leukaemia Research Support Fund of The Children's Hospital at Westmead. We would like to thank the patients for taking part in the study, the nursing staff in the haematology units for their care of the patients, including taking blood samples for measurement of melphalan concentrations and the data managers for recording the clinical data.
Authorship Contribution
Principal investigators: C.E. Nath, P.J. Shaw, J. Trotman.
Conception and design: C.E. Nath, P.J. Shaw, J. Trotman,
Study coordination: J. Trotman, C.E. Nath.
Statistical analysis: C.E. Nath, I. Nivison‐Smith.
Melphalan concentration measurement: C.E. Nath, L. Zeng.
Pharmacokinetic analysis: C.E. Nath, L. Zeng, A.J. McLachlan, H. Gurney, J. Earl. Provision of laboratory space and study materials: J. Earl, P.J. Shaw. Provision of patients: J. Trotman, Y.L. Kwan, P. Presgrave, C. Tiley, D. Joshua, I. Kerridge. Principal writers of manuscript: J. Trotman, C.E. Nath, P.J. Shaw.
Contributing to manuscript: I. Nivison‐Smith, H. Gurney, L. Zeng, Y.L. Kwan, P. Presgrave, C. Tiley, D. Joshua, I. Kerridge, A.J. McLachlan. All authors approved the final version of the manuscript.
Supporting information
Table S1 Induction chemotherapy prior to high dose melphalan and ASCT
Table S2 Univariate logistic regression analysis of potential risk factors for severe mucositis (≥grade 3, either functional or clinical)
Table S3 Cox regression analysis of potential factors associated with time to progression
Table S4 Cox regression analysis of potential factors associated with progression‐free survival
Supporting info item
Nath, C. E. , Trotman, J. , Tiley, C. , Presgrave, P. , Joshua, D. , Kerridge, I. , Kwan, Y. L. , Gurney, H. , McLachlan, A. J. , Earl, J. W. , Nivison‐Smith, I. , Zeng, L. , and Shaw, P. J. (2016) High melphalan exposure is associated with improved overall survival in myeloma patients receiving high dose melphalan and autologous transplantation. Br J Clin Pharmacol, 82: 149–159. doi: 10.1111/bcp.12906.
References
- 1. Nath CE, Shaw PJ, Trotman J, Zeng LH, Duffull SB, Hegarty G, McLachlan AJ, Gurney H, Kerridge I, Kwan YL, Presgrave P, Tiley C, Joshua D, Earl J. Population pharmacokinetics of melphalan in patients with multiple myeloma undergoing high dose therapy. Br J Clin Pharmacol 2010; 69: 484–97. [DOI] [PMC free article] [PubMed] [Google Scholar]
- 2. McElwain TJ, Powles RL. High‐dose intravenous melphalan for plasma‐cell leukaemia and myeloma. Lancet 1983; 2: 822–4. [DOI] [PubMed] [Google Scholar]
- 3. Selby PJ, McElwain TJ, Nandi AC, Perren TJ, Powles RL, Tillyer CR, Osborne RJ, Slevin ML, Malpas JS. Multiple myeloma treated with high dose intravenous melphalan. Br J Haematol 1987; 66: 55–62. [DOI] [PubMed] [Google Scholar]
- 4. Lazarus HM, Herzig RH, Graham‐Pole J, Wolff SN, Phillips GL, Strandjord S, Hurd D, Forman W, Gordon EM, Coccia P. Intensive melphalan chemotherapy and cryopreserved autologous bone marrow transplantation for the treatment of refractory cancer. J Clin Oncol 1983; 1: 359–67. [DOI] [PubMed] [Google Scholar]
- 5. Child JA, Morgan GJ, Davies FE, Owen RG, Bell SE, Hawkins K, Brown J, Drayson MT, Selby PJ, Medical Research Council Adult Leukaemia Working P . High‐dose chemotherapy with hematopoietic stem‐cell rescue for multiple myeloma. N Engl J Med 2003; 348: 1875–83. [DOI] [PubMed] [Google Scholar]
- 6. Kumar SK, Rajkumar SV, Dispenzieri A, Lacy MQ, Hayman SR, Buadi FK, Zeldenrust SR, Dingli D, Russell SJ, Lust JA, Greipp PR, Kyle RA, Gertz MA. Improved survival in multiple myeloma and the impact of novel therapies. Blood 2008; 111: 2516–20. [DOI] [PMC free article] [PubMed] [Google Scholar]
- 7. Rajkumar SV. Treatment of multiple myeloma. Nat Rev Clin Oncol 2011; 8: 479–91. [DOI] [PMC free article] [PubMed] [Google Scholar]
- 8. Bayraktar UD, Bashir Q, Qazilbash M, Champlin RE, Ciurea SO. Fifty years of melphalan use in hematopoietic stem cell transplantation. Biol Blood Marrow Transplant 2013; 19: 344–56. [DOI] [PMC free article] [PubMed] [Google Scholar]
- 9. Giralt S. Stem cell transplantation for multiple myeloma: current and future status. Hematol Am Soc Hematol Educ Program 2011; 2011: 191–6. [DOI] [PubMed] [Google Scholar]
- 10. Palumbo A, Cavallo F, Gay F, Di Raimondo F, Ben Yehuda D, Petrucci MT, Pezzatti S, Caravita T, Cerrato C, Ribakovsky E, Genuardi M, Cafro A, Marcatti M, Catalano L, Offidani M, Carella AM, Zamagni E, Patriarca F, Musto P, Evangelista A, Ciccone G, Omede P, Crippa C, Corradini P, Nagler A, Boccadoro M, Cavo M. Autologous transplantation and maintenance therapy in multiple myeloma. N Engl J Med 2014; 371: 895–905. [DOI] [PubMed] [Google Scholar]
- 11. Jagannath S, Vesole DH, Glenn L, Crowley J, Barlogie B. Low‐risk intensive therapy for multiple myeloma with combined autologous bone marrow and blood stem cell support. Blood 1992; 80: 1666–72. [PubMed] [Google Scholar]
- 12. Moreau P, Facon T, Attal M, Hulin C, Michallet M, Maloisel F, Sotto JJ, Guilhot F, Marit G, Doyen C, Jaubert J, Fuzibet JG, Francois S, Benboubker L, Monconduit M, Voillat L, Macro M, Berthou C, Dorvaux V, Pignon B, Rio B, Matthes T, Casassus P, Caillot D, Najman N, Grosbois B, Bataille R, Harousseau JL. Comparison of 200 mg/m(2) melphalan and 8 Gy total body irradiation plus 140 mg/m(2) melphalan as conditioning regimens for peripheral blood stem cell transplantation in patients with newly diagnosed multiple myeloma: final analysis of the Intergroupe Francophone du Myelome 9502 randomized trial. Blood 2002; 99: 731–5. [DOI] [PubMed] [Google Scholar]
- 13. Child JA, Morgan GJ, Davies FE, Owen RG, Bell SE, Hawkins K, Brown J, Drayson MT, Selby PJ. High‐dose chemotherapy with hematopoietic stem‐cell rescue for multiple myeloma. N Engl J Med 2003; 348: 1875–83. [DOI] [PubMed] [Google Scholar]
- 14. Fermand JP, Katsahian S, Divine M, Leblond V, Dreyfus F, Macro M, Arnulf B, Royer B, Mariette X, Pertuiset E, Belanger C, Janvier M, Chevret S, Brouet JC, Ravaud P, Group M‐A. High‐dose therapy and autologous blood stem‐cell transplantation compared with conventional treatment in myeloma patients aged 55 to 65 years: long‐term results of a randomized control trial from the Group Myelome‐Autogreffe. J Clin Oncol 2005; 23: 9227–33. [DOI] [PubMed] [Google Scholar]
- 15. Blade J, Rosinol L, Sureda A, Ribera JM, Diaz‐Mediavilla J, Garcia‐Larana J, Mateos MV, Palomera L, Fernandez‐Calvo J, Marti JM, Giraldo P, Carbonell F, Callis M, Trujillo J, Gardella S, Moro MJ, Barez A, Soler A, Font L, Fontanillas M, San Miguel J, Programa para el Estudio de la Terapeutica en Hemopatia M . High‐dose therapy intensification compared with continued standard chemotherapy in multiple myeloma patients responding to the initial chemotherapy: long‐term results from a prospective randomized trial from the Spanish cooperative group PETHEMA. Blood 2005; 106: 3755–9. [DOI] [PubMed] [Google Scholar]
- 16. Palumbo A, Bringhen S, Bruno B, Falcone AP, Liberati AM, Grasso M, Ria R, Pisani F, Cangialosi C, Caravita T, Levi A, Meloni G, Nozza A, Pregno P, Gabbas A, Callea V, Rizzo M, Annino L, De Stefano V, Musto P, Baldi I, Cavallo F, Petrucci MT, Massaia M, Boccadoro M. Melphalan 200 mg/m2 versus melphalan 100 mg/m2 in newly diagnosed myeloma patients: a prospective, multicenter phase 3 study. Blood 2010; 115: 1873–9. [DOI] [PubMed] [Google Scholar]
- 17. Moreau P, Milpied N, Mahe B, Juge‐Morineau N, Rapp MJ, Bataille R, Harousseau JL. Melphalan 220 mg/m2 followed by peripheral blood stem cell transplantation in 27 patients with advanced multiple myeloma. Bone Marrow Transplant 1999; 23: 1003–6. [DOI] [PubMed] [Google Scholar]
- 18. Phillips GL, Meisenberg B, Reece DE, Adams VR, Badros A, Brunner J, Fenton R, Filicko J, Grosso D, Hale GA, Howard DS, Johnson VP, Kniska A, Marshall KW, Nath R, Reed E, Rapoport AP, Takebe N, Vesole DH, Wagner JL, Flomenberg N. Amifostine and autologous hematopoietic stem cell support of escalating‐dose melphalan: a phase I study. Biol Blood Marrow Transplant 2004; 10: 473–83. [DOI] [PubMed] [Google Scholar]
- 19. Reece PA, Hill HS, Green RM, Morris RG, Dale BM, Kotasek D, Sage RE. Renal clearance and protein binding of melphalan in patients with cancer. Cancer Chemother Pharmacol 1988; 22: 348–52. [DOI] [PubMed] [Google Scholar]
- 20. Badros A, Barlogie B, Siegel E, Roberts J, Langmaid C, Zangari M, Desikan R, Shaver MJ, Fassas A, McConnell S, Muwalla F, Barri Y, Anaissie E, Munshi N, Tricot G. Results of autologous stem cell transplant in multiple myeloma patients with renal failure. Br J Haematol 2001; 114: 822–9. [DOI] [PubMed] [Google Scholar]
- 21. Badros A, Barlogie B, Siegel E, Morris C, Desikan R, Zangari M, Fassas A, Anaissie E, Munshi N, Tricot G. Autologous stem cell transplantation in elderly multiple myeloma patients over the age of 70 years. Br J Haematol 2001; 114: 600–7. [DOI] [PubMed] [Google Scholar]
- 22. Bashir Q, Shah N, Parmar S, Wei W, Rondon G, Weber DM, Wang M, Orlowski RZ, Thomas SK, Shah J, Qureshi SR, Dinh YT, Popat U, Anderlini P, Hosing C, Giralt S, Champlin RE, Qazilbash MH. Feasibility of autologous hematopoietic stem cell transplant in patients aged >/=70 years with multiple myeloma. Leuk Lymphoma 2012; 53: 118–22. [DOI] [PubMed] [Google Scholar]
- 23. Facon T, Mary JY, Hulin C, Benboubker L, Attal M, Pegourie B, Renaud M, Harousseau JL, Guillerm G, Chaleteix C, Dib M, Voillat L, Maisonneuve H, Troncy J, Dorvaux V, Monconduit M, Martin C, Casassus P, Jaubert J, Jardel H, Doyen C, Kolb B, Anglaret B, Grosbois B, Yakoub‐Agha I, Mathiot C, Avet‐Loiseau H, Intergroupe Francophone du M. Melphalan and prednisone plus thalidomide versus melphalan and prednisone alone or reduced‐intensity autologous stem cell transplantation in elderly patients with multiple myeloma (IFM 99‐06): a randomised trial. Lancet 2007; 370: 1209–18. [DOI] [PubMed] [Google Scholar]
- 24. Dubois D, Dubois E. A formula to estimate the approximate surface area if height and weight be known. Arch Intern Med 1916; 17: 863–71. [Google Scholar]
- 25. Nath CE, Zeng L, Eslick A, Trotman J, Earl JW. An isocratic UV HPLC Assay for analysis of total and free Melphalan concentrations in human plasma. Acta Chromatographica 2008; 20: 383–98. [Google Scholar]
- 26. Greipp PR, San Miguel J, Durie BG, Crowley JJ, Barlogie B, Blade J, Boccadoro M, Child JA, Avet‐Loiseau H, Kyle RA, Lahuerta JJ, Ludwig H, Morgan G, Powles R, Shimizu K, Shustik C, Sonneveld P, Tosi P, Turesson I, Westin J. International staging system for multiple myeloma. J Clin Oncol 2005; 23: 3412–20. [DOI] [PubMed] [Google Scholar]
- 27. Durie BG, Salmon SE. A clinical staging system for multiple myeloma. Correlation of measured myeloma cell mass with presenting clinical features, response to treatment, and survival. Cancer 1975; 36: 842–54. [DOI] [PubMed] [Google Scholar]
- 28. Rajkumar SV, Harousseau J‐L, Durie B, Anderson KC, Dimopoulos M, Kyle R, Blade J, Richardson P, Orlowski R, Siegel D, Jagannath S, Facon T, Avet‐Loiseau H, Lonial S, Palumbo A, Zonder J, Ludwig H, Vesole D, Sezer O, Munshi NC, San Miguel J, 1 obotIMWCP . Consensus recommendations for the uniform reporting of clinical trials: report of the International Myeloma Workshop Consensus Panel 1. Blood 2011; 117: 4691–5. [DOI] [PMC free article] [PubMed] [Google Scholar]
- 29. Cockcroft DW, Gault MH. Prediction of creatinine clearance from serum creatinine. Nephron 1976; 16: 31–41. [DOI] [PubMed] [Google Scholar]
- 30. Hahn T, Zhelnova E, Sucheston L, Demidova I, Savchenko V, Battiwalla M, Smiley SL, Ambrosone CB, McCarthy PL Jr A deletion polymorphism in glutathione‐S‐transferase mu (GSTM1) and/or theta (GSTT1) is associated with an increased risk of toxicity after autologous blood and marrow transplantation. Biol Blood Marrow Transplant 2010; 16: 801–8. [DOI] [PubMed] [Google Scholar]
- 31. Aljitawi OS, Ganguly S, Abhyankar SH, Ferree M, Marks R, Pipkin JD, McGuirk JP. Phase IIa cross‐over study of propylene glycol‐free melphalan (LGD‐353) and alkeran in multiple myeloma autologous transplantation. Bone Marrow Transplant 2014; 49: 1042–5. [DOI] [PubMed] [Google Scholar]
Associated Data
This section collects any data citations, data availability statements, or supplementary materials included in this article.
Supplementary Materials
Table S1 Induction chemotherapy prior to high dose melphalan and ASCT
Table S2 Univariate logistic regression analysis of potential risk factors for severe mucositis (≥grade 3, either functional or clinical)
Table S3 Cox regression analysis of potential factors associated with time to progression
Table S4 Cox regression analysis of potential factors associated with progression‐free survival
Supporting info item