Abstract
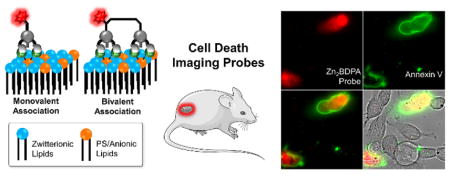
Cell death is involved in many pathological conditions, and there is a need for clinical and preclinical imaging agents that can target and report cell death. One of the best known biomarkers of cell death is exposure of the anionic phospholipid phosphatidylserine (PS) on the surface of dead and dying cells. Synthetic zinc(II)-bis(dipicolylamine) (Zn2BDPA) coordination complexes are known to selectively recognize PS-rich membranes and act as cell death molecular imaging agents. However, there is a need to improve in vivo imaging performance by selectively increasing target affinity and decreasing off-target accumulation. This present study compared the cell death targeting ability of two new deep-red fluorescent probes containing phenoxide-bridged Zn2BDPA complexes. One probe was a bivalent version of the other, and associated more strongly with PS-rich liposome membranes. But, the bivalent probe exhibited self-quenching on the membrane surface, so the monovalent version produced brighter micrographs of dead and dying cells in cell culture and also better fluorescence imaging contrast in two living animal models of cell death (rat implanted tumor with necrotic core and mouse thymus atrophy). An 111In-labelled radiotracer version of the monovalent probe also exhibited selective cell death targeting ability in the mouse thymus atrophy model, with relatively high amounts in dead and dying tissue and low off-target accumulation in non-clearance organs. The in vivo biodistribution profile is the most favorable yet reported for a Zn2BDPA complex and thus the monovalent phenoxide-bridged Zn2BDPA scaffold is a promising candidate for further development as a cell death imaging agent in living subjects.
Keywords: Cell death, molecular imaging, phosphatidylserine, nuclear imaging, fluorescence
Graphical Abstract
Introduction
Cell death plays a crucial role in developmental biology by controlling physiological homeostasis. In many disease states, however, the natural and highly regulated process of programmed cell death and cell division is disrupted, leading to either excessive cell growth, a phenomenon most recognized in malignant disorders such as cancer,1 or alternatively to high levels of cell death, as seen in neurodegenerative disease, bacterial infection, or ischemic injury.2 Molecular imaging agents that reliably report cell death are expected to have great utility in the diagnosis and treatment of human diseases, but despite decades of research and advances in the field, there is currently no cell death imaging probe approved for routine clinical use.3 Multiple biomarkers for cell death have been identified including intracellular targets, such as caspase enzymes, as well as molecular targets on the cell exterior surface.2 The anionic aminophospholipid phosphatidylserine (PS) is one of the most attractive cell death biomarkers due its relatively high abundance in cell plasma membranes (2–10% of total lipid).4 In healthy mammalian cells, PS is concentrated in the inner cytosolic leaflet of the plasma membrane due to the action of aminophospholipid translocase enzymes.4–5 During the early stages of apoptotic cell death, PS becomes exposed on the membrane outer leaflet,6 where it is an accessible target for molecular imaging probes with PS affinity. Plasma membrane integrity is lost during late stage apoptosis or acute necrosis, and the imaging probes are able to enter the cell and target cytosolic PS or related intracellular anionic biomolecules. Thus, PS-affinity probes report the presence of both dead and dying cells.
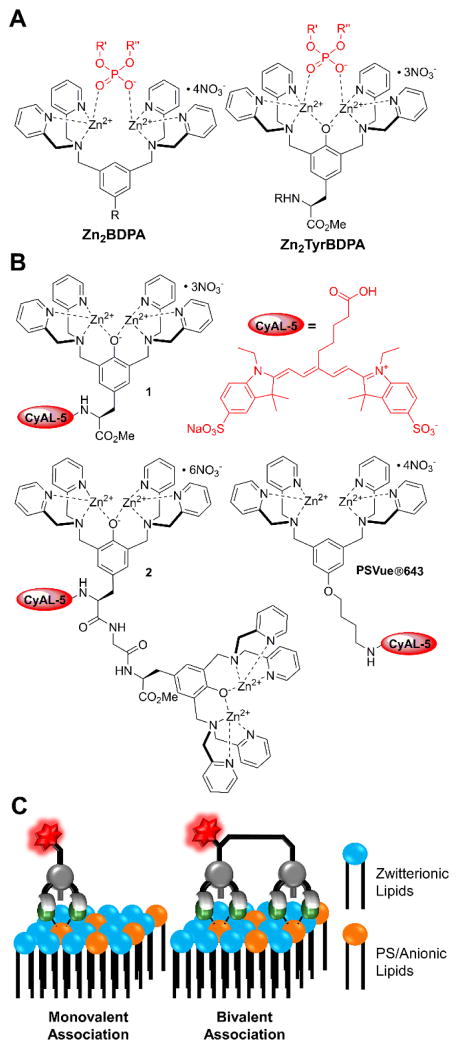
A range of PS targeting molecules have been examined for cell death imaging, including proteins7–9, peptides10–14, and small synthetic molecules15–19. Our group and others have contributed by developing zinc(II)-bis(dipicolylamine) (Zn2BDPA) coordination complexes as PS targeting agents.20–23 The basis for the targeting is strong association of the zinc cations in the Zn2BDPA structure with the anionic phosphate and carboxylate residues in the PS head group (Scheme 1A). We have demonstrated that fluorescently-labeled Zn2BDPA probes can selectively stain dead and dying mammalian cells in cell culture,24 and also enable in vivo imaging of cell death in animal models.20–21 Further progress towards clinical translation requires next generation Zn2BDPA molecules with improved in vivo imaging performance. With this objective in mind, our recent work has explored two strategies for increasing PS affinity: covalent modification of the Zn2BDPA structure25 and multivalent presentation of several Zn2BDPA units in a single probe.26 The increased affinity produced useful in vivo targeting of dead and dying tissue but a persistent problem was high levels of probe accumulation in the liver. To circumvent this problem we decided to examine molecular imaging probes based on phenoxide-bridged Zn2BDPA structures. More specifically, we chose a scaffold derived from L-tyrosine, which is given the descriptor Zn2TyrBDPA. Several Zn2TyrBDPA compounds have been examined previously for phospholipid translocation across model bilayer membranes,27 bacterial membrane targeting,28 and protein labelling,29–31 but there are no reported studies using living animal models.
Scheme 1.
Probe structures and membrane association. (A) Comparison of Zn2BDPA and Zn2TyrBDPA structures associated with phosphate residue in a PS head group. (B) Chemical structures of fluorescent monovalent and bivalent Zn2TyrBDPA probes 1 and 2 used in this study, known Zn2BDPA probe PSVue643, and CyAL-5 fluorophore. (C) Model for association of monovalent and bivalent probes with the surface of a PS-containing membrane.
Here, we compare the targeting and imaging properties of three fluorescent probes, the monovalent Zn2TyrBDPA 1, its bivalent analogue 2, and commercially available PSVue643 (Scheme 1B and 1C). All three probes have the same CyAL-5 fluorophore which exhibits narrow and intense absorption/emission bands with deep-red wavelengths (650–750 nm), and is well-suited for spectroscopic assays, fluorescence microscopy, and in vivo imaging studies.25, 32 The probe evaluation process included a series of FRET-based liposome titration studies, cell microscopy experiments, and in vivo biodistribution measurements in two living animal models of cell death (rat implanted tumor with necrotic core and mouse thymus atrophy). The favorable fluorescence imaging properties of the monovalent probe 1 led us to prepare an 111In-labelled radiotracer version and determine the in vivo targeting and biodistribution profile.
Results and Discussion
Fluorescent probe synthesis
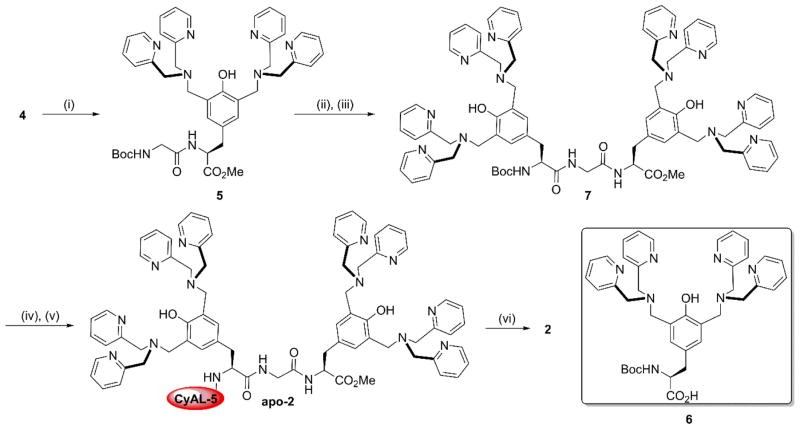
The starting compound 3 was prepared from N-Boc-L-tyrosine methyl ester under Mannich reaction conditions as previously reported.27 Removal of the Boc protecting group with trifluoroacetic acid, to give free amine 4, was followed by condensation with CyAL-5 NHS ester to give apo-1 (Scheme 2) which was converted to the zinc complex 1. To prepare dimeric probe 2 (Scheme 3), the monomeric amine 4 was extended to dipeptide 5 by EDC-mediated coupling with N-Boc-glycine. After Boc removal, the dipeptide was linked to saponified TyrDPA 630 to produce the dimeric tripeptide 7. It was important to keep the dipeptide amine intermediate from reaching high temperatures to avoid cyclization and formation of a diketopiperazine side product. Deprotection of 7 and coupling to CyAL-5 afforded apo-2 which was converted to the zinc complex 2. The fluorescent probes 1, 2, and commercially available PSVue643 exhibited similar photophysical properties as the parent CyAL-5 fluorophore (Table 1).
Scheme 2.
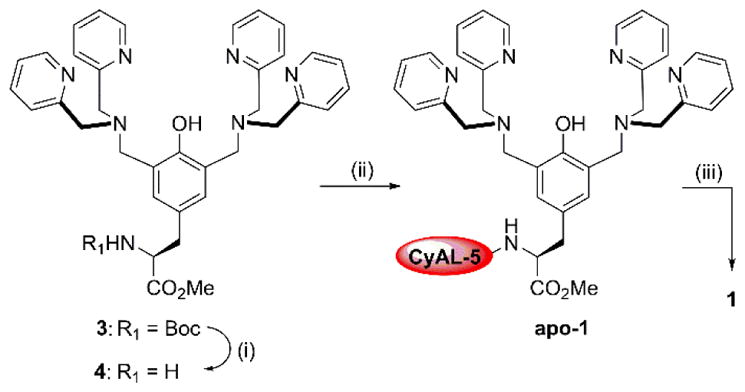
Synthesis of probe 1
Conditions: (i) TFA, DCM, rt, 2 hr, 82%; (ii) CyAL-5, DSC, NEt3, DMF, rt, 24 hr; 4, rt, 72 hr, 50%; (iii) Zn(NO3)2, MeOH, rt, 1 hr, quant.
Scheme 3.
Synthesis of probe 2
Conditions: (i) N-Boc-glycine, EDC, HOBt, DIPEA, DMF, rt, 6 hr, 70%; (ii) TFA, DCM, rt, 2 hr, 65%; (iii) 6, EDC, HOBt, DIPEA, DMF, rt, 6 hr, 65%; (iv) TFA, DCM, rt, 2 hr, 50%; (v) CyAL-5, DSC, NEt3, DMF, rt, 24 hr; 7 amine, rt, 72 hr, 33%; (vi) Zn(NO3)2, MeOH, rt, 1 hr, quant.
Table 1.
Photophysical properties of fluorescent probes
| Probe | λmax abs/em (nm), PBSa | Φ, PBSa | λmax abs/em (nm), DMSO | Φ, DMSO |
|---|---|---|---|---|
| 9CyAL-5 | 643/660 | 0.13b | 656/672 | 0.13 |
| PSVue643 | 643/661 | 0.15 | 656/673 | 0.12 |
| 1 | 644/660 | 0.23 | 656/674 | 0.13 |
| 2 | 644/660 | 0.17 | 657/673 | 0.14 |
10 mM PBS, 154 mM NaCl, pH 7.4;
Value from ref 33.
Fluorescent probe association with PS-rich liposomes
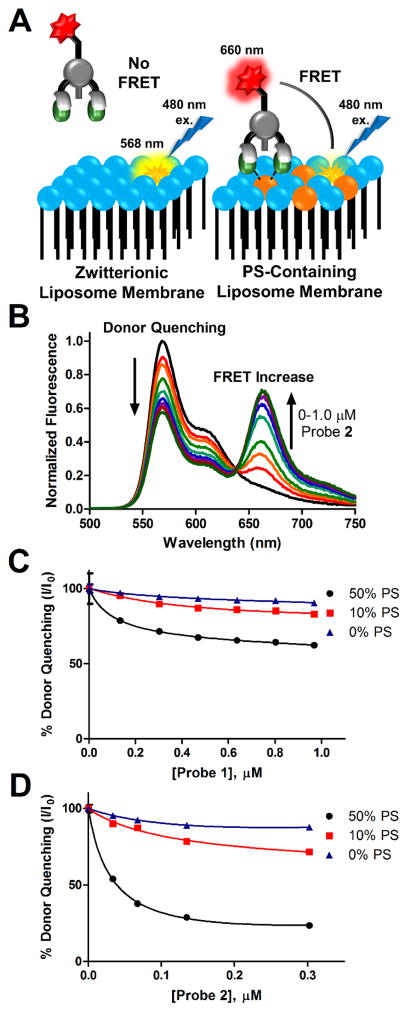
To measure the membrane association properties of the fluorescent Zn2TyrBDPA probes, we used a previously described assay based on Fluorescence Resonance Energy Transfer (FRET).25 The assay utilizes liposomes containing 1 mol % of lipophilic DiIC18 fluorophore which acts as a FRET donor. As illustrated in Figure 1A, probe association with the membrane surface leads to FRET quenching of the DiIC18 emission by the probe’s Cy5 fluorophore. The liposomes were comprised primarily of zwitterionic POPC with different amounts of POPS and 2 mol % of PEG 2000-modified lipid (PEG2000DPPE) to sterically block probe-induced liposome aggregation. Figure 1BD shows representative titration data for liposomes containing 0, 10% and 50% PS upon addition of probe 1 or 2 (see also Figure S1). The curves for DiIC18 quenching at 568 nm fitted nicely to a 1:1 binding model for PS binding. Inspection of the computed Kd values in Table 2 indicates that bivalent probe 2 binds to 50% PS liposomes with a Kd of 30 nM, three-fold stronger than monovalent probe 1.
Figure 1.
Probe membrane association measurements using a Fluorescence Resonance Energy Transfer (FRET) assay. (A) Schematic for FRET membrane association assay. Lipid coloring is consistent with legend in Scheme 1C. (B) Example fluorescence spectrum showing FRET response (λex 480 nm) upon addition of 2 to liposomes (10 μM total lipid) composed of 10% POPS (10:2:87:1 POPS:PEG2000DPPE:POPC:DiIC18). Lower graphs show fluorescence quenching of DiIC18 emission at 568 nm after titration of probe 1 (C) and 2 (D) as FRET acceptors associate with liposomes of varying PS content. All experiments were performed in HEPES buffer (10 mM, 137 mM NaCl, 3.2 mM KCl, pH 7.4) at 25°C. Error bars show standard deviation of the mean from three measurements and for most points on the graphs the errors bars are smaller than the symbols.
Table 2.
Dissociation constants for probes 1 and 2 binding to liposomes at 25°C.a
| Probe | Kd, 50% PS liposomes, μM | Kd, 10% PS liposomes, μM |
|---|---|---|
| 1 | 0.10 ± 0.07 | > 1 |
| 2 | 0.033 ± 0.004 | 0.11 ± 0.03 |
50% PS liposomes were composed of 50:47:2:1 POPS:POPC:PEG2000DPPE:DiIC18. 10% PS liposomes were composed of 10:87:2:1 POPS:POPC:PEG2000DPPE:DiIC18. Kd was determined by fitting the titration isotherms in Figure 1 to a 1:1 binding model.
A separate set of titration experiments compared the ability of probe 1 and PSVue643 to associate with liposomes containing 20% PS, a composition that ensured an accurate affinity comparison. As represented in Figure S2, both probes exhibited very similar Kd values of about 1 μM. Overall, the relative probe affinities for PS-rich membranes are in the order: 2 > PSVue643 ~ 1.
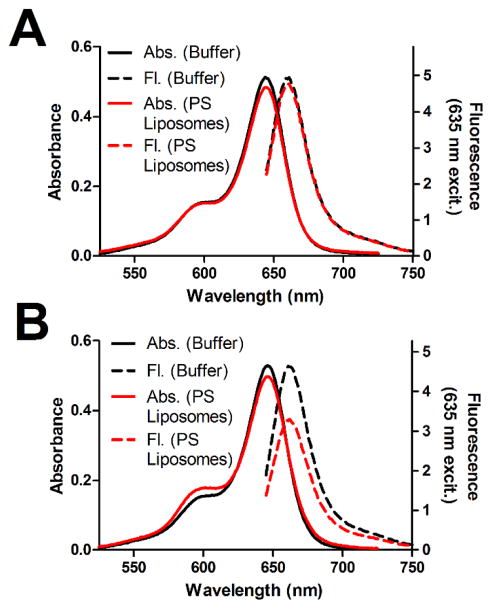
Additional titration experiments revealed an unusual feature with fluorescent probe 2, namely its propensity to self-quench on the surface of PS-rich membranes. The plot in Figure 2A shows that the absorbance and emission spectra of monovalent probe 1 are nearly the same in the presence or absence of unlabeled 20% PS liposomes. In contrast, bivalent probe 2 exhibited absorption band broadening and attenuated fluorescence emission when mixed with 20% PS liposomes (Figure 2B). A titration study (Figure S3) showed that the fluorescence attenuation increased with the amount of probe 2 on the liposome surface. The effect is attributed to self-quenching of 2 on the surface of the PS-rich liposomes due to the close proximity of multiple bound fluorophores. This occurs more with probe 2 because it binds more strongly than probe 1. The phenomenon is similar to the self-quenching of sulfonated Cy5 fluorophores that is observed when multiple copies are attached to a peptide34 or protein.35
Figure 2.
Absorption broadening and fluorescence self-quenching of 2 upon binding to PS-rich membranes. Probe 1 (A) and 2 (B) (3 μM) were added to 20% PS liposomes (20:2:88 POPS:PEG2000DPPE:POPC, 50 μM total lipid) or buffer alone, and absorbance and fluorescence spectra were acquired. Measurements were made in HEPES buffer (10 mM, 137 mM NaCl, 3.2 mM KCl, pH 7.4) at 25°C with λex = 635 nm.
Previous studies have shown that lipophilic Zn2TyrBDPA derivatives can form organic-soluble complexes with fatty acids27 and phosphorylated molecules,36 thus it was of interest to evaluate the octanol:water partitioning behavior of the new fluorescent probes. The presence of anionic POPS was found to increase probe log P and promote transfer of probes 1 and 2 from aqueous buffer solution into an octanol layer (Figure 3). Other anionic amphiphiles such as laurate and phosphatidylglycerol (POPG) also weakly promoted partitioning of the two Zn2TyrBDPA probes (Figure S4). In comparison, the presence of anionic amphiphiles hardly promoted transfer of the more hydrophilic PSVue643 into octanol under the same conditions. As expected, the presence of zwitterionic POPC had no effect on octanol partitioning for any of the three probes. Taken together the probe association studies show that Zn2TyrBDPA probes 1 and 2 selectively associate with anionic PS-rich membranes and form lipophilic complexes.
Figure 3.
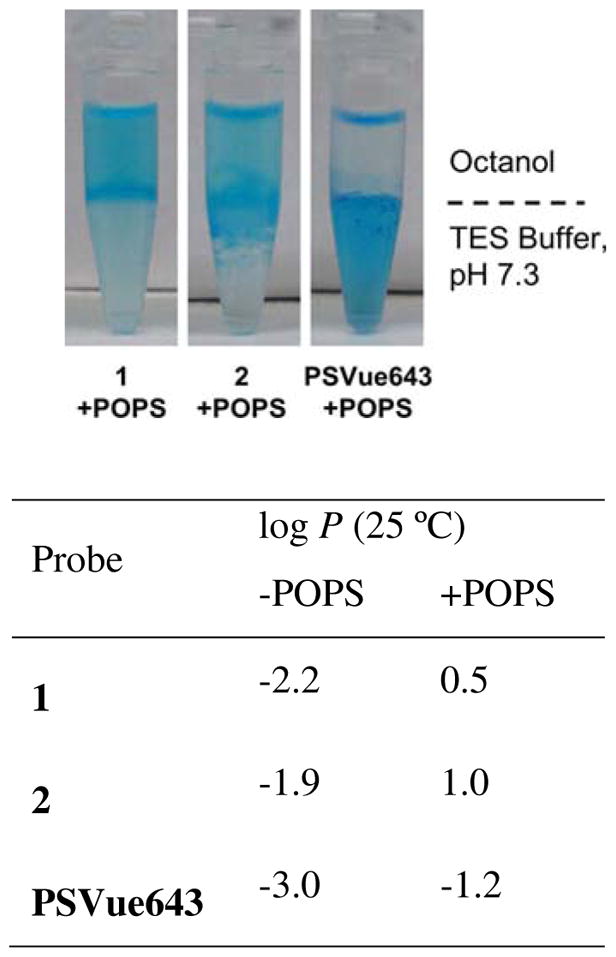
Effect of POPS on the octanol-water partitioning of fluorescent probes at 25 °C. (top) Color photographs of probes (10 μM) partitioned between octanol and TES buffer (5 mM TES, 140 mM NaCl, pH 7.3) containing 50 μM POPS. (bottom) The partition ratio (log P) values for each probe (10 μM) with or without POPS (50 μM).
Fluorescence microscopy of dead and dying cells
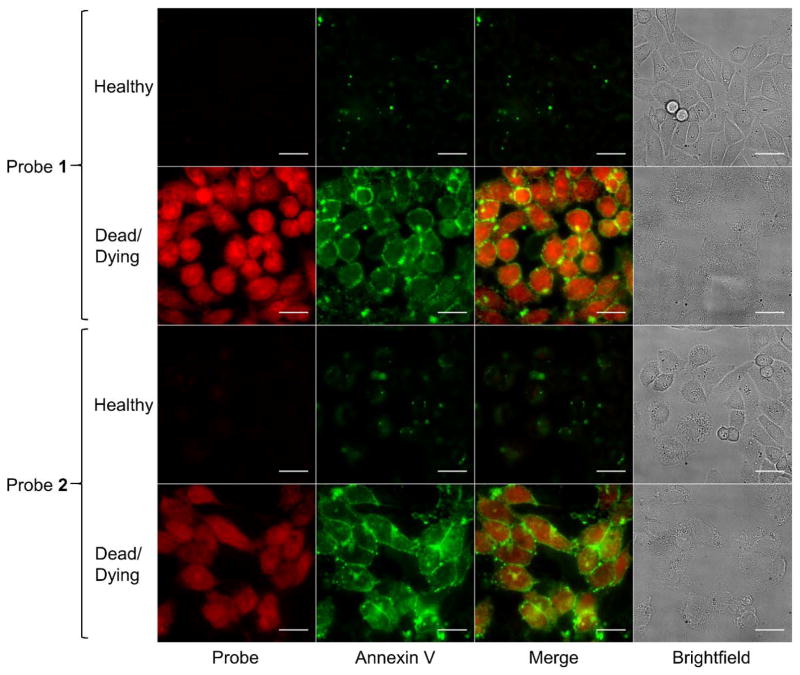
Cell viability assays using cultured Chinese Hamster Ovary (CHO-K1) cells showed that probes 1 and 2 are not toxic to animal cells at concentrations below 25 μM (Figure S5). This is well below the concentration required for imaging studies and the low toxicity is consistent with values reported for Zn2BDPA probes in previous studies.25–26, 37 Probe staining of dead and dying mammalian cells was assessed using fluorescence microscopy and flow cytometry. The cells were also treated with the PS-binding protein Annexin V (covalently labeled with the green fluorescent dye, AlexaFluor488 dye) which is known to highlight the plasma membrane of dead and dying cells.38 Cell death was induced by incubation with camptothecin, a topoisomerase I inhibitor, for 6 hours.39 A separate population of healthy cells was left in growth media as a control. After drug treatment, both populations were incubated with a binary admixture of probe 1 or 2, and Annexin V-AlexaFluor488 before a wash step and two-color fluorescence imaging on an epifluorescence microscope. Figure 4 shows very little probe staining of healthy CHO-K1 cells but strong staining of dead and dying cells that had been treated with the camptothecin. Costaining with Annexin V-AlexaFluor488 showed the same selectivity for dead and dying cells, but there was a substantial difference in the cell staining patterns. As expected, the green emission of the Annexin V-AlexaFluor488 was clearly localized on the plasma membrane surface, whereas the red emission of probes 1 and 2 was diffused throughout the cell with both cytosolic and nuclear accumulation (Figures 4 and S6). Many of the dead and dying cell images with probes 1 and 2 showed punctate regions of high fluorescence intensity in the nucleus that were reminiscent of the nucleolus staining observed with RNA targeting probes.40–41 Similar cell staining patterns with probe 1 were observed using dead and dying MDA-MB-231 breast cancer cells that had been treated with the drug etoposide (Figure S7).
Figure 4.
Fluorescence micrographs of healthy or dead and dying CHO-K1 cells stained with Annexin V-AlexaFluor488 and 5 μM of either 1 (top two rows) or 2 (bottom two rows) (Cy5 = red; Annexin V-AlexaFluor488 = green; Bright field = gray). The dead and dying cells were treated with camptothecin (15 μM) for 6 h, then incubated with 5 μM of either probe for 15 min at 37 °C and washed with HEPES buffer. Scale bar = 25 μm.
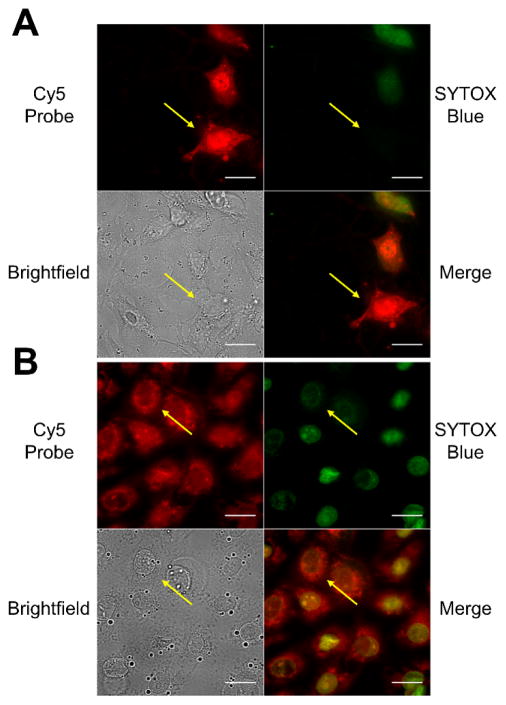
Additional fluorescence microscopy experiments were carried out using the blue-emitting nucleic acid stain SYTOX Blue, a membrane impermeable dye that only stains necrotic cells with compromised plasma membranes. After treatment with camptothecin to induce cell death, the cells were incubated with a binary mixture of SYTOX Blue and probe 1 or 2. Figure 5 shows that probes 1 (panel A) or 2 (panel B) stain both apoptotic cells (SYTOX Blue negative, yellow arrow) and necrotic cells (SYTOX Blue positive).
Figure 5.
Fluorescence micrographs of dead and dying CHO-K1 cells stained with 1 μM nucleic acid stain SYTOX Blue and 5 μM of either 1 (A) or 2 (B). The yellow arrows point to a cell in each field of view that is apoptotic. Intense green fluorescence indicates necrotic/late apoptotic cells. (Cy5 = red; SYTOX Blue = green; Bright field = gray). The cells were treated with camptothecin (15 μM) for 18 hr, then incubated with 5 μM of either probe for 15 min and washed with HEPES buffer. Scale bar = 25 μm.
Flow cytometry was used to verify the discrimination of dead/dying CHO-K1 cells from healthy cells within a large population (~10,000 cells). Figure S8 contains four separate histogram plots of CHO-K1 cells stained with no dye, CyAL-5 control dye, probe 1, and probe 2. The plots show that 1 or 2 can readily quantify the fraction of etoposide-treated cells that are dead/dying. The CyAL-5 control dye is not able to readily distinguish dead/dying cells from healthy cells.
There are two major findings from the cell imaging. One is the selective cell permeation ability of Zn2TyrBDPA probes 1 and 2. Not only can they selectively target dead and dying cells over healthy cells, they both can enter the cytoplasm of apoptotic cells, which is in contrast to the cell surface binding exhibited by Annexin V-AlexaFluor488. Our previous studies of Zn2BDPA probes such as PSVue643 have observed modest probe penetration into the cytosol of apoptotic cells25, but the effect is much stronger with Zn2TyrBDPA probes 1 and 2. We propose that the Zn2TyrBDPA probes form more lipophilic complexes with the anionic PS on the surface of the apoptotic cells, and the probe-PS complexes diffuse through the membrane. The process is analogous to the mechanism for plasma membrane permeation by guanidinium-rich molecules mediated by fatty acids.42 Once in the cytosol, the probes can associate with other polyanionic species such as oligonucleotides and it appears that monovalent 1 accumulates more in the cell nucleus than bivalent 2. The second notable finding from the cell imaging is more intense staining of dead and dying cells by monovalent 1 compared to bivalent 2. This difference in image intensity is consistent with the liposome studies which indicated binding-induced self-quenching of probe 2 on the PS-rich membrane surface. It appears that the higher affinity of probe 2 promotes increased localization of multiple probe molecules to adjacent sites on the target membranes which promotes fluorophore self-quenching.
In vivo targeting of cell death
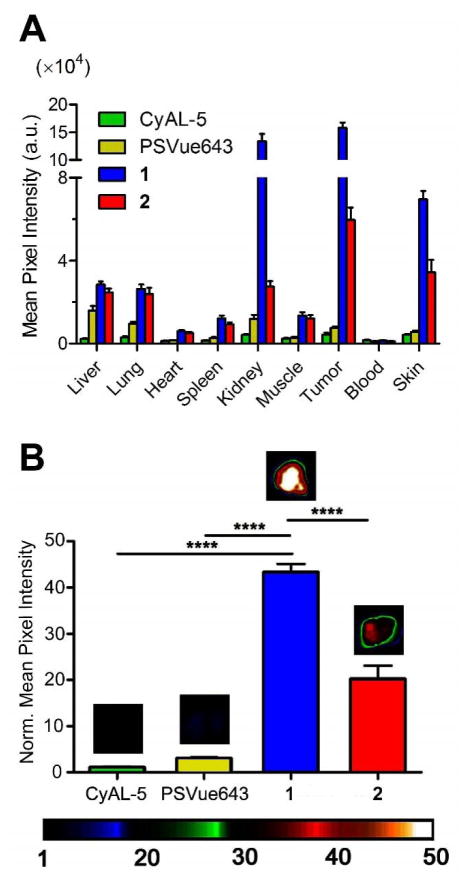
The in vivo biodistribution and cell death targeting abilities of the three fluorescent probes were compared in a well-established rat subcutaneous tumor model that is known to develop foci of necrotic cell death in the tumor core.37 Previous studies have used this model to evaluate cell death imaging performance of fluorescent Zn2BDPA probes.21, 25, 37 The subcutaneous tumors were prepared by injecting PAIII prostate cancer cells into the right flank of each animal and allowing 14 days for tumor growth. Each cohort was given a tail vein injection of one of the fluorescent probes (150 nmol) in water containing 1% DMSO. The animals were euthanized 24 hours after probe injection and biodistributions were determined by imaging the excised organs using a planar fluorescence imaging station with a deep-red filter set (λex = 630 nm, λem = 670 nm). The 24 h biodistribution graphs in Figure 6A show that the untargeted CyAL-5 dye was mostly cleared from the body. In comparison, there was higher tissue retention of the targeted Zn2BDPA probes. Most notably, both Zn2TyrBDPA probes produced significantly higher tumor targeting than PSVue643. In particular, monomeric probe 1 provided more than 10-fold higher fluorescence in the tumor than PSVue643 (Figure 6B, see also Figure S9). The order of probe accumulation in the rat tumors was 1 > 2 ≫ PSVue643 > CyAL-5. Microscopic imaging of thin histological tumor slices confirmed that the deep-red fluorescence of probes 1 and 2 co-localized with the tumor’s necrotic regions (Figure S10).
Figure 6.
Probe localization in a Lobund-Wistar rat subcutaneous prostate tumor model of cell death 24 h after probe injection. (A) Fluorescence biodistribution from excised organs. (B) Mean pixel intensities of excised tumors (normalized to CyAL-5 mean pixel intensity) showing high relative accumulation of Zn2TyrBDPAs. Error bars are standard error of the mean. N = 4, 4, 10, 6 for CyAL-5, PSVue643, 1, and 2, respectively. ****P ≤ 0.0001 Each cohort was given a tail vein injection of fluorescent probe (150 nmol) in water (1 % DMSO). The animals were euthanized 24 h later and biodistributions were determined by imaging the excised tissues using a planar fluorescence imaging station with a deep-red filter set (λex = 630 nm, λem = 700 nm).
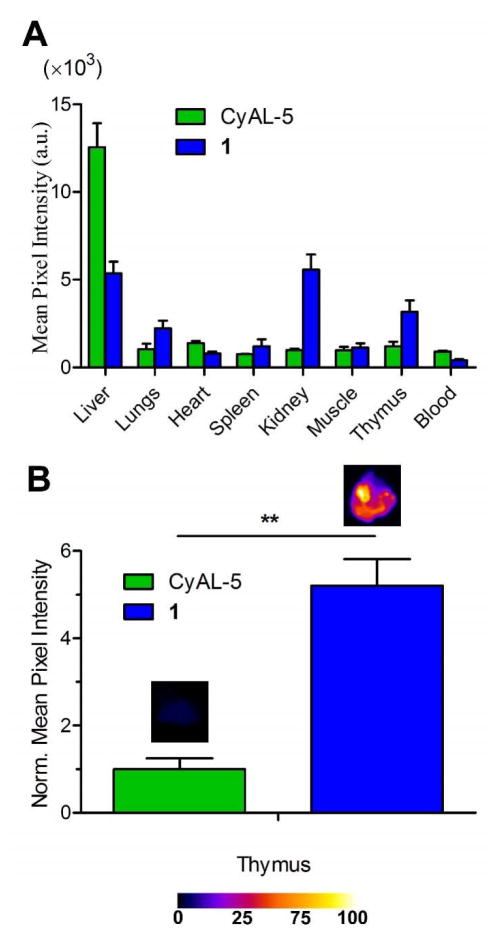
Monovalent fluorescent probe 1 was further investigated in a second animal model of cell death. The study treated two cohorts of immunocompetent SKH1 mice with intraperitoneal injections of dexamethasone (50 mg/kg) to induce extensive thymocyte cell death and thymus atrophy through caspase-mediated apoptosis.43 After 24 h, the mice were given tail vein injections of probe 1 or CyAL-5 (10 nmol in water) and 3 h later the animals were euthanized. Probe biodistributions were determined by imaging the excised organs using a planar fluorescence imaging station with a deep-red filter set. The biodistribution graphs in Figure 7A show that the untargeted CyAL-5 dye accumulated primarily in the liver. In contrast, probe 1 was retained in the liver and kidneys. A comparison of deep-red fluorescence in the atrophied thymi (Figure 7B) indicated a 5-fold higher accumulation of probe 1 than untargeted CyAL-5. A control study that compared the biodistribution of probe 1 in mice that were pretreated with an intraperitoneal injection of saline rather than dexamethasone showed 3.5-fold lower uptake of probe in the thymi (Figure S12). Taken together these results confirm the important role of the Zn2TyrBDPA unit for in vivo targeting of cell death.
Figure 7.
Probe 1 localization in a thymus atrophy model of cell death in immunocompetent mice. (A) Biodistribution of probe 1 (blue) and untargeted CyAL-5 dye (green) in excised organs taken from mouse cohorts 3 h after intravenous injection of probe. Dexamethasone dosage was performed 24 h prior to probe injection. (B) Mean pixel intensities for probe fluorescence in the excised thymi. Error bars are the standard error of the mean. N = 3 for both cohorts. P values ≤ 0.01 (*), ≤ 0.001 (**) or ≤ 0.0001 (***) are considered statistically significant. SKH1 mice were given intraperitoneal injections of dexamethasone at a dose of 50 mg/kg. After 24 h, the imaging probe (10 nmol) was injected via the tail vain, and after 3 h mice were sacrificed and organs were imaged using a planar fluorescence imaging station.
An unusual feature of Zn2TyrBDPA probe 1 in both animal models (tumor bearing rats in Figure 6A and healthy SKH1 mice in Figure S13) is a long probe residence time in the kidneys. Haematoxylin/eosin staining of kidney histology slices from probe-treated rats did not show any abnormalities (Figure S11), suggesting that the kidney retention was not due to probe-induced cell death. A similar kidney retention effect has been observed with Annexin V,44–45 where there is histological evidence that Annexin V localizes to the distal tubular cells in healthy kidneys,46–47 due to relatively high levels of PS in the cortical regions of the kidney.48
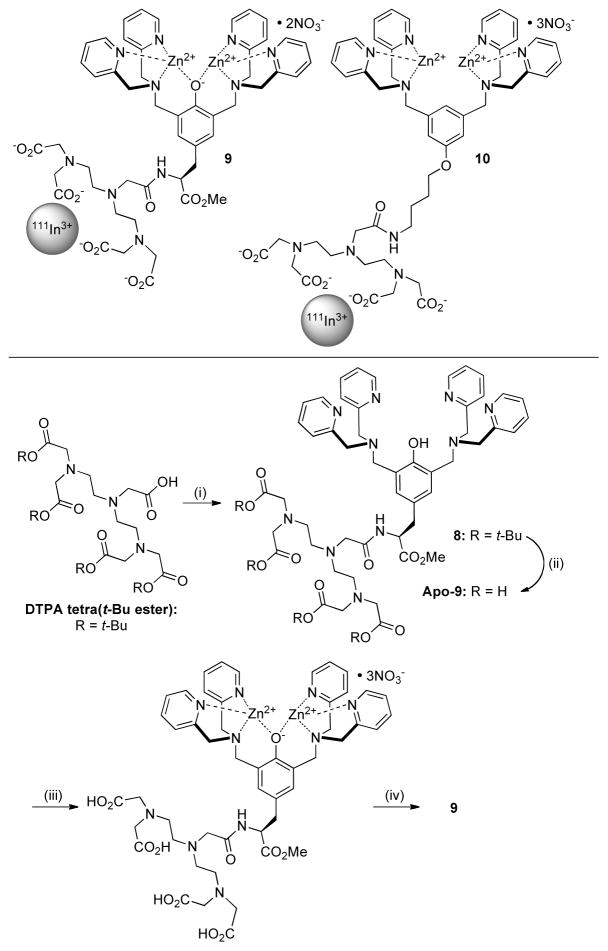
The favorable biodistribution profile of fluorescent probe 1 prompted us to conduct a comparative study of two radiotracer probes, 9 and 10 (Scheme 4). In a previous study, we prepared the Zn2BDPA probe 10 and showed that a radioactive 111In(III) cation is selectively chelated by the attached diethylene triamine pentaacetic acid (DTPA), leaving the BDPA open for subsequent zinc coordination.49 The same synthetic method was used to make the Zn2TyrBDPA probe 9 with >98% radiopurity (Figure S14). The probe exhibited high radiochemical stability. For example, incubation of the probe in serum produced virtually no transfer of radioactive 111In cation to the serum proteins after 3 h and only 35% transfer after 24 h (Figure S15). During this period, there were no major changes in the HPLC chromatogram for the probe.
Scheme 4.
Radiolabeled probes 9 and 10
Conditions: (i) DSC, NEt3, DMF, rt, 5 h; 4, rt, 15 h, 23%; (ii) TFA, DCM, rt, 15 h, 99%; (iii) Zn(NO3)2, MeOH, rt, 20 min; (iv) 111InCl3, HCl, acetate buffer, pH 6, 50 °C, 1 h, 98%.
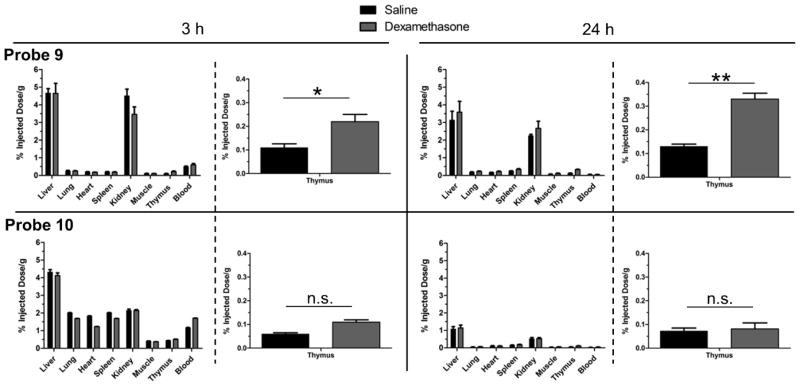
The biodistributions of radiotracers 9 and 10 were determined using the mouse thymus atrophy model described above. Each tracer was tested in cohorts of healthy CD-1 mice (n=4) given either an intraperitoneal dose of dexamethasone (50 mg/kg) or an equal volume of saline. Twenty-four hours later, both cohorts were dosed intravenously with radiotracer 9 or 10. Cohorts were sacrificed after 3 h and 24 h, followed by organ removal, weighing, and radioactivity counting. Figure 8 presents the biodistribution results as percent injected dose per gram (%ID/g) for each organ and reveals two notable biodistribution differences between the tracers. The first is the cleaner biodistribution of 9, compared to 10, with much less short-term accumulation in the non-clearance organs at 3 h. The second difference is the increased targeting of probe 9, compared to 10, for atrophied thymus tissue. The relative amount of probe 9 in the thymus at 3 h was ~2 fold greater in the dexamethasone-treated cohort compared to the saline-treated cohort and this rose to ~3 fold greater at 24 h. In contrast, there was no significant difference in thymus accumulation for probe 10 at either time point. Overall, the cell death targeting abilities of nuclear probe 9 and analogous fluorescent version 1 are quite similar in the mouse thymus atrophy model, with relatively high targeting of atrophied thymus tissue and low off-target accumulation in non-clearance organs. Probe 9 warrants further study as an imaging radiotracer in other biomedically relevant models of cell death. Together, the in vivo biodistribution results indicate that the Zn2TyrBDPA scaffold is a promising molecular candidate for further development as a clinically useful cell death imaging agent in living subjects. Previous imaging studies have evaluated Zn2BDPA probes with 18F or 99mTc radiolabels with limited results and Zn2TyrBDPA analogues may be better suited for imaging with these relatively short-lived isotopes.50,51
Figure 8.
Biodistribution of 9 (top) and 10 (bottom) in organs from CD-1 mice treated with dexamethasone (grey) or saline (black). Values are mean percent injected dose per gram of tissue (%ID/g) with error bars showing standard deviation from the mean (n=4).
Conclusions
Two new deep-red fluorescent probes containing a phenoxide-bridged Zn2TyrBDPA scaffold were evaluated for targeting PS-rich membranes and imaging cell death in cell and animal models. Studies using liposomes showed that the bivalent probe 2 has higher affinity for PS-rich membranes compared to the monovalent probe 1, but 2 exhibits fluorescence self-quenching at the membrane surface, a feature that was also apparent in cell imaging experiments. Both probes selectively stained dead and dying cultured mammalian cells, and in live animal models, both probes accumulated in dead and dying tissue. In contrast to the cell surface targeting of the protein probe Annexin V-AlexaFluor488, the Zn2TyrBDPA probes 1 and 2 enter the cytoplasm of apoptotic cells, most likely due to their ability to form lipophilic complexes with the PS that is exposed on the apoptotic cell surface. The in vivo biodistributions of fluorescent probe 1 and the analogous, radioactive 111In-labelled version 9 are quite similar, with relatively high targeting of dead and dying tissue and low off-target accumulation in the non-clearance organs. Fluorescent probe 1 should be immediately useful for preclinical studies that evaluate therapeutic response in small animal models of cancer,52 and the radiotracer version 9 is a promising candidate for further development as a nuclear probe for clinical imaging of cell death.
Experimental
Materials
Unless indicated otherwise, organic reagents and solvents were used as provided by Sigma-Aldrich. NMR solvents were obtained from Cambridge Isotope Labs and NMR spectra were obtained at room temperature on either a Varian DirectDrive 600-MHz spectrometer or a Bruker AVANCE III HD 500-MHz spectrometer. Culture media, bovine serum albumin (BSA), and buffers were purchased from Sigma-Aldrich. MDA-MB-231 (ATCC: HTB-26) and CHO-K1 (ATCC: CCL-61) cells were certified and obtained from the ATCC. POPC (1-palmitoyl-2-oleoyl-sn-glycero-3-phosphocholine), POPS (1-palmitoyl-2-oleoyl-sn-glycero-3-phosphoserine), and PEG2000-DSPE (1,2-distearoyl-sn-glycero-3-phosphoethanolamine-N-[methoxy(polyethylene glycol)-2000] (ammonium salt)) were purchased from Avanti Polar Lipids and stored in CHCl3 at −20 °C. DilC18 (1,1′-dioctadecyl-3,3,3′,3′-tetramethylindocarbocyanine perchlorate) was purchased from Invitrogen Inc. Annexin V AlexaFluor488 and SYTOX Blue probes were purchased from Life Technologies and used following the manufacturer’s directions. CyAL-5 was purchased from Molecular Targeting Technologies, Inc. and DTPA-tetra (t-Bu ester) was purchased from Macrocyclics, Inc.
Synthesis of Apo-1
Compound 3 was prepared and deprotected using published procedures to form free amine 4.27, 30 CyAl-5 (10.5 mg, 15 μmol) and DSC (26.4 mg, 0.10 mmol) were dissolved in 250 μL DMF. Triethylamine (35 μL) was added and the mixture was stirred at room temperature for 23 h under a nitrogen atmosphere. Free amine 4 (16.8 mg, 27 μmol) was added as a solution in 200 μL DMF and the mixture was stirred for an additional 65 h. Crude reaction mixture was loaded onto a prepacked C18 column (Agilent Bond Elut, 10 g) and product was eluted in 30% CH3CN/H2O (+ 0.1% TFA) and lyophilized to give 13.0 mg (50%) of Apo-1•~4TFA as a deep blue powder. 1H NMR (600 MHz, CD3OD): δ ppm 8.58 – 8.62 (m, 4 H), 8.09 (d, J=14.1 Hz, 2 H), 7.87 – 7.92 (m, 8 H), 7.46 – 7.49 (m, 8 H), 7.32 (d, J=8.5 Hz, 2 H), 7.01 (s, 2 H), 6.24 (d, J=15.3 Hz, 2 H), 4.51 (t, J=7.6 Hz, 1 H), 4.49 – 4.53 (m, 1 H), 4.29 (s, 8 H), 4.19 (q, J=7.0 Hz, 4 H), 4.10 (s, 4 H), 3.42 (s, 3 H), 2.90 (dd, J=14.1, 7.9 Hz, 1 H), 2.77 (dd, J=13.8, 7.6 Hz, 1 H), 2.66 – 2.70 (m, 2 H), 2.16 – 2.29 (m, 2 H), 1.71 – 1.75 (m, 14 H), 1.52 – 1.60 (m, 2 H), 1.37 (t, J=7.3 Hz, 6 H). 13C NMR (151 MHz, CD3OD) δ ppm 175.9, 175.1, 173.4, 161.7, 156.6, 154.5, 148.7, 144.6, 143.7, 142.9, 141.0, 135.7, 134.6, 129.7, 128.2, 125.9, 125.6, 125.5, 121.8, 121.6, 120.0, 118.5, 111.5, 101.5, 58.7, 56.9, 55.7, 52.7, 50.8, 40.5, 37.9, 29.3, 27.8, 27.3, 12.7. HRMS (ESI-TOF): [M + 2H]2+ calculated m/z for C70H81N9O10S2: 635.7768; found 635.7774.
Synthesis of Apo-2
Compound 5
Amine 4 (217 mg, 0.35 mmol), N-Boc-Gly-OH (75 mg, 0.43 mmol), EDC (Alfa Aesar) (107 mg, 0.56 mmol), and HOBT (82 mg, 0.54 mmol) were dissolved in 7 mL DMF and 0.30 mL of Hünig’s base was added. The reaction was stirred at room temperature for 6 h and solvent was evaporated in vacuo. Product was extracted from 15 mL water with ethyl acetate (3 × 15 mL). Combined organic layers were washed with 5% NaHCO3 followed by brine then dried over Na2SO4 and the solvent was removed. The crude material was purified by column chromatography (silica, 3–5% MeOH/CHCl3 with 0.2% NH4OH) to give 204 mg (75%) of 5 as a viscous oil. 1H NMR (500 MHz, CDCl3): δ ppm 11.02 (br. s, 1 H), 8.52 (d, J=4.4 Hz, 4 H), 7.61 (td, J=7.7, 1.7 Hz, 4 H), 7.46 (d, J=7.8 Hz, 4 H), 7.08 – 7.17 (m, 4 H), 7.00 – 7.07 (m, 1 H), 6.90 (br. s., 2 H), 6.27 (br. s., 1 H), 4.75 – 4.83 (m, 1 H), 3.68 – 4.04 (m, 14 H), 3.65 (s, 3 H), 2.93 – 3.12 (m, 2 H), 1.35 (s, 9 H). 13C NMR (126 MHz, CDCl3): δ ppm 172.0, 169.7, 165.4, 156.4, 155.4, 149.1, 136.9, 130.7, 124.0, 123.3, 122.3, 79.9, 59.9, 54.9, 53.5, 52.4, 44.4, 37.0, 28.5. HRMS (ESI-TOF): [M + H]+ calculated m/z for C43H51N8O6: 775.3926; found 775.3933.
Compound 7
N-Boc 5 (140 mg, 0.18 mmol) was dissolved in 1 mL DCM and chilled on ice. TFA (1 mL) was added dropwise and mixture was stirred at room temperature for 2 h then evaporated to dryness in vacuo. The residue was dissolved in 10 mL, neutralized with NH4OH, and extracted with DCM (2 × 12 mL). The combined organic layers were washed with brine, dried over sodium sulfate, and solvent was evaporated to give 79 mg (65%) of the deprotected free amine version of 5 as an opaque oil. 1H NMR (500 MHz, CDCl3): δ ppm 8.52 (d, J=5.9 Hz, 4 H), 7.69 (d, J=8.1 Hz, 1 H), 7.61 (tq, J=7.8, 2.0 Hz, 4 H), 7.47 (d, J=8.1 Hz, 4 H), 7.11 – 7.15 (m, 4 H), 6.97 (s, 2 H), 4.77 – 4.83 (m, 1 H), 3.83 – 3.87 (m, 8 H), 3.65 (s, 2 H), 3.77 (s, 4 H), 3.12 – 3.30 (m, 2 H), 3.04 (d, J=5.9 Hz, 1 H). This free amine (79 mg, 0.12 mmol), acid 630 (93 mg, 0.13 mmol), EDC (35 mg, 0.18 mmol), and HOBT (28 mg, 0.18 mmol) were dissolved in 4 mL DMF and 0.10 mL of Hünig’s base was added. The reaction was stirred at room temperature for 22 h. Product was extracted from 100 mL water with three portions of ethyl acetate. Combined organic layers were washed with brine then dried over Na2SO4 and the solvent was removed. The crude material was purified by column chromatography (silica, 3–5% MeOH/CHCl3 with 0.4% NH4OH) to give 59 mg (37%) of 8 as a viscous oil. 1H NMR (500 MHz, CDCl3): δ ppm 11.03 (br. s., 1 H), 10.98 (br. s., 1 H), 8.52 (d, J=4.4 Hz, 4 H), 8.48 (d, J=4.1 Hz, 4 H), 7.89 – 7.96 (m, 1 H), 7.56 – 7.61 (m, 8 H), 7.42 – 7.47 (m, 8 H), 7.32 (d, J=7.3 Hz, 1 H), 7.07 – 7.13 (m, 8 H), 7.00 (s, 2 H), 6.95 (s, 2 H), 5.41 – 5.46 (m, 1 H), 4.67 (s, 1 H), 4.33 (br. s, 1 H), 3.74 (s, 4 H), 3.88 – 3.95 (m, 2 H), 3.78 – 3.87 (m, 20 H), 3.70 (s, 1 H), 3.67 (s, 1 H), 3.51 (br. s., 3 H), 2.90 – 3.01 (m, 4 H), 1.25 (s, 9 H). 13C NMR (151 MHz, CDCl3) δ ppm 172.3, 171.8, 168.7, 159.0, 155.6, 154.9, 148.8, 136.6, 130.2, 123.8, 123.2, 122.1, 79.7, 59.6, 56.3, 54.7, 54.6, 53.9, 52.0, 42.6, 37.3, 36.9, 28.2. HRMS (ESI-TOF): [M + 2]+ calculated m/z for C78H86N15O8: 1360.6778; found 1360.6823.
Compound Apo-2
Compound 7 (58 mg, 43 μmol) was deprotected using the procedure given for deprotection of 5. The free amine was further purified by column chromatography (Silica, 3–10% MeOH/DCM) to give 9 (25.7 mg, 50%) as a yellow oil. 1H NMR (500 MHz, CDCl3) δ ppm 10.87 – 11.13 (m, 2 H), 8.48 – 8.52 (m, 8 H), 7.56 – 7.61 (m, 8 H), 7.41 – 7.47 (m, 8 H), 7.10 (dt, J=7.5, 3.9 Hz, 8 H), 6.96 (s, 2 H), 3.79 – 3.88 (m, 22 H), 3.72 – 3.79 (m, 8 H), 3.63 (s, 3 H),3.45 – 3.57 (m, 2 H), 3.11 (dd, J=7.01 (s, 2 H), 13.8, 3.8 Hz, 1 H), 3.02 (d, J=4.2 Hz, 2 H). HRMS (ESI-TOF): [M + H]+ calculated m/z for C73H78N15O6: 1260.6254; found 1260.6236. CyAl-5 (5.3 mg, 7.7 μmol) and DSC (14.1 mg, 55 μmol) were dissolved in 100 μL DMF. 18 μL triethylamine was added and the mixture was stirred at room temperature for 23 h under a nitrogen atmosphere. The deprotected amine from above (14.7 mg, 12 μmol) was added as a solution in 200 μL DMF and the mixture was stirred for an additional 51 h. Crude reaction mixture was loaded onto a prepacked C18 column (Agilent Bond Elut, 10 g) and product was eluted in 5:4:1 MeOH:H2O:CH3CN (+ 0.1% TFA) and lyophilized to give 6.8 mg (33%) of Apo-2•~8TFA as a deep blue powder. 1H NMR (600 MHz, CD3OD) δ ppm 8.57 – 8.63 (m, 8 H), 8.04 (d, J=14.1 Hz, 2 H), 7.84 – 7.92 (m, 12 H), 7.41 – 7.51 (m, 16 H), 7.29 (d, J=9.1 Hz, 2 H), 7.08 (s, 2 H), 7.06 (s, 2 H), 6.21 (d, J=13.8 Hz, 2 H), 4.41 (t, J=7.6 Hz, 1 H), 4.46 (t, J=5.3 Hz, 1 H), 4.33 (s, 8 H), 4.27 (s, 8 H), 4.07 – 4.18 (m, 12 H), 3.67 (d, J=17.0 Hz, 1 H), 3.59 (s, 3 H), 3.55 (d, J=17.3 Hz, 1 H), 2.98 (dd, J=14.7, 7.0 Hz, 1 H), 2.93 (dd, J=13.8, 6.2 Hz, 1 H), 2.86 (dd, J=13.2, 8.8 Hz, 1 H), 2.74 (dd, J=14.1, 7.6 Hz, 1 H), 2.63 – 2.68 (m, 2 H), 2.12 – 2.25 (m, 2 H), 1.62 – 1.70 (m, 14 H), 1.51 – 1.58 (m, 2 H), 1.32 (t, J=7.3 Hz, 6 H). 13C NMR (151 MHz, CD3OD) 175.8, 175.0, 174.1, 173.2, 171.2, 161.0, 160.7, 160.5, 160.2, 156.4, 154.5, 154.4, 147.7, 144.6, 143.9, 142.9, 142.5, 142.2, 135.0, 130.3, 130.1, 128.3, 126.4, 126.0, 122.0, 121.5, 119.9, 118.0, 116.1, 114.2, 111.6, 101.6, 58.6, 58.5, 56.8, 55.9, 53.0, 50.7, 43.2, 40.5, 40.5, 38.1, 37.3, 36.8, 29.4, 27.8, 27.0. HRMS (ESI-TOF): [M + 2H]2+ calculated m/z for C107H119N17O13S2: 957.4319; found 957.4394.
Compound 8
DTPA-tetra (t-Bu ester) (28 mg, 0.045 mmol) and 15 mg (0.059 mmol) of disuccinimidyl carbonate were dissolved in 0.55 mL DMF. Triethylamine (25 μL, 0.18 mmol) was added and the mixture was mixed at room temperature for 5 h before the addition of 31 mg (0.050 mmol) of amine 4 in 0.3 mL DMF. The solution was mixed at room temperature for an additional 15 h, and solvent was evaporated under high vacuum. The residue was purified via column chromatography (aluminum oxide, 98:2:0.1 chloroform:methanol:NH4OH) to give 12.3 mg (23%) of 8 as a colorless film. 1H NMR (500 MHz, CDCl3) δ ppm 10.98 (s, 1 H), 8.51 (d, J=4.2 Hz, 4 H), 8.12 (m, 1 H), 7.60 (m, 4 H), 7.49 (d, J=7.8 Hz, 4 H), 7.11 (m, 4 H), 7.05 (s, 2 H), 4.70 (m, 1 H), 3.85 (s, 8 H), 3.77 (s, 4 H), 3.41 (s, 3 H), 3.38 (s, 8 H), 3.15 (m, 2 H), 2.99 (m, 2 H), 2.77 (d, J=7.1 Hz, 4 H), 2.64 (br. s., 4 H), 1.42 (s, 36 H). HRMS (ESI-TOF): [M + H]+ calculated m/z for C66H93N10O12: 1217.6969; found 1217.6987.
Compound Apo-9
tert-Butyl ester protected 8 (12.8 mg, 0.011 mmol) was dissolved in a mixture of 0.50 mL dichloromethane and 0.30 mL trifluoroacetic acid and mixed at room temperature for 15 h. The solvent was evaporated and residue was washed with diethyl ether (2 × 2 mL) to give 18.3 mg of Apo-9 (99% as the hexa-trifluoroacetate salt). 1H NMR (500 MHz, CD3OD) d ppm 8.66 (dd, J=5.1, 0.7 Hz, 4 H), 8.00 (td, J=7.8, 1.6 Hz, 4 H), 7.55 (m, 8 H), 7.11 (s, 2 H), 4.66 (m, 1 H), 4.42 (s, 1 H), 4.36 (s, 8 H), 4.31 (s, 1 H), 4.15 (d, J=3.9 Hz, 4 H), 3.69 (s, 3 H), 3.59 (s, 8 H), 3.37 (d, J=3.9 Hz, 4 H), 3.15 (t, J=5.4 Hz, 4 H), 3.06 (m, 1 H), 2.89 (m, 1 H). HRMS (ESI-TOF): [M + H]+ calculated m/z for C50H61N10O12: 993.4465; found 993.4478.
Zinc(II) Complexation
A solution of apo-probe in methanol (~2 mM) was mixed for >20 min with a methanol solution of Zn(NO3)2 (2.2 molar equivalents per TyrDPA unit). The solvent was evaporated and the residue was prepared as an aqueous stock solution for liposome and cell studies.
Radiolabeling studies
Preparation of 111In chelates 9 and 10
Approximately 50 μCi/μL of InCl3 dissolved in 0.05 M HCl (purchased from Perkin Elmer) was mixed with 0.6 μL of sodium acetate (0.5 M; pH 5.7) in the bottom of a 5 ml test tube and aspirated 2–3 times followed by a short incubation. The solution was then mixed with the precursor Zn2BDPA-DTPA or Zn2TyrBDPA-DTPA conjugate in sodium acetate (0.1 M; pH 6.1) and incubated for 1 h at 50°C to give 9 or 10, respectively. The specific activity of each tracer for was kept close to 3 μCi/μg. The radiochemical purity was determined using reverse-phase HPLC system equipped with a 515 pump, an in-line dual UV/radioactivity detector under the control of Millennium 32 software (Waters, Milford, MA). A Jupiter C18 column (90 Å pore size, 250mm × 4.6 mm) was employed with a buffered mobile phase system consisting of Mobile Phase A (99% water, 1% TFA, pH 6.7) and Mobile Phase B (99% acetonitrile, 1% TFA) at a flow rate of 1.0 mL/min at room temperature. A baseline of 5 minutes at 90% Mobile Phase A and 10% Mobile Phase B was followed by a linear gradient to 10% Mobile Phase A and 90% Mobile Phase B in 30 minutes. The level of radioactivity in the HPLC elute was monitored by the in-line radioactivity detector and the percent 111In for each peak was calculated from the integrated area.
Serum stability of 111In complex 9
An aliquot of 9 (~3 μg) was mixed with 2 mL of warmed human serum (~40 g/L, 37 °C) in a glass vial containing a stir bar (N = 3). The vials were then submerged in a water bath heated to 37 °C and stirred constantly. After 0.1, 3 and 24 h incubation periods, 100 μL samples were removed and injected onto a Superdex Peptide HR 10/30 size exclusion column (1.0 × 30 cm) (Pharmacia Biotech; Uppsala, Sweden) and eluted using a mobile phase 80/20 mixture of 20 mM Tris/acetonitrile buffer (pH 8.0) at a flow rate of 1 ml/min. The HPLC system consisted of a 515 pump and a 2487 dual channel UV detector (Waters, Milford, MA) fitted with a homemade in-line radiation detector.
Liposome Studies
Liposome preparation
The appropriate molar amounts of lipids in chloroform solutions were mixed in a clean test tube, and the solvent was evaporated under a stream of N2 and the lipid film maintained under high vacuum for more than one hour. The lipid film was hydrated by vortexing with HEPES buffer (10 mM, 137 mM NaCl, 3.2 mM KCl, pH 7.4) to give a total lipid concentration of 5 mM. The multilamellar liposomes were extruded 21 times through a Nucleopore polycarbonate membrane (0.2 μm) to give unilamellar liposomes. The liposome suspension was stored for up to 12 h at room temperature prior to use in membrane binding studies.
FRET liposome binding assay
Aliquots of probe 1 or 2 (0.1–0.5 mM in H2O) were titrated into a 10 μM solution (10 mM HEPES, 137 mM NaCl, 3.2 mM KCl, pH 7.4) of DiIC18-containing liposomes in a quartz fluorescence cuvette with temperature regulated at 25°C. The fluorescence spectrum (480 nm excitation) was measured 10 minutes after each addition using a Horiba FluoroMax-4 spectrofluorometer from 500 to 750 nm. The FRET-induced quenching of the donor emission at 568 nm was plotted as a function of dye concentration and was fitted to a one-site 1:1 binding model using GraphPad software to obtain the reported dissociation constants.
Octanol partitioning study
Stock solutions of lipids were prepared at 5 mM in octanol:methanol (1:1). Probe stock solutions were 0.5 mM in water. In each experiment, 10 μM probe and 50 μM lipid were vortexed for 20 s in a biphasic mixture composed of octanol:TES buffer (5 mM with 145 mM NaCl, pH 7.3) in a volume ratio of 1:1 (0.5 mL total volume) and centrifuged at 1000 × g for 3 min to rapidly separate phases. After obtaining color photographs, phases were transferred to a 96-well plate for measurement of absorbance of probe in each phase. Absorbance values for each probe/lipid composition were normalized to the absorbance of a control (no lipid) and graphed as a function of lipid and log P was calculated using the formula: .
Cell studies
Fluorescence microscopy
Adherent cells were seeded onto a chambered coverslip system. Once the cells reached 80% confluency, camptothecin (15 μM) was added to the cells and they were allowed to incubate at 37 °C for the indicated time. The media was removed and 5 μM probe was added to the wells in HEPES buffer (10 mM, 137 mM NaCl, 3.2 mM KCl, pH 7.4) or Annexin V binding buffer for experiments in which an Annexin V costain was used. The cells were incubated at 37 °C for the indicated time, washed 1× with HEPES buffer, then imaged by fluorescence microscopy. Brightfield and fluorescence microscopy was performed on a Nikon TE-2000U epifluorescence microscope equipped with a Cy5 filter (ex: 620/60; em: 700/75). Fluorescence images were captured using NIS-Elements software (Universal) and analyzed using ImageJ software.
Flow cytometry
CHO-K1 cells were seeded into three T25 flasks and grown to confluency in F-12K media supplemented with 10% fetal bovine serum, and 1% streptavidin L-glutamate at 37 °C and 5% CO2. The cells were either treated with 15 μM etoposide for 13 h or left untreated in cell media. Cells treated with etoposide were washed once with HEPES buffer (10 mM HEPES, 137 mM NaCl, 3.2 mM KCl, pH = 7.4) before incubation with probe. CyAL-5, 1, and 2 were separately suspended in PBS buffer (1% DMSO; 1 mM stock) and diluted to a final concentration of 5 μM. Cells were treated with each probe for 15 min at 37 °C and 5% CO2. Three additional wash steps were performed, cells were treated with trypsin, and flasks were incubated at 37 °C until cells were detached. Once detached, the cells were centrifuged at 125 × g for 10 min. The trypsin was removed from the pellet solution, and the cells were resuspended in 1 mL PBS buffer. Flow cytometry was performed using a Beckman Coulter FC500 Flow Cytometer (FL4 channel; 10,000 cell count, medium flow rate) and histogram plots were generated using FlowJoIX software.
MTT cell viability assay
Quantification of cell toxicity was measured using the 3-(4,5-dimethylthiazol-2-yl)-2,5-diphenyltetrazolium bromide (MTT) cell viability assay. CHO-K1 cells were seeded into 96-microwell plates, and grown to confluency of 85% in F-12K media supplemented with 10% fetal bovine serum, and 1% streptavidin L-glutamate at 37 °C and 5% CO2. The Vybrant MTT cell proliferation Assay Kit (Invitrogen, Eugene, USA) was performed according to the manufacturer’s protocol and validated using 50 μM etoposide as a positive control for high toxicity. The cells were treated with either probe 1 or probe 2 (0–50 μM) and incubated for 18.5 h at 37 °C. The medium was removed and replaced with 110 μL of F-12K media containing [3-(4,5-dimethylthiazol-2-yl)-2,5-diphenyltetrazolium bromide] (MTT, 1.2 mM). Four hours later, an SDS-HCl detergent solution (100 μL) was added and incubated at 37 °C and 5% CO2 for an additional 6 h. The absorbance of each well was then read at 570 nm and normalized to wells containing no cells or added probe (measured in quadruplicate).
Animal studies
Fluorescent probe biodistribution in prostate tumor cell death model
All animal handling and imaging procedures were approved by the University of Notre Dame Institutional Animal Care and Use Committee. Male Lobund-Wistar rats (Freimann Life Science Center; 125 g, 4 week-old) were injected subcutaneously into the right flank with 1 × 10⁶ Prostate Adenocarcinoma III (PAIII) cells suspended in 300 μL of DMEM medium. Tumors grew for 14 days, followed by tail vein injection of probe (150 nmol) in water containing 1% DMSO. Cohort sizes were as follows: CyAL-5 (N = 4), PSVue643 (N = 4), probe 1 (N = 10), or probe 2 (N = 6). Twenty-four hours after probe injection, the rats were anesthetized and sacrificed. Selected tissues were excised and placed onto a transparent imaging tray for ex vivo fluorescence imaging. Epifluorescence images were acquired using an In Vivo Xtreme Imaging Station (Bruker Biospin Corporation; Billerica, MA) equipped with 630 nm excitation and 700 nm emission filter set. The images were acquired for 30 s for all organs (60 s for tumors alone) at a 18 cm × 18 cm field of view (f-stop = 2, 4 × 4 bin, high sensitivity). The fluorescence images were analyzed using ImageJ 1.40g software. Region of interest (ROI) analysis was performed by outlining around the excised tissue. The mean pixel intensities were measured and biodistribution results depicted as mean pixel intensities ± standard error of the mean, with statistical analysis using a Student’s t test. The biodistribution analysis assumes that the deep-red fluorescence emission from a specific organ suffers the same amount of signal attenuation for each probe; thus, the mean pixel intensities for a specific organ reflect the relative probe concentrations.
Fluorescent probe biodistribution in mouse thymus atrophy model
All animal procedures were approved by the University of Notre Dame Institutional Animal Care and Use Committee. Cohorts of 4-week old female SKH1 mice (Freimann Life Science Center, (25 g, N = 3) were given intraperitoneal injections (50 mg/kg) of water-soluble dexamethasone (Sigma Aldrich, St. Louis, MO) dissolved in phosphate buffered saline (PBS). Twenty-four hours later, the mice were injected with 10 nmol of fluorescent probe via the tail vein. An additional control cohort of mice (N = 3) were treated with PBS in the intraperitoneal cavity and intravenously injected with probe. Three hours later, the mice were sacrificed and select mouse tissues were excised, placed on a transparent imaging tray and imaged using an IVIS Lumina (Xenogen) with the following fluorescence acquisition parameters: ex: 615–665 nm, em: 695–770 nm, acquisition time: 5 seconds, binning: 2 × 2, F-stop: 2, field-of-view: 10 cm × 10 cm.
Radiotracer biodistribution in mouse thymus atrophy model
All animal studies were performed with the approval of the UMMS Institutional Animal Care and Use Committee. The following biodistribution experiment was conducted separately with radiotracer probes 9 or 10. Cohorts of healthy CD-1 mice (each cohort n=4 males 20–25 g, Charles River) were given intraperitoneal injections (50 mg/kg) of water soluble dexamethasone (Sigma Aldrich, St. Louis, MO) dissolved in saline. Additional control cohorts of mice (N = 4) were treated with PBS in the intraperitoneal cavity and intravenously injected with radiotracer probe. Twenty-four hours later, the mice were dosed via the tail vein with a radiotracer (~150 μl, 20 μCi) in saline. After 3 h, one cohort was anesthetized and sacrificed, and the second cohort was sacrificed after 24 h. The organs were excised, weighed, and radioactivity counted using a NaI (T1) automatic gamma counter against a standard of the injectate. The percent injected dose per gram of tissue (%ID/g) was calculated. The Student’s t test was used for significance determination where indicated.
Supplementary Material
Acknowledgments
We are grateful for funding support from the NIH (RO1GM059078), GAANN (K.J.C. and K.M.H.) and technical support from the University of Notre Dame, the Notre Dame Integrated Imaging Facility, the Harper Cancer Research Institute Imaging and Flow Cytometry Core Facility, and the Freimann Life Sciences Center. We thank M. Smith and S. Turkyilmaz for excellent technical assistance.
Abbreviations
- DilC18
(1,1′-dioctadecyl-3,3,3′,3′-tetramethylindocarbocyanine perchlorate
- DTPA
diethylene triamine pentaacetic acid
- PEG2000-DSPE
(1,2-distearoyl-sn-glycero-3-phosphoethanolamine-N-[methoxy(polyethylene glycol)-2000]
- POPS
1-palmitoyl-2-oleoyl-sn-glycero-3-phosphoserine
- POPC
1-palmitoyl-2-oleoyl-sn-glycero-3-phosphocholine
- PS
phosphatidylserine
- Zn2BDPA
zinc(II)-bis(dipicolylamine)
- Zn2TyrBDPA
L-tyrosine based zinc(II)-bis(dipicolylamine)
Footnotes
Notes
The authors declare no competing financial interest.
Associated Content
Supplemental data and NMR spectra can be found in the Supporting Information. This material is available free of charge via the internet at http://pubs.acs.org.
References
- 1.Zhivotovsky B, Orrenius S. Cell cycle and cell death in disease: past, present and future. J Intern Med. 2010;268:395–409. doi: 10.1111/j.1365-2796.2010.02282.x. [DOI] [PubMed] [Google Scholar]
- 2.Smith BA, Smith BD. Biomarkers and molecular probes for cell death imaging and targeted therapeutics. Bioconjugate Chem. 2012;23:1989–2006. doi: 10.1021/bc3003309. [DOI] [PMC free article] [PubMed] [Google Scholar]
- 3.Neves AA, Brindle KM. Imaging cell death. J Nucl Med. 2014;55:1–4. doi: 10.2967/jnumed.112.114264. [DOI] [PubMed] [Google Scholar]
- 4.Schutters K, Reutelingsperger C. Phosphatidylserine targeting for diagnosis and treatment of human diseases. Apoptosis. 2010;15:1072–1082. doi: 10.1007/s10495-010-0503-y. [DOI] [PMC free article] [PubMed] [Google Scholar]
- 5.Belhocine TZ, Prato FS. Transbilayer phospholipids molecular imaging. EJNMMI Res. 2011;1:1–14. doi: 10.1186/2191-219X-1-17. [DOI] [PMC free article] [PubMed] [Google Scholar]
- 6.Mapes J, Chen YZ, Kim A, Mitani S, Kang BH, Xue D. CED-1, CED-7, and TTR-52 regulate surface phosphatidylserine expression on apoptotic and phagocytic cells. Curr Biol. 2012;22:1267–1275. doi: 10.1016/j.cub.2012.05.052. [DOI] [PMC free article] [PubMed] [Google Scholar]
- 7.Ungethum L, Chatrou M, Kusters D, Schurgers L, Reutelingsperger CP. Molecular imaging of cell death in tumors: increasing Annexin A5 size reduces contribution of phosphatidylserine-targeting function to tumor uptake. PLoS One. 2014;9:e96749. doi: 10.1371/journal.pone.0096749. [DOI] [PMC free article] [PubMed] [Google Scholar]
- 8.Ungethüm L, Kenis H, Nicolaes GA, Autin L, Stoilova-McPhie S, Reutelingsperger CPM. Engineered Annexin A5 variants have impaired cell entry for molecular imaging of apoptosis using pretargeting strategies. J Biol Chem. 2011;286:1903–1910. doi: 10.1074/jbc.M110.163527. [DOI] [PMC free article] [PubMed] [Google Scholar]
- 9.Lederle W, Arns S, Rix A, Gremse F, Doleschel D, Schmaljohann J, Mottaghy FM, Kiessling F, Palmowski M. Failure of Annexin-based apoptosis imaging in the assessment of antiangiogenic therapy effects. EJNMMI Res. 2011;1:1–10. doi: 10.1186/2191-219X-1-26. [DOI] [PMC free article] [PubMed] [Google Scholar]
- 10.Burtea C, Laurent S, Lancelot E, Ballet S, Murariu O, Rousseaux O, Port M, Vander Elst L, Corot C, Muller RN. Peptidic targeting of phosphatidylserine for the MRI detection of apoptosis in atherosclerotic plaques. Mol Pharm. 2009;6:1903–1919. doi: 10.1021/mp900106m. [DOI] [PubMed] [Google Scholar]
- 11.Xiong C, Brewer K, Song S, Zhang R, Lu W, Wen X, Li C. Peptide-based imaging agents targeting phosphatidylserine for the detection of apoptosis. J Med Chem. 2011;54:1825–1835. doi: 10.1021/jm101477d. [DOI] [PubMed] [Google Scholar]
- 12.Hosseini AS, Zheng H, Gao J. Understanding lipid recognition by protein-mimicking cyclic peptides. Tetrahedron. 2014;70:7632–7638. doi: 10.1016/j.tet.2014.07.104. [DOI] [PMC free article] [PubMed] [Google Scholar]
- 13.Zheng H, Wang F, Wang Q, Gao J. Cofactor-free detection of phosphatidylserine with cyclic peptides mimicking lactadherin. J Am Chem Soc. 2011;133:15280–15283. doi: 10.1021/ja205911n. [DOI] [PubMed] [Google Scholar]
- 14.Shao R, Xiong C, Wen X, Gelovani JG, Li C. Targeting phosphatidylserine on apoptotic cells with phages and peptides selected from a bacteriophage display library. Mol Imaging. 2007;6:417–426. [PubMed] [Google Scholar]
- 15.Oltmanns D, Zitzmann-Kolbe S, Mueller A, Bauder-Wuest U, Schaefer M, Eder M, Haberkorn U, Eisenhut M. Zn(II)-bis(cyclen) complexes and the imaging of apoptosis/necrosis. Bioconjugate Chem. 2011;22:2611–2624. doi: 10.1021/bc200457b. [DOI] [PubMed] [Google Scholar]
- 16.Cooley CM, Hettie KS, Klockow JL, Garrison S, Glass TE. A selective fluorescent chemosensor for phosphoserine. Org Biomol Chem. 2013;11:7387–7392. doi: 10.1039/c3ob41677a. [DOI] [PubMed] [Google Scholar]
- 17.Li J, Guo K, Shen J, Yang W, Yin M. A difunctional squarylium indocyanine dye distinguishes dead cells through diverse staining of the cell nuclei/membranes. Small. 2014;10:1351–1360. doi: 10.1002/smll.201302920. [DOI] [PubMed] [Google Scholar]
- 18.Zhang T, Chan CF, Lan R, Li H, Mak NK, Wong WK, Wong KL. Porphyrin-based ytterbium complexes targeting anionic phospholipid membranes as selective biomarkers for cancer cell imaging. Chem Commun. 2013;49:7252–7254. doi: 10.1039/c3cc43469a. [DOI] [PubMed] [Google Scholar]
- 19.Hu Q, Gao M, Feng G, Chen X, Liu B. A cell apoptosis probe based on fluorogen with aggregation induced emission characteristics. ACS Appl Mater Interfaces. 2015;7:4875–4882. doi: 10.1021/am508838z. [DOI] [PubMed] [Google Scholar]
- 20.Smith BA, Gammon ST, Xiao S, Wang W, Chapman S, McDermott R, Suckow MA, Johnson JR, Piwnica-Worms D, Gokel GW. In vivo optical imaging of acute cell death using a near-infrared fluorescent zinc–dipicolylamine probe. Mol Pharm. 2011;8:583. doi: 10.1021/mp100395u. [DOI] [PMC free article] [PubMed] [Google Scholar]
- 21.Smith BA, Xiao S, Wolter W, Wheeler J, Suckow MA, Smith BD. In vivo targeting of cell death using a synthetic fluorescent molecular probe. Apoptosis. 2011;16:722–731. doi: 10.1007/s10495-011-0601-5. [DOI] [PMC free article] [PubMed] [Google Scholar]
- 22.Cho YS, Kim KM, Lee D, Kim WJ, Ahn KH. Turn-on fluorescence detection of apoptotic cells using a zinc(II)-dipicolylamine-functionalized poly(diacetylene) liposome. Chem - Asian J. 2013;8:755–759. doi: 10.1002/asia.201201139. [DOI] [PubMed] [Google Scholar]
- 23.Lakshmi C, Hanshaw RG, Smith BD. Fluorophore-linked zinc (II) dipicolylamine coordination complexes as sensors for phosphatidylserine-containing membranes. Tetrahedron. 2004;60:11307–11315. [Google Scholar]
- 24.Hanshaw RG, Lakshmi C, Lambert TN, Johnson JR, Smith BD. Fluorescent detection of apoptotic cells by using zinc coordination complexes with a selective affinity for membrane surfaces enriched with phosphatidylserine. Chem Bio Chem. 2005;6:2214–2220. doi: 10.1002/cbic.200500149. [DOI] [PubMed] [Google Scholar]
- 25.Plaunt AJ, Harmatys KM, Wolter WR, Suckow MA, Smith BD. Library synthesis, screening, and discovery of modified zinc(II)-bis(dipicolylamine) probe for enhanced molecular imaging of cell death. Bioconjugate Chem. 2014;25:724–737. doi: 10.1021/bc500003x. [DOI] [PMC free article] [PubMed] [Google Scholar]
- 26.Smith BA, Harmatys KM, Xiao S, Cole EL, Plaunt AJ, Wolter W, Suckow MA, Smith BD. Enhanced cell death imaging using multivalent zinc(II)-bis(dipicolylamine) fluorescent probes. Mol Pharm. 2013;10:3296–3303. doi: 10.1021/mp300720k. [DOI] [PMC free article] [PubMed] [Google Scholar]
- 27.Jiang H, O’Neil EJ, DiVittorio KM, Smith BD. Anion-mediated phase transfer of zinc(II)-coordinated tyrosine derivatives. Org Lett. 2005;7:3013–3016. doi: 10.1021/ol0510421. [DOI] [PubMed] [Google Scholar]
- 28.DiVittorio KM, Leevy WM, O’Neil EJ, Johnson JR, Vakulenko S, Morris JD, Rosek KD, Serazin N, Hilkert S, Hurley S, et al. Zinc(II) coordination complexes as membrane-active fluorescent probes and antibiotics. Chem Bio Chem. 2008;9:286–293. doi: 10.1002/cbic.200700489. [DOI] [PMC free article] [PubMed] [Google Scholar]
- 29.Nonaka H, Fujishima S-h, Uchinomiya S-h, Ojida A, Hamachi I. Selective covalent labeling of tag-fused GPCR proteins on live cell surface with a synthetic probe for their functional analysis. J Am Chem Soc. 2010;132:9301–9309. doi: 10.1021/ja910703v. [DOI] [PubMed] [Google Scholar]
- 30.Ojida A, Honda K, Shinmi D, Kiyonaka S, Mori Y, Hamachi I. Oligo-Asp tag/Zn(II) complex probe as a new pair for labeling and fluorescence imaging of proteins. J Am Chem Soc. 2006;128:10452–10459. doi: 10.1021/ja0618604. [DOI] [PubMed] [Google Scholar]
- 31.Honda K, Nakata E, Ojida A, Hamachi I. Ratiometric fluorescence detection of a tag fused protein using the dual-emission artificial molecular probe. Chem Commun. 2006:4024–4026. doi: 10.1039/b608684e. [DOI] [PubMed] [Google Scholar]
- 32.White AG, Gray BD, Pak KY, Smith BD. Deep-red fluorescent imaging probe for bacteria. Bioorg Med Chem Lett. 2012;22:2833–2836. doi: 10.1016/j.bmcl.2012.02.078. [DOI] [PMC free article] [PubMed] [Google Scholar]
- 33.Shao F, Yuan H, Josephson L, Weissleder R, Hilderbrand SA. Facile synthesis of monofunctional pentamethine carbocyanine fluorophores. Dyes Pigm. 2011;90:119–122. doi: 10.1016/j.dyepig.2010.12.008. [DOI] [PMC free article] [PubMed] [Google Scholar]
- 34.Galande AK, Weissleder R, Tung CH. Fluorescence probe with a pH-sensitive trigger. Bioconjugate Chem. 2006;17:255–257. doi: 10.1021/bc050330e. [DOI] [PubMed] [Google Scholar]
- 35.Berlier JE, Rothe A, Buller G, Bradford J, Gray DR, Filanoski BJ, Telford WG, Yue S, Liu J, Cheung CY, et al. Quantitative comparison of long-wavelength Alexa Fluor dyes to Cy dyes: fluorescence of the dyes and their bioconjugates. J Histochem Cytochem. 2003;51:1699–1712. doi: 10.1177/002215540305101214. [DOI] [PubMed] [Google Scholar]
- 36.Kohira T, Honda K, Ojida A, Hamachi I. Artificial receptors designed for intracellular delivery of anionic phosphate derivatives. Chem Bio Chem. 2008;9:698–701. doi: 10.1002/cbic.200700627. [DOI] [PubMed] [Google Scholar]
- 37.Smith BA, Akers WJ, Leevy WM, Lampkins AJ, Xiao S, Wolter W, Suckow MA, Achilefu S, Smith BD. Optical imaging of mammary and prostate tumors in living animals using a synthetic near infrared zinc(II)-dipicolylamine probe for anionic cell surfaces. J Am Chem Soc. 2009;132:67–69. doi: 10.1021/ja908467y. [DOI] [PMC free article] [PubMed] [Google Scholar]
- 38.Jeppesen B, Smith C, Gibson DF, Tait JF. Entropic and enthalpic contributions to Annexin V-membrane binding: a comprehensive quantitative model. J Biol Chem. 2008;283:6126–6135. doi: 10.1074/jbc.M707637200. [DOI] [PubMed] [Google Scholar]
- 39.Yu A, Byers DM, Ridgway ND, McMaster CR, Cook HW. Preferential externalization of newly synthesized phosphatidylserine in apoptotic U937 cells is dependent on caspase-mediated pathways. Biochim Biophys Acta. 2000;1487:296–308. doi: 10.1016/s1388-1981(00)00100-1. [DOI] [PubMed] [Google Scholar]
- 40.Stevens N, O’Connor N, Vishwasrao H, Samaroo D, Kandel ER, Akins DL, Drain CM, Turro NJ. Two color RNA intercalating probe for cell imaging applications. J Am Chem Soc. 2008;130:7182–7183. doi: 10.1021/ja8008924. [DOI] [PMC free article] [PubMed] [Google Scholar]
- 41.Song G, Sun Y, Liu Y, Wang X, Chen M, Miao F, Zhang W, Yu X, Jin J. Low molecular weight fluorescent probes with good photostability for imaging RNA-rich nucleolus and RNA in cytoplasm in living cells. Biomaterials. 2014;35:2103–2112. doi: 10.1016/j.biomaterials.2013.11.052. [DOI] [PubMed] [Google Scholar]
- 42.Herce HD, Garcia AE, Cardoso MC. Fundamental molecular mechanism for the cellular uptake of guanidinium-rich molecules. J Am Chem Soc. 2014;136:17459–17467. doi: 10.1021/ja507790z. [DOI] [PMC free article] [PubMed] [Google Scholar]
- 43.Sun XM, Dinsdale D, Snowden RT, Cohen GM, Skilleter DN. Characterization of apoptosis in thymocytes isolated from dexamethasone-treated rats. Biochem Pharmacol. 1992;44:2131–2137. doi: 10.1016/0006-2952(92)90339-k. [DOI] [PubMed] [Google Scholar]
- 44.Blankenberg FG, Katsikis PD, Tait JF, Davis RE, Naumovski L, Ohtsuki K, Kopiwoda S, Abrams MJ, Darkes M, Robbins, et al. In vivo detection and imaging of phosphatidylserine expression during programmed cell death. Proc Natl Acad Sci U S A. 1998;95:6349–6354. doi: 10.1073/pnas.95.11.6349. [DOI] [PMC free article] [PubMed] [Google Scholar]
- 45.Zille M, Harhausen D, De Saint-Hubert M, Michel R, Reutelingsperger CP, Dirnagl U, Wunder A. A dual-labeled Annexin A5 is not suited for SPECT imaging of brain cell death in experimental murine stroke. J Cereb Blood Flow Metab. 2014;34:1568–1570. doi: 10.1038/jcbfm.2014.115. [DOI] [PMC free article] [PubMed] [Google Scholar]
- 46.Bamri-Ezzine S, Ao ZJ, Londono I, Gingras D, Bendayan M. Apoptosis of tubular epithelial cells in glycogen nephrosis during diabetes. Lab Invest. 2003;83:1069–1080. doi: 10.1097/01.lab.0000078687.21634.69. [DOI] [PubMed] [Google Scholar]
- 47.Matsuda R, Kaneko N, Horikawa Y, Chiwaki F, Shinozaki M, Ieiri T, Suzuki T, Ogawa N. Localization of Annexin V in rat normal kidney and experimental glomerulonephritis. Res Exp Med. 2001;200:77–92. doi: 10.1007/BF03220017. [DOI] [PubMed] [Google Scholar]
- 48.Sterin-Speziale N, Kahane V, Setton C, Fernandez M, Speziale E. Compartmental study of rat renal phospholipid metabolism. Lipids. 1992;27:10–14. doi: 10.1007/BF02537051. [DOI] [PubMed] [Google Scholar]
- 49.Rice DR, Plaunt AJ, Turkyilmaz S, Smith M, Wang Y, Rusckowski M, Smith BD. Evaluation of [111In]-labeled zinc-dipicolylamine tracers for SPECT imaging of bacterial infection. Mol Imaging Biol. 2015;17:204–21. doi: 10.1007/s11307-014-0758-8. [DOI] [PMC free article] [PubMed] [Google Scholar]
- 50.Wang H, Tang X, Tang G, Huang T, Liang X, Hu K, Deng H, Yi C, Shi X, Wu K. Noninvasive positron emission tomography imaging of cell death using a novel small-molecule probe, 18F labeled bis(zinc(ii)-dipicolylamine) complex. Apoptosis. 2013;18:1017–1027. doi: 10.1007/s10495-013-0852-4. [DOI] [PubMed] [Google Scholar]
- 51.Wyffels L, Gray BD, Barber C, Woolfenden JM, Pak KY, Liu Z. Synthesis and preliminary evaluation of radiolabeled bis(zinc(ii) dipicolylamine) coordination complexes as cell death imaging agents. Biorg Med Chem. 2011;19:3425–3433. doi: 10.1016/j.bmc.2011.04.029. [DOI] [PMC free article] [PubMed] [Google Scholar]
- 52.Nakasone ES, Askautrud, Hanne A, Kees T, Park J-H, Plaks V, Ewald AJ, Fein M, Rasch MG, et al. Imaging tumor-stroma interactions during chemotherapy reveals contributions of the microenvironment to resistance. Cancer Cell. 2012;21:488–503. doi: 10.1016/j.ccr.2012.02.017. [DOI] [PMC free article] [PubMed] [Google Scholar]
Associated Data
This section collects any data citations, data availability statements, or supplementary materials included in this article.


