Abstract
Background
The growing complexity of biological experiment design based on high-throughput RNA sequencing (RNA-seq) is calling for more accommodative statistical tools. We focus on differential expression (DE) analysis using RNA-seq data in the presence of multiple treatment conditions.
Results
We propose a novel method, multiDE, for facilitating DE analysis using RNA-seq read count data with multiple treatment conditions. The read count is assumed to follow a log-linear model incorporating two factors (i.e., condition and gene), where an interaction term is used to quantify the association between gene and condition. The number of the degrees of freedom is reduced to one through the first order decomposition of the interaction, leading to a dramatically power improvement in testing DE genes when the number of conditions is greater than two. In our simulation situations, multiDE outperformed the benchmark methods (i.e. edgeR and DESeq2) even if the underlying model was severely misspecified, and the power gain was increasing in the number of conditions. In the application to two real datasets, multiDE identified more biologically meaningful DE genes than the benchmark methods. An R package implementing multiDE is available publicly at http://homepage.fudan.edu.cn/zhangh/softwares/multiDE.
Conclusions
When the number of conditions is two, multiDE performs comparably with the benchmark methods. When the number of conditions is greater than two, multiDE outperforms the benchmark methods.
Keywords: RNA-seq, Differential expression, Multiple conditions
Background
High-throughput RNA sequencing (RNA-seq) technologies are emerging rapidly in recent years, which are widely used in biological studies [1]. One of the most important biological problems is to identify differentially expressed genes between multiple experimental conditions. As a result, the key of analyzing these data lies in establishing an appropriate statistical model for RNA-seq count data and consequently preforming differential expression (DE) analysis. Many statistical methods have been developed to fulfill this commission [2, 3]. Methods such as DEGSeq assume that the read count follows a Poisson distribution [4]. Nevertheless, this assumption is violated in the presence of variance overdispersion due to technological and biological variations. An additional parameter can be used to account for the overdispersion. DESeq2 and edgeR, for example, both assume a negative binomial distribution [5, 6]. Much more efficient estimates of the dispersion parameters are obtained using an empirical Bayesian method, resulting in a considerable improvement of DE analysis power and a better control of false positive rate if the sample size is very small. These two methods have been implemented in the Bioconductor packages edgeR and DESeq2, respectively.
In many biological studies, biologists are interested in identifying those genes differently expressed between multiple conditions. For example, the transcriptome of several stages of embryo development or several subtypes of cancer simultaneously enable them to get insight into the sophisticated biological mechanism on a much more comprehensive point [7, 8]. Moreover, the read counts of various conditions can be correlated with each other if they are generated from the same subject. This further complicates the statistical analysis. When the number of conditions, D, is greater than two, an analysis of variance (ANOVA) model can be used to detect those genes differentially expressed between the conditions. The chi-squared test based the ANOVA model has D−1 degrees of freedom.
To improve power of DE analysis, we recently proposed a 1-df test based on a rank-reduced logistic ANOVA model for logarithm of the expected read count, where the read count was assumed to follow a Poisson-lognormal distribution [9]. This method was termed PLN-ANOVA. In this paper, we present a novel framework committing to facilitate the DE analysis of RNA-seq read count data generated by experiments with multiple conditions, which takes the correlation between samples (if any) into account. The negative binomial distribution is used to model the read count, where the effects of gene and condition on the read counts are incorporated through a two-factor log-linear model with both main effects and interaction effects, while the association between gene and condition is quantified through D interaction terms for each of G genes. We propose to reduce the dimension of independent interaction parameters from (D−1)(G−1) to D+G−2. A rigorous statistical estimation/test procedure is developed in this paper, which could be much more efficient compared with the ones without dimension reduction when D>2. The major difference between the current paper and [9] are two-fold: in the distribution assumptions on the read count are different, and the former can deal with both matched samples and unmatched samples but the later can only deal with matched samples.
Methods
In this section, we describe a rank-reduced model for the RNA-seq read counts of biological samples drawn from multiple conditions, then develop an estimation/test procedure for DE analysis.
Notation and model
Let X denote the read count (i.e., the number of reads mapped to a reference) for any interested gene of any sample. Let δ denote the library size factor for that sample, then we can normalize the read count by Y=[X/δ], where [ a] is the integer closest to a. The size factor can be estimated by any normalization method to be described in the next subsection. As in many statistical methods for analyzing RNA-seq read counts, we assume that Y follows a negative binomial distribution. That is, there is an underlying gene expression Z that follows a gamma distribution, and Y follows a Poisson distribution with expectation Z. This way, Y marginally follows a compound Poisson-gamma distribution (i.e., negative binomial distribution). In the following, we extend the negative binomial distribution to model the read counts of biological samples drawn from multiple conditions, where the samples can be either independent or correlated with each other.
Consider a study involving D conditions, and nd samples are drawn from the dth condition (d=1,…,D). Let Xidg denote the read count of the gth gene for the ith sample in the dth condition. Let Yidg=[Xidg/δid] be a normalized read count, where δid is a size factor for the ith sample in the dth condition. We assume the following conditions hold:
(C1) Yi1g,…,YiDg are conditionally independent of each other given their underlying gene expressions Zi1g,…,ZiDg, and Zidg follows a gamma distribution with expectation μdg and variance . As a result, Yidg marginally follows the negative binomial distribution with expectation μdg and dispersion parameter ϕg (i.e., the variance of Yidg is ).
(C2) The correlation coefficient of and , , is free of gene g, which is equal to 0 for d1≠d2 in the unmatched situation.
(C3) As in [10] and [9], the following rank-reduced logistic ANOVA model holds for the logarithm of expected gene expression:
| 1 |
where μ is the grand mean, αd is the main effect for condition d, βg is the main effect for gene g, and γdg:=udvg is the interaction effect between gene g and condition d.
(C4) There are a sufficiently large number of DE genes between G genes, i.e., γdg≠0 for a large number of genes. As remarked below, this implies that ud≠0 for at least one d.
Equality restrictions are imposed for the sake of parameter identifiability:
| 2 |
| 3 |
and , u1=1, or equivalently
| 4 |
| 5 |
The restrictions (2) and (4) take the sample sizes into account, which will yield simple weighted least squares estimates described in the next section. Under the above restrictions, the main condition effect αd should be equal to zero so that there is no systematic gene expression difference between the D conditions. The main genetic effect βg quantifies the relative expression of gene g. Since provided αd=0, γdg quantifies the relative association strength between condition d and the expression level for gene g. If there is at least one gene differentially expressed between the D conditions, then γdg≠0 for at least one g, hence ud≠0 for at least one d under decomposition (1). Therefore, the relative association strength can be measured by vg, and the null hypothesis that the gth gene is differentially expressed between the D conditions can be formulated by
| 6 |
The key idea of model (1) is to approximate the interaction effect γdg using the product of two terms that depend on d and g separately. This reduces the dimension of test problem from D−1 (the corresponding null hypothesis is Hg:γ1g=…=γDg) to one (the corresponding null hypothesis is Hg:vg=0) for gene g. Obviously, the resultant test could be much more powerful than the chi-square test based on the ANOVA model without such decomposition if D>2.
Read count normalization
In this subsection, we consider the calculation of the size factor δid. It is widely known that raw counts are not directly comparable between genes due to differential gene lengths and sequencing depths, and reads per kilobase per million reads (RPKM) can be used to correct the resultant technical bias [11]. In DE analysis between multiple conditions, the gene length does not affect the analysis result since such DE analysis focuses on the same gene. However, the condition comparison could greatly suffer from sample specific effects such as sequencing depth and sample specific GC-content effect. The sample specific GC-content effect could arise if two or more samples are sequenced in the same lane. Several within-lane normalization methods (i.e., regression normalization, global-scaling normalization, and full-quantile normalization) can be used to correct the resultant technical bias [12]. On the other hand, such effect can be absorbed into sample specific sequencing depth if only a single sample is sequenced in each lane, and the following four between-lane normalization methods are designed for correcting the technical bias due to sequencing depth.
The first one is the median normalization, denoted by MEDIAN, which takes the form [5]
| 7 |
where mid is the sample median of {Xid1,…,XidG}.
The second one is the total count normalization, denoted by TOTAL, which takes the form [13]
| 8 |
where sid is the sum of {Xid1,…,XidG}.
The third one is the quantile normalization, denoted by QUANTILE, which takes the form [2]
| 9 |
where qid is the 75th percentile of {Xid1,…,XidG}.
The fourth is a weighted trimmed mean of M-values, denoted by TMM, which has been implemented in the Bioconductor package edgeR [14]. For sample i in condition d and sample i′ in condition d′, the log-fold changes (M-values) are defined as
where . If one uses sample i0 in condition d0 as a reference sample, then the size factor for sample i in condition d is defined as
| 10 |
where G∗ is the set of those genes with the upper and lower 30 % of the M-values removed. In edgeR that implements TMM, the sample with upper quartile closest to the mean upper quartile across all samples is used as the default reference. To minimize the variance of δid, here the weight is defined as inverse of the estimated variance of M-values:
Using any of the above four normalization methods, the read count Xidg can be normalized by
Parameter estimation
In this subsection, we derive estimators of μ, αd, βg, ud, vg, ϕg, and . We first describe two existing methods for estimating ϕg. Then we develop a simple estimation equation method for estimating μ, αd, βg, ud, and vg. Finally, we propose a method for estimating in the matched sample situation.
First, we estimate the dispersion parameter ϕg using an empirical Bayes method or a parametric method via a robust gamma-family generalized linear model. The two dispersion estimation methods have been implemented in the Bioconductor packages edgeR and DESeq2, respectively.
Next, we describe a novel method for estimating μ, αd, βg, ud, and vg. Denote ηdg= logμdg, which can be estimated by
| 11 |
Under restrictions (2)-(5), we have the moment estimators of μ, αd, βg, and γdg:
| 12 |
| 13 |
| 14 |
Here we adopt a weighted least squares approach to estimating ud and vg [15]. Noting that has an asymptotic variance proportional to , we can minimize the weighted sum of squares
subject to restrictions (2)-(5). The resultant solution {} satisfies the following equations:
| 15 |
| 16 |
In real situations, most genes are equally expressed with vg=0 and the corresponding information is pure noise for estimating ud. To eliminate the impact of such noise, we can modify (15) as
| 17 |
where S is a DE gene set determined by any existing method such as edgeR. Equations (16) and (17) can be easily solved in an iterative manner, and the algorithm for all genes can be greatly sped up via vectorization.
Finally, we derive an estimator of the correlation coefficient in the matched sample situation. By conditions (C1) and (C2), we have that
Since Y1dg,…,Yndg are identically distributed, we can estimate with the sample correlation coefficient of times a continuity correct term proposed by [16], which is denoted by . Here the continuity correct term is used to reduce the estimation bias due to a very small sample size. An estimator of takes the form
To construct a Wald test statistic for testing Hg:vg=0, we need to estimate the variance of , as detailed in the next subsection.
Variance estimation and Wald test
Since , , and use the information across a sufficiently large number of genes, it is reasonable to assume that their variances are ignorable compared with those of the other estimators. Therefore, we have
Using the delta method, we have that
Therefore, we can estimate by
| 18 |
in the unmatched sample situation. In the matched sample situation with nd=n for d=1,…,D, we need to further estimate for d1≠d2. The resultant estimate of in the matched sample situation, , takes the form
| 19 |
With the estimator (18) or (19), we can construct a Wald test statistic
| 20 |
whose null limiting distribution is the chi-squared distribution with one degree of freedom.
Results
To evaluate the performance of the proposed method, we conducted both simulation studies and real data analyses. For comparison purpose, we considered two benchmark methods edgeR (version 3.12.1) and DESeq2 (version 1.10.1). The functions estimateGLMTagwiseDisp and estimateDispersions were used to estimate tagwise negative binomial dispersions in edgeR and DESeq2, respectively. In these two methods, the likelihood ratio tests were used for DE analysis and the default parameters were adopted. We also considered our recently developed method PLN-ANOVA, which was designed for matched samples. In both simulation studies and real data applications for multiDE, the dispersion estimates given by edgeR and DESeq2 produced DE analysis results that were very close to each other. Therefore, in the following studies, we only present the results of multiDE with the dispersion estimates given by edgeR.
Simulation studies
We considered the situation where only a single sample was sequenced in each lane, as commonly done in real applications, so that the effect of sample specific GC-content can be absorbed into the library size. First we evaluated the four normalization methods using simulation data generated from a real dataset. Then we conducted a comparison study between two benchmark methods (i.e., edgeR and DESeq2) and multiDE equipped with MEDIAN using simulation data generated under model (1). Finally, we conducted a sensitivity analysis by generating data without the assumption of model (1).
Simulation based on a real dataset
In multiDE, any of the four methods (namely, MEDIAN, TOTAL, QUANTILE, and TMM) can be used to normalize the read counts.
We generated simulation data using a real data set from an embryonic stem cells study described in the next subsection. In this study, RNA-seq read counts at 6,526 genes were available from nine unrelated individuals. Three different conditions were considered, and each condition had three individuals. Refer to the next subsection for detailed description of this study. We randomly permutated the condition information for the nine samples, then randomly selected 600 DE genes. In each of these DE genes, the read counts of the second condition were the original ones multiplied by a factor of 1.1, and the read counts of the third condition were the original ones multiplied by a factor of 0.9. The rest 5,926 genes were regarded as equally expressed genes. Such experiment was repeated for 400 times, and the four normalization methods were applied to these datasets.
The simulation results of multiDE equipped with the four normalization methods were summarized through receiver operating characteristic (ROC) curves and false discovery rates (FDRs) (Fig. 1). In terms of both FDRs and ROC curves, TMM slightly outperformed the other three normalization methods. As stated in [14], TMM is robust against outlying read counts and a significant proportion of DE genes, while the other three normalization methods assume that most genes are not differentially expressed. Actually, these three methods performed relatively poorer than TMM in the application to the above datasets that have about 10 % DE genes. This agrees with the simulation results of [14].
Fig. 1.
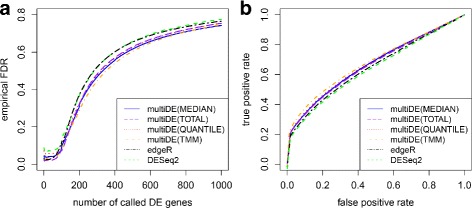
Performance of various methods with simulation data based on the embryonic stem cells study. a False discovery rates; b ROC curves
We also applied the two benchmark methods edgeR and DESeq2 to the above simulation datasets. Evidently, multiDE outperformed edgeR and DESeq2 even using the MEDIAN (Fig. 1), we therefore focus on this normalization method in the next two subsections.
Simulation based on model (1)
We considered two situations for generating the read count Xidg, one was for unmatched samples and the other was for matched samples. The parameters shared the two situations were set to be the same. We let D = 2, 3, 4, or 5, and fixed the total number of genes to be G=104. Then we set nd=D+d−1 for d=1,…,D in the unmatched sample situation, and n=4 in the matched sample situation.
To generate RNA-seq read count data, we set μ=4, αd=0 for d=1,…,D,
in the unmatched sample situation, and
in the matched sample situation. We let vg=0 for equally expressed genes g=1,…,9000, vg∼−|N(0,0.32)| for up-regulated genes g=9001,…,9500, and vg∼|N(0,0.32)| for down-regulated genes g=9501,…,10000. In addition, we randomly generated size factors δid from the log-normal distribution with mean and varariance parameters 0 and 0.252, main genetic effects βg from the normal distribution with mean 0 and variance 0.252, dispersion parameters ϕg from the gamma distribution with shape parameter 5 and rate parameter 20, where the shape and rate parameters were close to those for the embryonic stem cells data to be analyzed in the next subsection.
With the above parameters, we then generated underlying gene expressions (Zi1g,…,ZiDg) from multivariate gamma distribution with correlation parameters using the Bioconductor package copula [17], and generated the read counts Xidg from the Poisson distribution with expectation Zidg. We let in the unmatched situation and in the matched situation.
For each parameter combination, we generated 50 datasets. For each dataset, ud and vg were estimated using multiDE. To evaluate the estimation accuracy of multiDE, we report in Figs. 2, 3, 4 and 5 the ud estimates and the biases of vg estimates in both matched and unmatched sample situations. Overall, the ud estimates were virtually close to the true ones and the estimation biases of vg were minor.
Fig. 2.
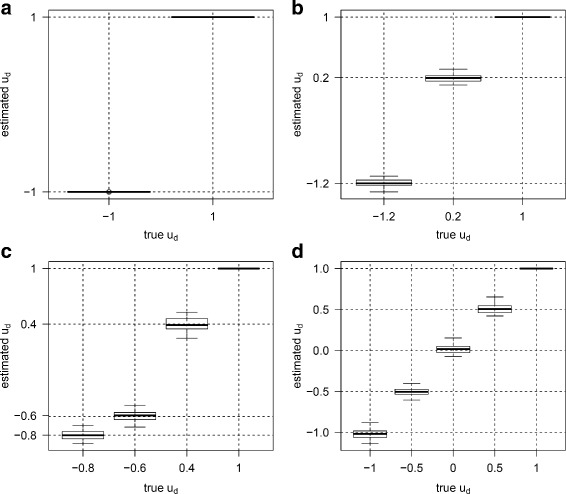
Estimates of u d in matched sample situation. a D=2; b D=3; c D=4; d D=5
Fig. 3.
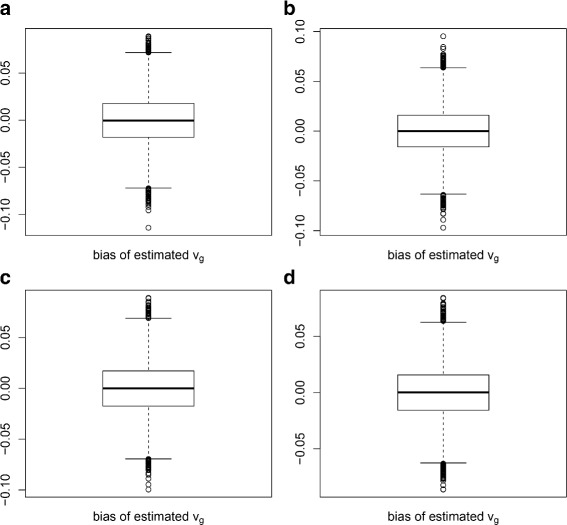
Estimation biases of v g in matched sample situation. a D=2; b D=3; c D=4; d D=5
Fig. 4.
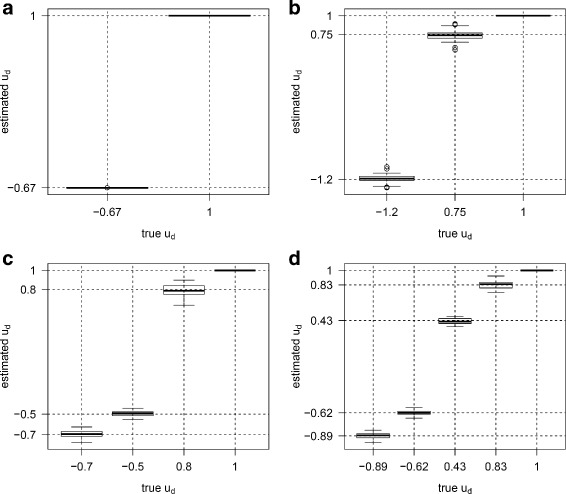
Estimates of u d in unmatched sample situation. a D=2; b D=3; c D=4; d D=5
Fig. 5.
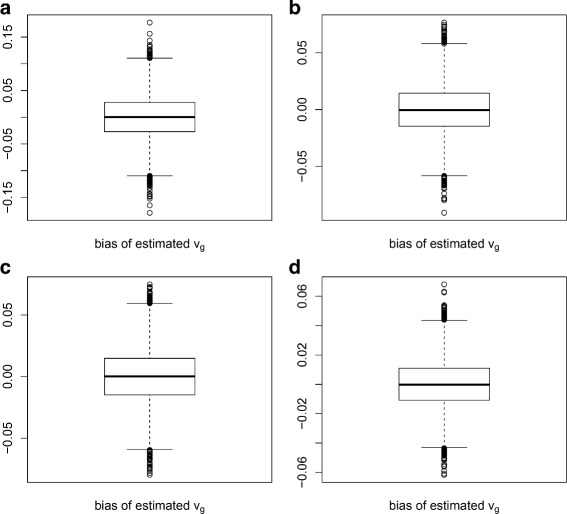
Estimation biases of v g in unmatched sample situation. a D=2; b D=3; c D=4; d D=5
We obtained the p-values for testing H0:vg=0 using the four considered methods (PLN-ANOVA was applied only in the matched sample situation), and evaluated the performance of these methods through ROC curves and FDRs (Figs. 6, 7, 8 and 9). For N=1,…,2000, we evaluated the FDRs of top N identified DE genes. The FDR-adjusted p-values were calculated using the R function p.adjust, and the empirical FDRs were consequently obtained. In terms of FDRs, the four methods performed quite comparably when D=2. On the other hand, multiDE and PLN-ANOVA had smaller FDRs compared with edgeR and DESeq2 when D>2. According to the ROC curves, when D=2, multiDE was comparable with the other two methods in the unmatched sample situation, and the former was even slightly more powerful in the matched sample situation. When D>2, multiDE was evidently more powerful than the other methods including PLN-ANOVA, and the power gain steadily went up as the number of conditions increased.
Fig. 6.
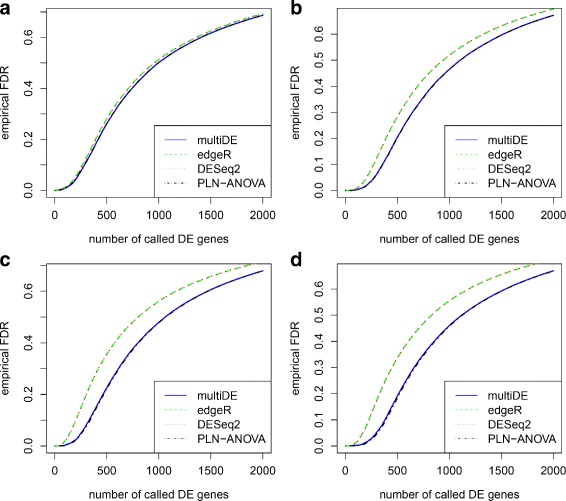
False discovery rates in matched sample situation. a D=2; b D=3; c D=4; d D=5
Fig. 7.
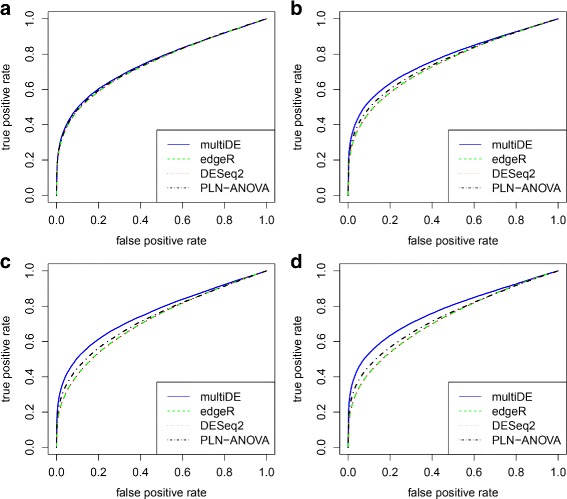
ROC curves in matched sample situation. a D=2; b D=3; c D=4; d D=5
Fig. 8.
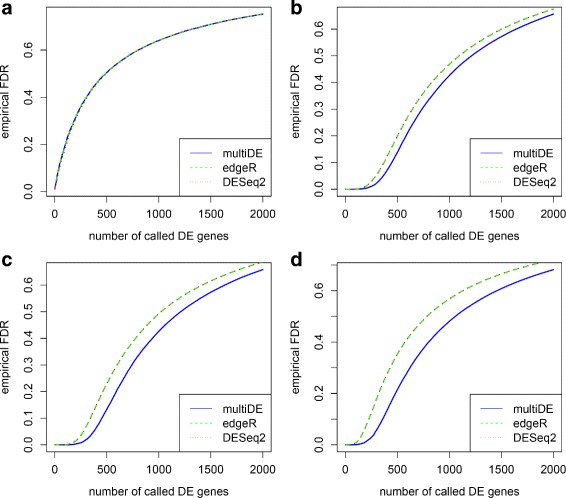
False discovery rates in unmatched sample situation. a D=2; b D=3; c D=4; d D=5
Fig. 9.
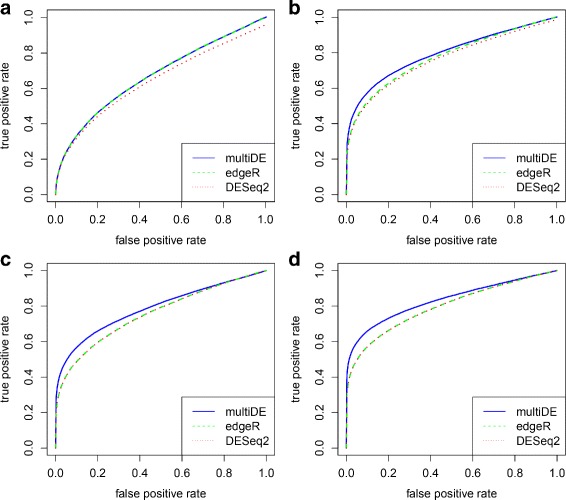
ROC curves in unmatched sample situation. a D=2; b D=3; c D=4; d D=5
Sensitivity analysis
The proposed method multiDE is based on model (1). In real situations, this model might not hold. Therefore, we conducted a sensitive analysis by generating data via the following model:
| 21 |
where γdg was generated from the uniform distribution on the interval (−0.75,0.75) for genes 9,001 through 10,000. Other parameters setting and data generation process were the same as before. We only present the results for unmatched sample situation since the results for matched sample situation were similar. Again, multiDE outperformed edgeR and DESeq2 in terms of both FDRs and ROC curves (Figs. 10 and 11). Interestingly, model misspecification did not alter the performance advantage of multiDE over the other methods.
Fig. 10.
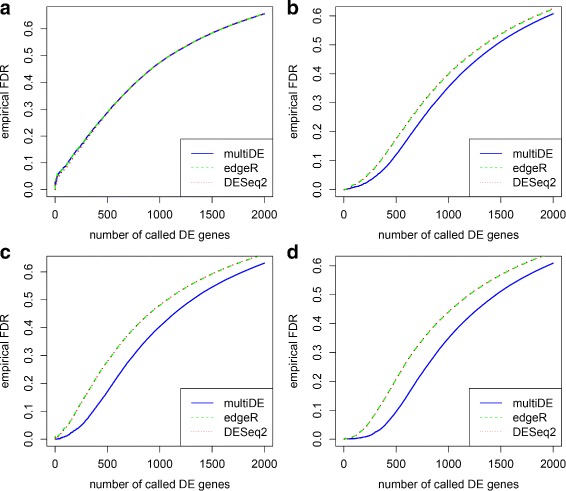
False discovery rates for model sensitivity analysis. a D=2; b D=3; c D=4; d D=5
Fig. 11.
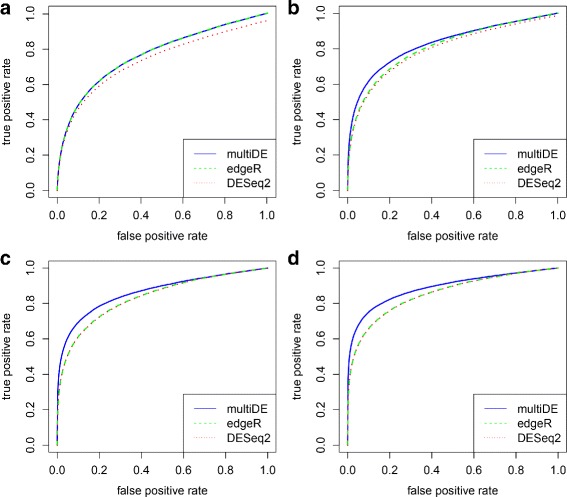
ROC curves for model sensitivity analysis. a D=2; b D=3; c D=4; d D=5
Real data analyses
In order to evaluate their relative performance on real data, multiDE, edgeR, and DESeq2 were applied to data from two biological experiments with multiple treatment conditions. Furthermore, PLN-ANOVA was applied to the first dataset with matched samples. In each of these two experiments, only a single sample was sequenced in each lane, so we only used between-lane normalization methods.
Psoriatic study
In this study, the major interest was to detect the influence of aryl hydrocarbon receptor (AhR) on RNA expression profiles of psoriatic lesion cells [18]. Each of eight patients were treated with culture treatment of DMSO (vehicle control), AhR agonist FICZ, and AhR antagonist CH-2233191. RNA-seq data were obtained using Illumina Genome Analyzer II platform for each of three treated lesion tissue samples. Therefore, this was a matched sample design. The RNA-seq read counts were derived from the GEO database (accession ID: GSE47944). We kept 13,416 genes with maximal read counts greater than 50 in each treatment condition.
With multiDE, the estimated ud for the three conditions (vehicle control, AhR agonist, and AhR antagonist) were 1, −4.20, and 3.20, respectively, which coincided with the fact that AhR-activating ligands reduced inflammation in the lesion of psoriasis patients and AhR antagonists upregulated inflammation.
At significance level 0.05, multiDE, PLN-ANOVA, edgeR, and DESeq2 identified 919, 836, 688, and 872 DE genes, respectively. After Bonferroni adjustment, multiDE, PLN-ANOVA, edgeR, and DESeq2 identified 39, 32, 17, and 24 DE genes, respectively (Fig. 12). Evidently, multiDE detected most DE genes. Of the five genes (BATF2, HRNR, SIGLEC1, SLC4A11, CXCL10) uniquely identified by multiDE (with Bonferroni adjustment), four were found to be closely related to psoriasis. In detail, BATF2 could induce the development of CD8 α+ dendritic cells, the most powerful antigen presenting cell during inflammation [19]. The up regulation of HRNR, which encoded granular layer keratin bundling proteins, was closely related to psoriatic lesions [20]. As a chemoattractant of a serial of immune cells, encoded protein of CXCL10 also played an important role in psoriatic immune abnormality [21].
Fig. 12.
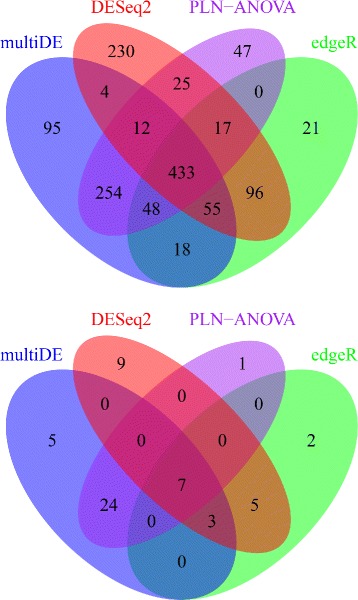
Number of identified DE genes in the psoriatic study. Upper panel: without Bonferroni adjustment; Down panel: with Bonferroni adjustment
It is well known that housekeeping genes maintain basic cellular functions, and they are expressed in all types of cells of an organism. Some typical housekeeping genes (eg., ACTB, GAPDH, NONO, PGK1, PPIH) have relatively constant expressions in most non-pathological situations [22], which can be used to evaluate the false positive performance of DE analysis methods. We found that the aforementioned five reference housekeeping genes were not identified to be DE genes by any of the four considered methods (Table 1).
Table 1.
P-values of DE analysis for five housekeeping genes in the psoriatic study
| Method | ACTB | GAPDH | NONO | PGK1 | PPIH |
|---|---|---|---|---|---|
| multiDE | 0.1081 | 0.3010 | 0.8429 | 0.1925 | 0.5984 |
| edgeR | 0.1814 | 0.2139 | 0.9340 | 0.1907 | 0.8923 |
| DESeq2 | 0.2247 | 0.1852 | 0.8984 | 0.1608 | 0.8084 |
| PLN-ANOVA | 0.1411 | 0.3862 | 0.8282 | 0.2563 | 0.6134 |
Embryonic stem cells study
The second dataset on a study of Homo sapiens hormone embryonic stem cells was downloaded from the NCBI GEO database (accession ID: GSE36552). To find causal relationship between gene expression network and cellular phenotype, Yan et al. derived embryonic stem cells from donated human pre-implantation embryos, prepared cDNA and sequenced them by Illumina HiSeq 2000 [23].
RNA-seq samples were obtained from the embryonic stem cells of nine unrelated individuals, so this was an unmatched design and PLN-ANOVA was not applicable. The embryonic stem cells were obtained at the 2-cell stage, three at the 4-cell stage, and the other three at the 8-cell stage. We aligned the downloaded RNA-seq reads to human reference genome hg19 (UCSC release) using the bioinformatics tool TopHat [24], and counted the reads for each gene using the Python program htseq-count [25]. Altogether, 6,526 genes with the maximal counts greater than 50 in each treatment condition were kept.
With multiDE, the estimated ud for the three conditions (2-cell stage, 4-cell stage, and 8-cell stage) were 1, 0.94 and, −1.94, respectively, indicating that the gene expression difference between the 2-cell and 8-cell stages could be generally large, while the difference between the 2-cell and the 4-cell stages was generally minor.
Presented in Fig. 13 are the numbers of DE genes identified by multiDE, edgeR, and DESeq2 at significance level 0.05 with or without Bonferroni adjustment. Among all three methods, multiDE detected most DE genes without Bonferroni adjustment, with a number of 3,392, compared with 3,038 and 3,195 by edgeR and DESeq2, respectively. With Bonferroni adjustment, DESeq2 identified most DE genes, with a number of 1,092, compared with 1,058 and 667 by multiDE and edgeR, respectively.
Fig. 13.
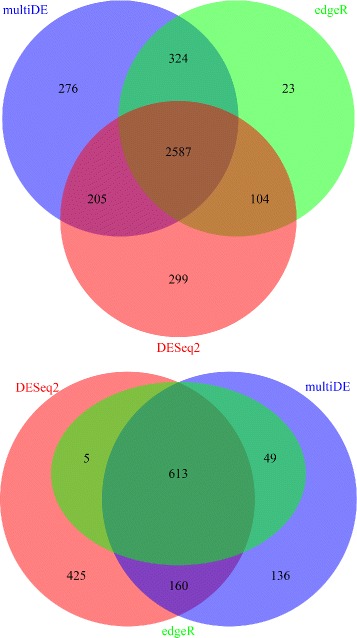
Number of identified DE genes in the embryonic stem cells study. Upper panel: without Bonferroni adjustment; Down panel: with Bonferroni adjustment
Using the identified DE genes (with Bonferroni adjustment), we then conducted GO analysis with DAVID [26, 27]. The numbers of identified GO terms are presented in Fig. 14. Evidently, multiDE enriched most GO terms, and the GO terms uniquely enriched by multiDE included protein catabolic process, protein ligase activity, and so on (Table 2). These uniquely enriched GO terms were found to be closely related to the development of embryo. First, ligases always play multiple important roles in embryo development. For instance, the deficiency of DNA Ligase IV in mice might lead to defective neurogenesis and embryonic lethality [28]. Besides, hSmurf1, a ubiquitin ligase, was shown to have the ability of controlling both embryonic development and a wide variety of cellular responses [29]. Second, the balance of metabolic and protein catabolic was in subtle poise during the development of embryo. As an alternative emergency way supplying energy, catabolism was of significant importance when embryos were facing the threat of nutrient deficiency, especially in their early stage [30]. Third, it was evident that the majority of human embryos donated for research were suffering from various cellular defects, thus the chance of innate embryo malnutrition would be greatly enhanced [31].
Fig. 14.
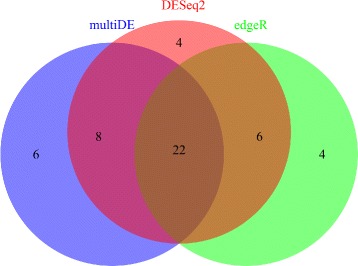
Number of detected GO terms using identified DE genes in the embryonic stem cells study
Table 2.
Exclusively enriched GO terms using identified DE genes in the embryonic stem cells study
| GO code1 | GO term description | P-value2 | |
|---|---|---|---|
| multiDE | GO:0030163 [BP] | Protein catabolic process | 1.72e-04 |
| GO:0044257 [BP] | Cellular protein catabolic | 5.60e-04 | |
| process | |||
| GO:0005829 [CC] | Cytosol | 4.00e-03 | |
| GO:0030530 [CC] | Nuclear ribonucleoprotein | 6.16e-03 | |
| complex | |||
| GO:0019787 [MF] | Small conjugating protein | 2.71e-02 | |
| ligase activity | |||
| GO:0031967 [CC] | Organelle envelope | 4.32e-02 | |
| edgeR | GO:0010468 [BP] | Regulation of gene expression | 1.29e-03 |
| GO:0022618 [BP] | Ribonucleoprotein complex | 1.27e-02 | |
| assembly | |||
| GO:0044452 [CC] | Nucleolar part | 1.61e-02 | |
| GO:0006413 [BP] | Translational initiation | 4.86e-02 | |
| DESeq2 | GO:0000279 [BP] | M phase | 1.31e-04 |
| GO:0005819 [CC] | spindle | 3.70e-04 | |
| GO:0030880 [CC] | RNA polymerase complex | 2.07e-03 | |
| GO:0006259 [BP] | DNA metabolic process | 2.83e-03 |
1[BP], biological process ontology; [CC], cellular component ontology; [MF], molecular function ontology.
2Bonferroni adjusted p-value
As in the psoriatic study, we used the five reference housekeeping genes to verify the performance of the above three DE methods. Since the gene NONO had maximal counts less than 50 in at least one treatment condition, we excluded this gene in the DE analyses. The other four genes (ACTB, GAPDH, PGK1, PPIH) were not identified to be DE genes using multiDE and edgeR. On the other hand, DESeq2 identified GAPDH as a DE gene (Table 3), suggesting that DESeq2 had more false positive findings.
Table 3.
P-values of DE analysis for four housekeeping genes in embryonic stem cells study
| Methods | ACTB | GAPDH | PGK1 | PPIH |
|---|---|---|---|---|
| multiDE | 0.5419 | 0.1064 | 0.2056 | 0.7460 |
| edgeR | 0.5351 | 0.1845 | 0.4914 | 0.9021 |
| DESeq2 | 0.6540 | 0.0151 | 0.6484 | 0.9666 |
Discussion
Models for fitting the distribution of read count data are essential for detecting DE genes. In experiments involving multiple conditions, it would be of great interest to detect those genes that are differentially expressed between at least two conditions. The traditional statistical methods are generally based on an ANOVA like framework, and the number of the degrees of freedom for detecting DE genes is equal to D−1 (D is the number of conditions). In this paper, we propose to reduce the number of the degrees of freedom from D−1 to one based on a new dimension reduced model. The new method multiDE based on this model can handle both matched and unmatched samples. If D>2, multiDE greatly outpermed the existing methods in our simulation studies, even if the model used to generate data was severely misspecified.
If only a single sample is sequenced in each lane, one needs only to correct the technical bias due to library size effect since the lane-specific efect can be absorbed into the library size factors. In multiDE, there are various options for estimating size factors. Four between-lane normalization methods (i.e., MEDIAN, TOTAL, QUANTILE, and TMM) can be used to estimate size factors. In our simulation study based on a real dataset, TMM slightly outperformed the other three normalization methods. Furthermore, in [14], TMM had been shown to be robust against outlying read counts and DE genes, and it outperformed other methods in simulation studies. Therefore, we recommend TMM in real data applications. If two or more samples are sequenced in the same lane, it would be advantageous to use any within-lane normalization method before between-lane normalization [12].
In multiDE, two methods implemented in edgeR and DESeq2 can be used to estimate dispersion parameters. The two dispersion estimation methods performed comparably in our simulation studies. When estimating ud, the size of gene set S can be specified to be the number of significant DE genes (after FDR adjustment) by any existing method such as edgeR or DESeq2.
Conclusions
In this paper, the new method multiDE is developed based on a dimension-reduced model for the purpose of detecting DE genes between multiple conditions. Through both simulation studies and real data applications, multiDE was shown to outperform the existing benchmark methods. The proposed method multiDE has been implemented in an R package. This package requires that each condition has at least two biological replications, it takes RNA-seq read counts as input data and can be used to estimate fold changes and to conduct Wald tests for detecting DE genes between various conditions. Three functions are provided in multiDE, namely normalization, dispersion, and multiDE, which can be used to calculate size factors using four normalization methods (i.e., MEDIAN, TOTAL, QUANTILE, and TMM), to estimate dispersion parameters using two methods provided in edgeR and DESeq2, respectively, and to calculate DE p-values and fold changes and their standard errors. Using a desktop computer with a 3.20GHz CPU, it took multiDE only a few seconds to analyze two real datasets.
Abbreviations
AhR, aryl hydrocarbon receptor; DE, differentially expressed; FDR, false discovery rate; NB, negative binomial; ROC, receiver operating characteristic
ᅟ
ᅟ
Funding
HZ was partially supported by the State Key Development Program for Basic Research of China 2012CB316505 and the National Natural Science Foundation of China 11371101.
Availability of data and materials
Source code repository: http://homepage.fudan.edu.cn/zhangh/softwares/multiDE/. Psoriatic study dataset: Downloaded from the GEO database with accession ID GSE47944. Embryonic stem cells study dataset: Downloaded from the GEO database with accession ID GSE36552.
Authors’ contributions
GK contributed to drafting the manuscript, developing the new statistical method, and analyzing both the simulation data and real data. LD contributed to analyzing the real data analysis and drafting the manuscript. HZ conceived the idea and designed the model. All authors read and approved the final manuscript.
Competing interests
The authors declare that they have no competing interests.
Consent for publication
Not applicable.
Ethics approval and consent to participate
Not applicable.
Contributor Information
Guangliang Kang, Email: 13210700107@fudan.edu.cn.
Li Du, Email: 14210700082@fudan.edu.cn.
Hong Zhang, Email: zhanghfd@fudan.edu.cn.
References
- 1.Mortazavi A, Williams BA, McCue K, Schaeffer L, Wold B. Mapping and quantifying mammalian transcriptomes by RNA-Seq. Nat Methods. 2008;5(7):621–8. doi: 10.1038/nmeth.1226. [DOI] [PubMed] [Google Scholar]
- 2.Bullard JH, Purdom E, Hansen KD, Dudoit S. Evaluation of statistical methods for normalization and differential expression in mRNA-Seq experiments. BMC Bioinformatics. 2010;11(1):94. doi: 10.1186/1471-2105-11-94. [DOI] [PMC free article] [PubMed] [Google Scholar]
- 3.Kvam VM, Liu P, Si Y. A comparison of statistical methods for detecting differentially expressed genes from RNA-seq data. Am J Bot. 2012;99(2):248–56. doi: 10.3732/ajb.1100340. [DOI] [PubMed] [Google Scholar]
- 4.Wang L, Feng Z, Wang X, Wang X, Zhang X. DEGseq: an R package for identifying differentially expressed genes from RNA-seq data. Bioinformatics. 2010;26(1):136–8. doi: 10.1093/bioinformatics/btp612. [DOI] [PubMed] [Google Scholar]
- 5.Anders S, Huber W. Differential expression analysis for sequence count data. Genome Biol. 2010;11(10):106. doi: 10.1186/gb-2010-11-10-r106. [DOI] [PMC free article] [PubMed] [Google Scholar]
- 6.Robinson MD, McCarthy DJ, Smyth GK. edgeR: a Bioconductor package for differential expression analysis of digital gene expression data. Bioinformatics. 2010;26(1):139–40. doi: 10.1093/bioinformatics/btp616. [DOI] [PMC free article] [PubMed] [Google Scholar]
- 7.Brandenberger R, Wei H, Zhang S, Lei S, Murage J, Fisk GJ, Li Y, Xu C, Fang R, Guegler K, et al. Transcriptome characterization elucidates signaling networks that control human ES cell growth and differentiation. Nat Biotechnol. 2004;22(6):707–16. doi: 10.1038/nbt971. [DOI] [PubMed] [Google Scholar]
- 8.Goldhirsch A, Wood W, Coates A, Gelber R, Thürlimann B, Senn HJ, et al. Strategies for subtypes–dealing with the diversity of breast cancer: highlights of the St Gallen International Expert Consensus on the Primary Therapy of Early Breast Cancer 2011. Ann Oncol. 2011;22(8):1736–47. doi: 10.1093/annonc/mdr304. [DOI] [PMC free article] [PubMed] [Google Scholar]
- 9.Zhang H, Xu J, Jiang N, Hu X, Luo Z. PLNseq: a multivariate Poisson lognormal distribution for high-throughput matched RNA-sequencing read count data. Stat Med. 2015;34(9):1577–89. doi: 10.1002/sim.6449. [DOI] [PubMed] [Google Scholar]
- 10.Jung Y, Huang JZ, Hu J. Biomarker detection in association studies: modeling SNPs simultaneously via logistic ANOVA. J Am Stat Assoc. 2014;109(508):1355–67. doi: 10.1080/01621459.2014.928217. [DOI] [PMC free article] [PubMed] [Google Scholar]
- 11.Trapnell C, Williams BA, Pertea G, Mortazavi A, Kwan G, Van Baren MJ, Salzberg SL, Wold BJ, Pachter L. Transcript assembly and quantification by RNA-Seq reveals unannotated transcripts and isoform switching during cell differentiation. Nat Biotechnol. 2010;28(5):511–5. doi: 10.1038/nbt.1621. [DOI] [PMC free article] [PubMed] [Google Scholar]
- 12.Risso D, Schwartz K, Sherlock G, Dudoit S. GC-content normalization for RNA-Seq data. BMC Bioinformatics. 2011;12(1):480. doi: 10.1186/1471-2105-12-480. [DOI] [PMC free article] [PubMed] [Google Scholar]
- 13.Li J, Witten DM, Johnstone IM, Tibshirani R. Normalization, testing, and false discovery rate estimation for rna-sequencing data. Biostatistics. 2011;13(3):523–38. doi: 10.1093/biostatistics/kxr031. [DOI] [PMC free article] [PubMed] [Google Scholar]
- 14.Robinson MD, Oshlack A, et al. A scaling normalization method for differential expression analysis of RNA-seq data. Genome Biol. 2010;11(3):25. doi: 10.1186/gb-2010-11-3-r25. [DOI] [PMC free article] [PubMed] [Google Scholar]
- 15.Ruppert D, Wand MP. Multivariate locally weighted least squares regression. Ann Stat. 1994;22(3):1346–70. doi: 10.1214/aos/1176325632. [DOI] [Google Scholar]
- 16.Olkin I, Pratt JW. Unbiased estimation of certain correlation coefficients. Ann Math Stat. 1958;29(1):201–11. doi: 10.1214/aoms/1177706717. [DOI] [Google Scholar]
- 17.Kojadinovic I, Yan J, et al. Modeling multivariate distributions with continuous margins using the copula R package. J Stat Softw. 2010;34(9):1–20. doi: 10.18637/jss.v034.i09. [DOI] [Google Scholar]
- 18.Di Meglio P, Duarte JH, Ahlfors H, Owens ND, Li Y, Villanova F, Tosi I, Hirota K, Nestle FO, Mrowietz U, Gilchrist MJ, Stockinger B. Activation of the aryl hydrocarbon receptor dampens the severity of inflammatory skin conditions. Immunity. 2014;40(6):989–1001. doi: 10.1016/j.immuni.2014.04.019. [DOI] [PMC free article] [PubMed] [Google Scholar]
- 19.Pasparakis M, Haase I, Nestle FO. Mechanisms regulating skin immunity and inflammation. Nat Rev Immunol. 2014;14(5):289–301. doi: 10.1038/nri3646. [DOI] [PubMed] [Google Scholar]
- 20.Roberson ED, Bowcock AM. Psoriasis genetics: breaking the barrier. Trends Genet. 2010;26(9):415–23. doi: 10.1016/j.tig.2010.06.006. [DOI] [PMC free article] [PubMed] [Google Scholar]
- 21.Nomura I, Gao B, Boguniewicz M, Darst MA, Travers JB, Leung DY. Distinct patterns of gene expression in the skin lesions of atopic dermatitis and psoriasis: a gene microarray analysis. J Allergy Clin Immunol. 2003;112(6):1195–202. doi: 10.1016/j.jaci.2003.08.049. [DOI] [PubMed] [Google Scholar]
- 22.Zhu J, He F, Hu S, Yu J. On the nature of human housekeeping genes. Trends Genet. 2008;24(10):481–4. doi: 10.1016/j.tig.2008.08.004. [DOI] [PubMed] [Google Scholar]
- 23.Yan L, Yang M, Guo H, Yang L, Wu J, Li R, Liu P, Lian Y, Zheng X, Yan J, et al. Single-cell RNA-Seq profiling of human preimplantation embryos and embryonic stem cells. Nat Struct Mol Biol. 2013;20(9):1131–9. doi: 10.1038/nsmb.2660. [DOI] [PubMed] [Google Scholar]
- 24.Trapnell C, Pachter L, Salzberg SL. TopHat: discovering splice junctions with RNA-Seq. Bioinformatics. 2009;25(9):1105–11. doi: 10.1093/bioinformatics/btp120. [DOI] [PMC free article] [PubMed] [Google Scholar]
- 25.Anders S, Pyl PT, Huber W. HTSeq–A Python framework to work with high-throughput sequencing data. Bioinformatics. 2004;31(2):166–169. doi: 10.1093/bioinformatics/btu638. [DOI] [PMC free article] [PubMed] [Google Scholar]
- 26.Huang D, Sherman BT, Lempicki RA. Systematic and integrative analysis of large gene lists using DAVID bioinformatics resources. Nat Protoc. 2008;4(1):44–57. doi: 10.1038/nprot.2008.211. [DOI] [PubMed] [Google Scholar]
- 27.Huang DW, Sherman BT, Lempicki RA. Bioinformatics enrichment tools: paths toward the comprehensive functional analysis of large gene lists. Nucleic Acids Res. 2009;37(1):1–13. doi: 10.1093/nar/gkn923. [DOI] [PMC free article] [PubMed] [Google Scholar]
- 28.Frank KM, Sharpless NE, Gao Y, Sekiguchi JM, Ferguson DO, Zhu C, Manis JP, Horner J, DePinho RA, Alt FW. DNA ligase IV deficiency in mice leads to defective neurogenesis and embryonic lethality via the p53 pathway. Mol Cell. 2000;5(6):993–1002. doi: 10.1016/S1097-2765(00)80264-6. [DOI] [PubMed] [Google Scholar]
- 29.Zhu H, Kavsak P, Abdollah S, Wrana JL, Thomsen GH. A SMAD ubiquitin ligase targets the BMP pathway and affects embryonic pattern formation. Nature. 1999;400(6745):687–93. doi: 10.1038/23293. [DOI] [PubMed] [Google Scholar]
- 30.Jurisicova A, Acton BM. Deadly decisions: the role of genes regulating programmed cell death in human preimplantation embryo development. Reproduction. 2004;128(3):281–91. doi: 10.1530/rep.1.00241. [DOI] [PubMed] [Google Scholar]
- 31.Antczak M, Van Blerkom J. Temporal and spatial aspects of fragmentation in early human embryos: possible effects on developmental competence and association with the differential elimination of regulatory proteins from polarized domains. Hum Reprod. 1999;14(2):429–47. doi: 10.1093/humrep/14.2.429. [DOI] [PubMed] [Google Scholar]
Associated Data
This section collects any data citations, data availability statements, or supplementary materials included in this article.
Data Availability Statement
Source code repository: http://homepage.fudan.edu.cn/zhangh/softwares/multiDE/. Psoriatic study dataset: Downloaded from the GEO database with accession ID GSE47944. Embryonic stem cells study dataset: Downloaded from the GEO database with accession ID GSE36552.


