

Abstract
Importance
Statins decrease low-density lipoproteins, triglycerides, and cardiovascular events, but increase the risk of being diagnosed with diabetes. The risk factors associated with incident diabetes are incompletely characterized.
Objective
To investigate the association of lipoprotein subclasses and size, and a novel lipoprotein insulin resistance (LPIR) score (a composite of six lipoprotein measures), with incident diabetes among individuals randomized to high-intensity statin or placebo.
Design
JUPITER was an international, randomized, double-blind, placebo-controlled trial. A prespecified secondary aim was to assess the effect of rosuvastatin on diabetes, and incident diabetes was monitored for a median of 2.0 years.
Setting
The study was conducted at 1315 sites in 26 countries.
Participants
JUPITER comprised 17802 men ≥50 years and women ≥60 years with LDL cholesterol <130 mg/dL, hsCRP ≥2 mg/L, and triglycerides <500mg/dL. Those with diabetes were excluded.
Intervention
Rosuvastatin, 20mg daily, or placebo.
Main Outcomes and Measures
Among 11918 participants in JUPITER, we measured baseline size and concentration of lipids, apolipoproteins, and lipoproteins and, in 9180 of these, at 12 months after randomization to rosuvastatin or placebo. LPIR score, a correlate of insulin resistance, was calculated as a weighted combination of size and concentration of LDL, very low-density lipoprotein(VLDL), and high-density lipoprotein(HDL) particles.
Results
Rosuvastatin lowered LDL particles(−49%), VLDL particles(−20%), and triglycerides(−15%), and shifted the lipoprotein subclass distribution towards smaller LDL size(−2%), larger VLDL size(3%), and lower LPIR score(−3%). In analyses adjusted for age, sex, race/ethnic origin, exercise, education, family history, and smoking, the hazard ratio for diabetes per standard deviation of LPIR score was 1.99 (1.64–2.42) in placebo and 2.06 (1.74–2.43) in rosuvastatin-allocated individuals. After additional adjustment for systolic blood pressure, body-mass index, hsCRP, glycated hemoglobin, HDL-cholesterol, LDL-cholesterol, and triglycerides, LPIR score remained associated with diabetes in placebo- (1.35[1.03–1.76]) and rosuvastatin-allocated individuals (1.60[1.27–2.03]). Similar trends were seen at 12 months. LPIR score improved the model likelihood ratio (chi-squared = 18.23, p<0.001) and categorical net reclassification index (0.039[0.003, 0.072]; non-events[0.036]; events[0.002]). The c-statistic and integrated discrimination improvement index did not improve.
Conclusions and Relevance
In apparently healthy people, LPIR score, a measure of lipoprotein insulin resistance, was positively associated with incident diabetes including during rosuvastatin therapy.
Statins substantially reduce cardiovascular events1–3, but are associated with an increased risk of being diagnosed with type 2 diabetes2–7. Statin users who develop diabetes very often have evidence of prior impaired fasting glucose, features of insulin resistance, or the metabolic syndrome8,9, factors that also predispose to the development of diabetes in statin-naïve individuals10. Identifying statin users at risk for diabetes has gained greater significance as recent cholesterol guidelines11 could increase the global prescription of statins.
Both insulin resistance and diabetes are associated with lipoprotein profile changes12–16 that precede the appearance of overt hyperglycemia. Lipoprotein particles are categorized according to density into low-density lipoproteins (LDL), high-density lipoproteins (HDL), and very low-density lipoproteins (VLDL), and these are further categorized on the basis of particle size and concentration (or, number). Non-randomized observational studies focusing predominantly on statin-naïve populations have reported positive associations of diabetes with higher particle concentrations of small LDL, small HDL, and large VLDL, and inverse associations of diabetes with large LDL and large HDL12–18, underscoring the complex and incompletely characterized association of lipoproteins with insulin resistance and diabetes. To date, there are no studies examining the various lipoprotein characteristics that precede the onset of diabetes among individuals randomly allocated to statin therapy versus placebo.
In order to address these issues, we used nuclear magnetic resonance (NMR) spectroscopy, immunoassay-measured apolipoproteins, and standard lipid measurements to comprehensively characterize the lipoprotein profiles at baseline and 12 months after randomization to rosuvastatin 20 mg daily or placebo in the Justification for the Use of Statins in Prevention: an Intervention Trial Evaluating Rosuvastatin (JUPITER) study. JUPITER is a primary prevention trial of individuals without prior cardiovascular disease or diabetes but with elevated high-sensitivity C-reactive protein (hsCRP) and low LDL cholesterol who were followed prospectively for incident cardiovascular events2. A prespecified secondary aim of the JUPITER trial was to assess the effect of rosuvastatin on incident diabetes9. After the trial was completed but before obtaining NMR measurements, we prespecified the hypothesis that lipoprotein insulin resistance (LPIR) score, which reflects lipoprotein derangements of insulin resistance, would be associated with incident diabetes in placebo- and rosuvastatin-allocated individuals. LPIR score combines six measures of LDL, VLDL, and HDL particle size and concentration, and incorporates lipoprotein characteristics that previously have been individually associated with diabetes and/or insulin resistance12–16,18. LPIR score is more strongly correlated with diabetes19 and insulin resistance (measured by the homeostasis model assessment of insulin resistance [HOMA-IR]) than each of its six subclasses individually, and has been proposed to better reflect the complex biology and regulation of lipoproteins20. Here, we describe the prospective association of individual lipoprotein measures and LPIR score with incident diabetes according to randomized treatment allocation.
RESEARCH DESIGN AND METHODS
Study Design
JUPITER was a randomized, double-blind, placebo-controlled, trial conducted at 1315 sites in 26 countries2,21. The study protocol was approved by the institutional review board at Brigham and Women's Hospital, Boston, USA, and at participating centers. The effect of rosuvastatin on incident diabetes was a prespecified secondary aim of JUPITER. We used a randomized study design to elucidate possible unique associations between baseline lipoproteins and incident diabetes before and after randomization to rosuvastatin versus placebo.
Study Population
JUPITER was a primary prevention trial of 17802 apparently healthy men and women, who were eligible if they had LDL cholesterol <130 mg/dL, hsCRP ≥2 mg/L, and triglycerides <500 mg/dL. As incident diabetes was a prespecified secondary aim of JUPITER, exclusion criteria of the trial included pre-existing diabetes, defined as fasting glucose of 126 mg/dL or higher at screening visit two or by the use of insulin and/or an oral hypoglycemic agent. Other trial requirements included a willingness to participate for the duration of the study and the ability to provide written consent.2 There were 8901 subjects each in the placebo and rosuvastatin arms. Study participants were requested to provide a blood sample at baseline and 12 months after randomization; a total of 11918 samples had plasma to obtain complete NMR lipoprotein measurements at baseline, and of these, 9180 samples had plasma for 12 month measurements. Incident diabetes cases were tracked throughout the study period (see Statistical Analysis, below) and were physician reported, as described2,9.
Laboratory Measurements
We measured plasma lipids, lipoproteins, apolipoproteins, hsCRP, and glycated hemoglobin as described2,22,23. LDL cholesterol was calculated using the Friedewald equation (for serum triglyceride <400 mg/dL) or measured by ultracentrifugation (for serum triglyceride ≥ 400 mg/dL)23,24. Lipoprotein particle concentration and average particle size of LDL, HDL, and VLDL particles were determined by NMR spectroscopy at LipoScience (now LabCorp)13,25. LPIR score is a weighted combination of six lipoprotein subclass measures and reflects the concentrations of large VLDL, large HDL, and small LDL particles, and average size of VLDL, LDL, and HDL particles. LPIR score ranges from 0 (most insulin sensitive) to 100 (most insulin resistant).
Calculation of Lipoprotein Insulin Resistance (LPIR) Score
The LPIR score was developed as described20 and in eMethod 1. Briefly, using HOMA-IR measurements for guidance, the six NMR-measured lipoprotein parameters, known to be associated with insulin resistance, were combined to produce a multiplex LPIR score that ranges from 0 (most insulin sensitive) to 100 (most insulin resistant). The algorithm used to generate LPIR divides the six lipoprotein parameters into several particle concentration or size categories, assigns each a numerical weighting score, and sums these to produce the LPIR score. The weighting scores were chosen empirically to reflect the strength and independence of each parameter's association with HOMA-IR in the MESA study population20. Accordingly, average VLDL particle size and concentration of large VLDL particles were assigned the greatest weighting scores (32 and 22, respectively) followed by average HDL particle size (20), concentration of large HDL particles (12), concentration of small LDL particles (8) and average LDL particle size (6). This combination of six lipoprotein parameters was more strongly related to insulin resistance than any of the individual parameters or the triglyceride to HDL cholesterol ratio.
Statistical Analysis
Analyses were performed using SAS 9.3 (SAS Institute Inc., Cary, NC). Spearman coefficients were used to quantify correlations. Diabetes incidence rates were calculated per 100-person years, and exposure time was calculated as the time from randomization to occurrence of the endpoint, or to a participant's last blinded follow-up visit, a process that concluded in August 2008, six months after the primary JUPITER trial was ended by the Data and Safety Monitoring Board9. Cox proportional-hazards models were used to estimate hazard ratios (HRs) and 95% confidence intervals (95% CIs) to compare the risk of diabetes according to tertiles and per one standard deviation of lipoprotein measures using separate models for each measure. To allow for comparison across groups, HRs were calculated using the standard deviation (SD) of baseline levels among all participants. Cox-proportional-hazard models were adjusted for age, sex, self-reported race or ethnic origin, education, exercise, family history of diabetes, and self-reported smoking in the prior month (Model 1). Race or ethnic origin was assessed to explain possible heterogeneity in the risk of developing diabetes. To account for lipoprotein correlations with each other and with metabolic variables, Model 1 was further adjusted for systolic blood pressure, BMI, glycated hemoglobin, LDL-cholesterol and HDL-cholesterol, log-transformed triglycerides, and log-transformed hsCRP (Model 2). Metabolic syndrome was defined according to consensus criteria of the American Heart Association and the National Heart, Lung, and Blood Institute2. The probability value for linear trend was obtained by using the median value for each tertile. Statistical tests for interaction between categorical LPIR score and treatment allocation in relation to outcomes were obtained by use of likelihood ratio tests. Statistical significance was established at two-tailed p<0.05. The contribution of LPIR score to the prediction of diabetes in models with traditional risk factors was evaluated by likelihood ratio chi-squares, discrimination (Harrell's C-statistic)26, relative integrated discrimination improvement index (IDI) 27, and net reclassification index (NRI) 28 (eMethod 2).
Conversion Factors
To convert values for LDL, IDL, VLDL, HDL, total cholesterol, and non-HDL cholesterol [calculated as the difference between total cholesterol and HDL cholesterol] from mg/dL to mmol/l, multiply by 0.02586. To convert values for triglycerides from mg/dL to mmol/l, multiply by 0.01129. To convert values for glucose from mg/dL to mmol/l, multiply by 0.05551.
RESULTS
Baseline Characteristics
In this study, a total of 370 (3.1%) individuals were diagnosed with diabetes during a median follow-up period of 2.0 years (IQR 1.6–2.5). There were 158 and 212 cases in the placebo and rosuvastatin arms, respectively. The incidence rate was higher among individuals allocated to rosuvastatin (1.64 per 100 person-years; 95% confidence interval [CI], 1.43–1.87) versus placebo (1.17 per 100 person-years; 95% CI 1.00–1.36). Compared with the overall study population and with those excluded from this study, the current study population had a higher proportion of Caucasians, while other characteristics were generally similar (eTable 1A, Supplement). Increasing tertiles of LPIR score (i.e., higher insulin resistance) were associated with a higher prevalence of clinical risk factors including metabolic syndrome, triglycerides, hypertension, and lower HDL cholesterol, although LDL cholesterol was similar (Table 1; eTable 1B, Supplement). Compared with those who did not develop diabetes, individuals who developed diabetes had a higher prevalence of clinical risk factors including impaired fasting glucose, elevated glycated hemoglobin, family history of diabetes, metabolic syndrome, body-mass index, higher LDL particles, VLDL particles and triglycerides, and LPIR scores (eTable 1C and 1D, Supplement).
Table 1.
Baseline Characteristics of Current Study Participants, According to LPIR Score
| Lower Tertile (n=4002) | Middle Tertile (n=4076) | Upper Tertile (n=3840) | |
|---|---|---|---|
| Age (years) | 68 (63–73) | 66 (60–71) | 64 (58–69) |
| Women | 2012 (50.3) | 1558 (38.2) | 764 (19.9) |
| Rosuvastatin | 2019 (50.5) | 1985 (48.7) | 1905 (49.6) |
| Ethnic Origin | |||
| White | 3217 (80.4) | 3219 (80.7) | 3342 (87.1) |
| Black | 411 (10.3) | 252 (6.2) | 79 (2.1) |
| Asian | 61 (1.5) | 67 (1.6) | 49 (1.3) |
| Hispanic | 267 (6.7) | 432 (10.6) | 361 (9.4) |
| Other | 45 (1.1) | 34 (0.8) | 8 (0.2) |
| Current smoker | 593 (14.8) | 594 (14.6) | 566 (14.8) |
| Hypertension | 2145 (53.6) | 2268 (55.7) | 2264 (59.0) |
| Metabolic syndrome | 698 (17.6) | 1609 (39.8) | 2578 (67.5) |
| BMI (kg/m2) | 26.7 (23.8–30.1) | 28.6 (25.9–32.1) | 30.0 (27.3–33.3) |
| Family history of diabetes | 886 (23.5) | 984 (25.6) | 998 (27.3) |
| Highest level of education | |||
| Up to high school | 2335 (58.4) | 2330 (57.2) | 1932 (50.3) |
| Some college | 735 (18.4) | 777 (19.1) | 866 (22.6) |
| College graduate | 589 (14.7) | 610 (15.0) | 614 (16.0) |
| Post graduate | 341 (8.5) | 355 (8.7) | 426 (11.1) |
| Exercise | |||
| Rare or never | 1988 (49.7) | 2029 (49.8) | 1865 (48.6) |
| Once or less per week | 480 (12.0) | 493 (12.1) | 544 (14.2) |
| Two to three times per week | 742 (18.6) | 730 (17.9) | 732 (19.1) |
| Four to seven times per week | 790 (19.8) | 822 (20.1) | 698 (18.2) |
| Fasting glucose (mg/dL) | 92 (86–99) | 95 (89–102) | 97 (90–105) |
| Glycated hemoglobin (%) | 5.6 (5.4–5.9) | 5.7 (5.4–5.9) | 5.7 (5.4–5.9) |
| hsCRP (mg/L) | 4.1 (2.7–7.0) | 4.2 (2.8–7.0) | 4.0 (2.8–6.3) |
| LDL cholesterol (mg/dL) | 109 (95–119) | 110 (96–120) | 109 (95–119) |
| HDL cholesterol (mg/dL) | 61 (57–71) | 49 (42–57) | 41 (36–47) |
| Triglycerides (mg/dL) | 87 (69–111) | 119 (93–157) | 173 (130–237) |
| Triglyceride/HDL cholesterol ratio | 1.45 (1.05–1.98) | 2.40 (1.77–3.38) | 4.24 (2.96–6.18) |
| Non-HDL cholesterol (mg/dL) | 127 (113–139) | 135 (120–146) | 144 (130–157) |
| Apolipoprotein B (mg/dL) | 102 (91–112) | 109 (97–121) | 118 (106–130) |
Data are median (IQR) or n (%). Percentages may not add up because of rounding off. BMI body-mass index; hsCRP high sensitivity C-reactive protein; LDL low-density lipoprotein; HDL high-density lipoprotein.
p<0.001 with exception of rosuvastatin (p=0.29), current smoker (p=0.95), exercise (p=0.082), hsCRP (p=0.002), and LDL cholesterol (p=0.18), from Wilcoxon rank sum test for quantitative variables and χ2 tests for qualitative variables.
LPIR tertiles as follows: lower tertile (score of 40 or lower); middle tertile (41-62); upper tertile (score of 62 or higher).
Effect of Rosuvastatin Associated with Lipoprotein Measures
Rosuvastatin lowered LDL cholesterol (49%), triglycerides (15%), non-HDL cholesterol (43%), apolipoprotein B (39%), and LPIR score (3%), and raised HDL cholesterol (6%) (Table 2). In addition, rosuvastatin lowered the concentrations of LDL and VLDL particles, and increased HDL particles; these effects differed by particle subclasses, resulting in overall smaller average size for LDL particles and larger size for VLDL and HDL particles (p<0.001 for all comparisons) (Table 2). The Spearman coefficients of LPIR score with lipoprotein particle subclasses were generally similar at baseline and after 12 months of rosuvastatin therapy (eTable 2, Supplement).
Table 2.
Lipid and Lipoprotein Measures at Baseline and at 12 Months, According to Randomized Treatment Arm*
| Baseline | 12 monthsa | Changeb | Percent Change | ||
|---|---|---|---|---|---|
| LDL cholesterol–mg/dL | Placebo | 110 (96, 119) | 111 (96, 125) | 3 (–8, 15) | 2.7 (–7.4, 14.4) |
| Rosuvastatin | 109 (96, 120) | 55 (44, 71) | –51 (–64, –31) | –49.0 (–58.2, –32.7) | |
| HDL cholesterol–mg/dL | Placebo | 49 (41, 60) | 50 (42, 61) | 1 (–3, 5) | 1.7 (–6.7, 10.8) |
| Rosuvastatin | 49 (41, 59) | 52 (43, 64) | 3 (–1, 8) | 6 (–3, 17) | |
| Triglycerides–mg/dL | Placebo | 119 (87, 168) | 119 (89, 166) | 2 (–24, 25) | 1.2 (–18.4, 24.7) |
| Rosuvastatin | 120 (88, 171) | 102 (77, 139) | –17 (–48, 5) | –15.4 (–32.8, 5.3) | |
| Triglyceride/HDL cholesterol ratio | Placebo | 2.4 (1.5, 3.9) | 2.4 (1.6, 3.7) | –0.01 (–0.6, 0.5) | –0.3 (–22.6, 28.1) |
| Rosuvastatin | 2.4 (1.6, 3.9) | 1.9 (1.3, 3.0) | –0.4 (–1.2, 0.1) | –21.0 (–39.4, 3.0) | |
| Non-HDL cholesterol–mg/dL | Placebo | 135 (121, 147) | 138 (121, 154) | 3 (–9, 16) | 2.4 (–6.3, 12.0) |
| Rosuvastatin | 135 (121, 148) | 77 (65, 96) | –56 (–71, –34) | –42.7 (–51.0, –27.6) | |
| Apolipoprotein B–mg/dL | Placebo | 110 (97, 122) | 106 (93, 119) | –3 (–13, 7) | –2.9 (–11.6, 6.3) |
| Rosuvastatin | 110 (97, 123) | 66 (57, 81) | –42 (–54, –27) | –39.4 (–47.6, –26.7) | |
| LPIR score | Placebo | 51 (35, 67) | 53 (35, 69) | 1 (–8, 10) | 2.8 (–15.1, 23.9) |
| Rosuvastatin | 52 (35, 68) | 49 (34, 65) | –2 (–11, 7) | –3.2 (–20.6, 16.9) | |
| Total LDL particles–nmol/l | Placebo | 1281 (1089, 1476) | 1224 (1044, 1427) | –52 (–197, 95) | –4.2 (–14.6, 8.2) |
| Rosuvastatin | 1274 (1101, 1484) | 771 (633, 964) | –487 (–674, –283) | –39.6 (–49.4, –24.6) | |
| Large | Placebo | 457 (306, 602) | 438 (276, 586) | –20 (–143, 103) | –5.3 (–31.1, 27.3) |
| Rosuvastatin | 462 (304, 600) | 175 (93, 306) | –238 (–392, –70) | –57.5 (–77.3, –24.2) | |
| Small | Placebo | 611 (448, 841) | 596 (440, 828) | –14 (–159, 127) | –2.6 (–22.9, 23.2) |
| Rosuvastatin | 608 (446, 848) | 494 (374, 625) | –127 (–318, 19) | –22.0 (–42.8, 4.7) | |
| IDL | Placebo | 151 (96, 220) | 139 (85, 201) | –14 (–83, 56) | –10.6 (–45.4, 49.1) |
| Rosuvastatin | 157 (99, 225) | 83 (52, 124) | –68 (–138, –4) | –46.0 (–69.4, –4.5) | |
| LDL particle average size–nm | Placebo | 21.0 (20.5, 21.4) | 21.0 (20.5, 21.3) | 0 (–0.3, 0.3) | 0 (–1.5, 1.4) |
| Rosuvastatin | 21.0 (20.5, 21.4) | 20.6 (20.2, 21.0) | –0.3 (–0.8, 0.1) | –1.5 (–3.7, 0.5) | |
| Total VLDL particles–nmol/l | Placebo | 43.8 (30.1, 58.5) | 44.0 (31.0, 60.8) | 1.2 (–10.0, 13.0) | 3.5 (–21.8, 35.4) |
| Rosuvastatin | 43.3 (29.9, 58.8) | 33.8 (23.5, 46.7) | –8.5 (–20.4, 3.2) | –19.6 (–40.6, 10.3) | |
| Large | Placebo | 2.8 (1.3, 4.9) | 2.9 (1.3, 5.6) | 0.2 (–1.0, 1.6) | 8.0 (–35.7, 76.5) |
| Rosuvastatin | 2.8 (1.4, 5.0) | 2.2 (1.1, 4.2) | –0.3 (–1.7, 0.7) | –15.4 (–50.0, 40.0) | |
| Medium | Placebo | 11.8 (6.8, 18.6) | 13.6 (7.6, 22.4) | 1.9 (–3.2, 8.0) | 16.6 (–26.6, 86.8) |
| Rosuvastatin | 11.6 (6.8, 18.6) | 10.9 (6.5, 17.1) | –0.7 (–6.0, 4.4) | –7.0 (–43.0, 52.2) | |
| Small | Placebo | 27.1 (17.3, 38.1) | 25.0 (16.3, 36.4) | –1.4 (–12.0, 9.2) | –6.1 (–37.6, 43.2) |
| Rosuvastatin | 26.6 (17.0, 38.5) | 19.4 (12.4, 28.0) | –6.9 (–17.4, 3.0) | –26.7 (–53.2, 16.4) | |
| VLDL particle average size–nm | Placebo | 49.0 (44.2, 53.7) | 49.3 (44.6, 54.9) | 0.6 (–3.7, 5.0) | 1.3 (–7.3, 10.9) |
| Rosuvastatin | 49.0 (44.3, 54.1) | 50.2 (46.1, 55.1) | 1.4 (–3.0, 5.9) | 2.8 (–5.8, 12.7) | |
| VLDL triglycerides–mg/dL | Placebo | 62.3 (42.7, 87.7) | 64.0 (44.2, 94.0) | 3.1 (–12.1, 20.2) | 5.6 (–18.8, 35.8) |
| Rosuvastatin | 62.3 (43.5, 88.3) | 51.6 (36.5, 74.5) | –9.0 (–26.0, 5.5) | –15.2 (–35.9, 11.3) | |
| HDL particles–μmol/l | Placebo | 32.3 (28.5, 36.7) | 31.6 (27.8, 35.6) | –0.9 (–3.4, 1.7) | –3.0 (–10.1, 5.4) |
| Rosuvastatin | 32.4 (28.5, 36.5) | 33.7 (29.8, 38.0) | 1.3 (–1.5, 4.3) | 4.1 (–4.5, 13.9) | |
| Very large | Placebo | 2.0 (1.1, 3.5) | 1.9 (1.0, 3.5) | –0.1 (0.7, 0.6) | –2.3 (–31.3, 33.3) |
| Rosuvastatin | 2.0 (1.1, 3.4) | 2.5 (1.4, 4.2) | 0.5 (–0.3, 1.3) | 22.9 (–12.4, 74.1) | |
| Large | Placebo | 5.6 (4.2, 7.5) | 5.4 (4.0, 7.2) | –0.2 (–1.7, 1.1) | –4.5 (–26.6, 23.7) |
| Rosuvastatin | 5.7 (4.1, 7.5) | 5.7 (4.3, 7.5) | 0.1 (–1.5, 1.6) | 1.1 (–23.2, 33.2) | |
| Medium | Placebo | 4.8 (3.0, 7.0) | 4.6 (2.7, 6.8) | –0.3 (–2.4, 1.9) | –8.6 (–42.1, 50.6) |
| Rosuvastatin | 4.8 (3.0, 7.0) | 5.5 (3.4, 7.9) | 0.6 (–1.7, 3.0) | 12.5 (–30.6, 79.2) | |
| Small | Placebo | 5.0 (3.0, 7.7) | 5.8 (3.3, 8.7) | 0.6 (–1.8, 3.1) | 10.9 (–32.8, 80.1) |
| Rosuvastatin | 4.9 (2.9, 7.5) | 6.5 (3.8, 9.8) | 1.3 (–1.2, 4.3) | 28.6 (–22.4, 112.4) | |
| Very small | Placebo | 13.2 (10.5, 16.0) | 12.2 (9.5, 14.9) | –1.0 (–3.3, 1.2) | –7.6 (–23.1, 10.0) |
| Rosuvastatin | 13.3 (10.5, 15.9) | 11.7 (8.6, 14.7) | –1.5 (–4.0, 0.9) | –11.4 (–29.0, 7.1) | |
| HDL particle average size–nm | Placebo | 9.0 (8.6, 9.3) | 9.0 (8.6, 9.3) | 0 (–0.2, 0.2) | 0 (–2.2, 2.2) |
| Rosuvastatin | 9.0 (8.6, 9.3) | 9.1 (8.7, 9.5) | 0.1 (–0.1, 0.3) | 1.2 (–1.0, 3.6) |
To convert values for LDL (low-density lipoprotein), IDL (intermediate-density lipoprotein), VLDL (very low-density lipoprotein), HDL (high-density lipoprotein), and non-HDL cholesterol [calculated as the difference between total cholesterol and HDL cholesterol] to millimoles per liter, multiply by 0.02586. To convert values for triglycerides to millimoles per liter, multiply by 0.01129.
P values from the Wilcoxon signed rank test comparing baseline and 12 months values were statistically different (P<0.001), with the exception of triglycerides (P=0.17), triglyceride/HDL cholesterol ratio (P=0.74), very large HDL particles (P=0.002), and HDL particle average size (P=0.99) in the placebo group; and, among very large HDL particles (P=0.05) in the rosuvastatin group.
P values from Wilcoxon rank sum test comparing change among the rosuvastatin group with change among the placebo group were p<0.001 for all. Values obtained from individuals with baseline and 12-month measurements (N=9,180).
Lipoprotein Measures, LPIR Score, and Incident Diabetes
Among placebo- and rosuvastatin-allocated individuals, incident diabetes was inversely associated with baseline concentrations of LDL and HDL cholesterol, and positively associated with triglycerides, apolipoprotein B, and LPIR score (Figure 1A; eTable 3A, Supplement). In analyses adjusted for age, sex, race/ethnic origin, education, exercise, family history, and smoking (Model 1), the HR per SD of LPIR score was 1.99 (1.64–2.42; p<0.001) in placebo and 2.06 (1.74–2.43; p<0.001) in rosuvastatin-allocated individuals (Figure 1A; eTable 3A, Supplement). Substituting fasting glucose for glycated hemoglobin somewhat attenuated the association between LPIR score and diabetes in placebo (1.55 [1.27–1.90; p<0.001]) and rosuvastatin-allocated individuals (1.63 [1.38–1.93; p<0.001]). Additionally adjusting for systolic blood pressure, BMI, hsCRP, glycated hemoglobin, HDL and LDL cholesterol, and triglycerides (Model 2) attenuated the HRs among placebo (1.35[1.03-1.76]; p=0.027) and rosuvastatin-allocated individuals (1.60 [1.27–2.03]; p<0.001). Similar trends were obtained when assessed across increasing tertiles of LPIR score (Table 3). Tests of interaction between randomized treatment and LPIR tertiles in relation to diabetes in Models 1 and 2 were Pinteraction=0.99 and 0.79, respectively.
Figure 1.

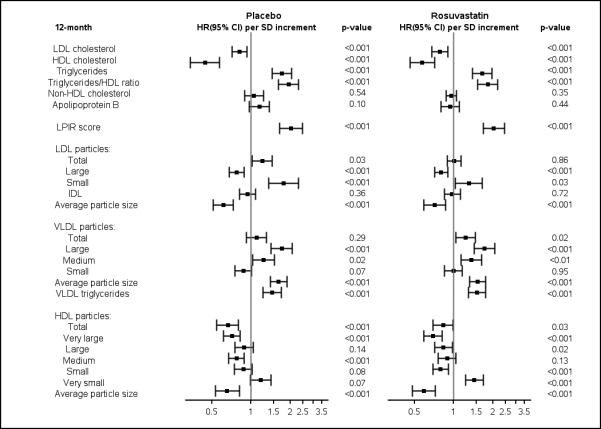
A. Baseline Lipoprotein Measures per SD Increments in Relation to Incident Diabetes.
B. 12-month Lipoprotein Measures per SD Increments in Relation to Incident Diabetes.
Cox proportional hazards ratios (per SD increment) were adjusted for Model 1 variables: age, sex, ethnic origin, education, exercise, family history of diabetes, and smoking.
LPIR score ranges from 0 (most insulin sensitive) to 100 (most insulin resistant).
LDL low-density lipoprotein; HDL high-density lipoprotein; IDL intermediate-density lipoprotein; VLDL very low-density lipoprotein; HR, hazard ratio; CI confidence interval; SD standard deviation.
Table 3.
Baseline Lipoprotein Measures in Relation to Incident Diabetes, According to Randomized Treatment Arm
| Lower Tertile | Middle Tertile | Upper Tertile | Plinear trend | |
|---|---|---|---|---|
| Placebo | ||||
| LDL cholesterol (mg/dL) | ≤ 100 | 101–116 | > 116 | |
| Incidence rate per 100 p-y* | 1.40 (1.09–1.79) | 1.21 (0.94–1.57) | 0.89 (0.65–1.21) | |
| Model 1, HR (95% CI)a | 1.00 | 0.85 (0.59–1.23) | 0.57 (0.38–0.87) | 0.01 |
| cModel 2, HR (95% CI)b | 1.00 | 0.93 (0.64–1.34) | 0.54 (0.35–0.83) | 0.009 |
| HDL cholesterol (mg/dL) | ≤ 43 | 44–56 | > 56 | |
| Incidence rate per 100 p-y | 1.81 (1.47–2.25) | 1.09 (0.83–1.42) | 0.54 (0.36–0.82) | |
| Model 1, HR (95% CI) | 1.00 | 0.54 (0.37–0.78) | 0.28 (0.17–0.45) | <0.001 |
| dModel 2, HR (95% CI) | 1.00 | 0.73 (0.49–1.09) | 0.55 (0.32–0.94) | 0.03 |
| Triglycerides (mg/dL) | ≤ 96 | 97–149 | > 149 | |
| Incidence rate per 100 p-y | 0.54 (0.36–0.80) | 1.16 (0.89–1.52) | 1.79 (1.44–2.22) | |
| Model 1, HR (95% CI) | 1.00 | 2.04 (1.25–3.32) | 3.07 (1.93–4.88) | <0.001 |
| eModel 2, HR (95% CI) | 1.00 | 1.45 (0.86–2.44) | 1.87 (1.10–3.18) | 0.02 |
| Triglyceride/HDL cholesterol ratio | ≤1.78 | 1.79–3.27 | >3.27 | |
| Incidence rate per 100 p-y | 0.48 (0.30–0.71) | 1.08 (0.81–1.42) | 1.92 (1.55–2.36) | |
| Model 1, HR (95% CI) | 1.00 | 2.14 (1.27–3.58) | 3.91 (2.40–6.37) | <0.001 |
| fModel 2, HR (95% CI) | 1.00 | 1.67 (0.98–2.86) | 3.24 (1.97–5.33) | <0.001 |
| Non-HDL cholesterol (mg/dL) | ≤ 125 | 126–143 | > 143 | |
| Incidence rate per 100 p-y | 1.09 (0.82–1.45) | 0.96 (0.72–1.28) | 1.46 (1.15–1.86) | |
| Model 1, HR (95% CI) | 1.00 | 0.86 (0.57–1.29) | 1.19 (0.81–1.76) | 0.37 |
| gModel 2, HR (95% CI) | 1.00 | 0.83 (0.54–1.25) | 0.79 (0.53–1.18) | 0.25 |
| Apolipoprotein B (mg/dL) | ≤ 101 | 102–117 | > 117 | |
| Incidence rate per 100 p-y | 0.79 (0.57–1.10) | 1.35 (1.05–1.72) | 1.36 (1.05–1.75) | |
| Model 1, HR (95% CI) | 1.00 | 1.76 (1.16–2.67) | 1.76 (1.14–2.70) | 0.01 |
| Model 2, HR (95% CI) | 1.00 | 2.11 (1.28–3.46) | 1.83 (1.02–3.28) | 0.09 |
| hModel 3, HR (95% CI) | 1.00 | 1.33 (0.86–2.06) | 1.05 (0.66–1.66) | 0.99 |
| LPIR scorej (range) | ≤ 40 | 41–62 | >62 | |
| Incidence rate per 100 p-y | 0.53 (0.35–0.79) | 0.75 (0.54–1.04) | 2.21 (1.82–2.68) | |
| Model 1, HR (95% CI) | 1.00 | 1.37 (0.80–2.34) | 4.08 (2.53–6.57) | <0.001 |
| Model 2, HR (95% CI) | 1.00 | 0.73 (0.41–1.33) | 1.49 (0.80–2.78) | 0.03 |
| iModel 3, HR (95% CI) | 1.00 | 0.86 (0.48–1.54) | 2.00 (1.11–3.60) | <0.001 |
| Rosuvastatin | ||||
| LDL cholesterol (mg/dL) | ≤ 100 | 101–116 | > 116 | |
| Incidence rate per 100 p-y* | 1.92 (1.55–2.39) | 1.52 (1.20–1.93) | 1.47 (1.15–1.88) | |
| Model 1, HR (95% CI)a | 1.00 | 0.72 (0.52–1.01) | 0.73 (0.52–1.03) | 0.047 |
| cModel 2, HR (95% CI)b | 1.00 | 0.71 (0.50–1.00) | 0.66 (0.46–0.93) | 0.01 |
| HDL cholesterol (mg/dL) | ≤ 43 | 44–56 | > 56 | |
| Incidence rate per 100 p-y | 2.53 (2.10–3.05) | 1.61 (1.28–2.02) | 0.73 (0.51–1.04) | |
| Model 1, HR (95% CI) | 1.00 | 0.61 (0.44–0.83) | 0.28 (0.18–0.43) | <0.001 |
| dModel 2, HR (95% CI) | 1.00 | 0.72 (0.51–1.02) | 0.49 (0.30–0.79) | 0.003 |
| Triglycerides (mg/dL) | ≤ 96 | 97–149 | > 149 | |
| Incidence rate per 100 p-y | 0.88 (0.61–1.21) | 1.26 (0.97–1.63) | 2.78 (2.32–3.31) | |
| Model 1, HR (95% CI) | 1.00 | 1.37 (0.89–2.12) | 2.97 (2.02–4.37) | <0.001 |
| eModel 2, HR (95% CI) | 1.00 | 0.85 (0.54–1.33) | 1.43 (0.93–2.20) | 0.009 |
| Triglyceride/HDL cholesterol ratio | ≤1.78 | 1.79–3.27 | >3.27 | |
| Incidence rate per 100 p-y | 0.73 (0.50–1.02) | 1.43 (1.11–1.82) | 2.75 (2.28–3.28) | |
| Model 1, HR (95% CI) | 1.00 | 1.78 (1.14–2.77) | 3.53 (2.34–5.32) | <0.001 |
| fModel 2, HR (95% CI) | 1.00 | 1.29 (0.82–2.03) | 2.29 (1.51–3.49) | <0.001 |
| Non-HDL cholesterol (mg/dL) | ≤ 125 | 126–143 | > 143 | |
| Incidence rate per 100 p-y | 1.24 (0.95–1.61) | 1.63 (1.30–2.05) | 2.05 (1.67–2.53) | |
| Model 1, HR (95% CI) | 1.00 | 1.20 (0.84–1.73) | 1.49 (1.05–2.12) | 0.03 |
| gModel 2, HR (95% CI) | 1.00 | 0.98 (0.68–1.42) | 0.92 (0.64–1.33) | 0.65 |
| Apolipoprotein B (mg/dL) | ≤ 101 | 102–117 | > 117 | |
| Incidence rate per 100 p-y | 1.02 (0.77–1.37) | 1.77 (1.41–2.21) | 2.16 (1.76–2.64) | |
| Model 1, HR (95% CI) | 1.00 | 1.80 (1.23–2.64) | 2.22 (1.53–3.22) | <0.001 |
| Model 2, HR (95% CI) | 1.00 | 1.82 (1.17–2.83) | 2.31 (1.41–3.78) | 0.001 |
| hModel 3, HR (95% CI) | 1.00 | 1.22 (0.82–1.80) | 1.25 (0.85–1.86) | 0.28 |
| LPIR scorej (range) | ≤ 40 | 41–62 | >62 | |
| Incidence rate per 100 p-y | 0.60 (0.41–0.88) | 1.41 (1.10–1.81) | 2.90 (2.44–3.44) | |
| Model 1, HR (95% CI) | 1.00 | 2.24 (1.39–3.60) | 4.97 (3.16–7.82) | <0.001 |
| Model 2, HR (95% CI) | 1.00 | 1.22 (0.72–2.06) | 2.10 (1.20–3.66) | 0.002 |
| iModel 3, HR (95% CI) | 1.00 | 1.23 (0.73–2.07) | 2.23 (1.30–3.82) | <0.001 |
Incidence rate per 100 p-y (person-years); HR, hazard ratio; CI, confidence interval. LDL low-density lipoprotein; HDL high-density lipoprotein.
Number of incident diabetes cases among placebo- and rosuvastatin-allocated individuals were 158/6009 and 212/5909, respectively.
Model 1: Cox proportional hazards ratios were adjusted for age, sex, ethnic origin, education, exercise, family history of diabetes, and smoking
Model 2: Cox proportional hazards ratios were adjusted for Model 1 variables + systolic blood pressure, body-mass index, log transformed hsCRP, glycated hemoglobin, HDL cholesterol, LDL cholesterol, and log transformed triglycerides.
Model 2 excludes LDL cholesterol
Model 2 excludes HDL cholesterol
Model 2 excludes log transformed triglycerides
Model 2 excludes HDL cholesterol and log transformed triglycerides
Model 2 excludes LDL cholesterol and log transformed triglycerides
Model 3 excludes LDL cholesterol and log transformed triglycerides, but includes LPIR score
Model 3 excludes LDL cholesterol and log transformed triglycerides, but includes Apolipoprotein B
LPIR score ranges from 0 (most insulin sensitive) to 100 (most insulin resistant).
Overall (Model 1), placebo- and rosuvastatin-allocated individuals showed generally similar associations for baseline lipoprotein subclass characteristics and incident diabetes (Figure 1A; eTable 3A, Supplement). However, after additionally adjusting for blood pressure, BMI, hsCRP, glycated hemoglobin, and lipids (Model 2), there were some notable differences. In particular, in rosuvastatin-allocated individuals, baseline (but not 12 months) small LDL particles, large VLDL particles, and medium VLDL particles, were positively associated, while small VLDL particles were inversely associated with incident diabetes. These associations were not seen in placebo-allocated individuals (eTables 4A and 4B).
Similar analyses were done at 12 months, and Model 1 associations seen at baseline were generally preserved (Figure 1B). The HR per SD of LPIR score was 2.03 (1.65–2.49; p<0.001) in placebo and 2.03 (1.68–2.45; p<0.001) in rosuvastatin-allocated individuals (Figure 1B). Substituting fasting glucose for glycated hemoglobin attenuated the association of LPIR in placebo (1.62 [1.32–1.99; p<0.001]) and rosuvastatin-allocated individuals (1. 63 [1.35–1.98; p<0.001]). Additional adjustment for Model 2 variables also slightly attenuated the association between LPIR score with diabetes in placebo (1.51 [1.15-1.96]; p=0.0026) and rosuvastatin-allocated individuals (1.58 [1.23–2.01]; p<0.001). Similar trends were obtained across increasing tertiles of LPIR score (Table 4; eTable 5, Supplement). The test of interaction between randomized treatment and LPIR tertiles in relation to diabetes in Models 1 and 2 were Pinteraction=0.98 and 0.86, respectively.
Table 4.
12-month Lipoprotein Measures in Relation to Incident Diabetes in the Rosuvastatin Arm
| Lower Tertile | Middle Tertile | Upper Tertile | Plinear trend | |
|---|---|---|---|---|
| LDL cholesterol (mg/dL) | ≤ 63 | 64–108 | > 108 | |
| Incidence rate per 100 p-y* | 1.91 (1.61–2.26) | 1.08 (0.74–1.57) | 1.07 (0.56–2.05) | |
| Model 1, HR (95% CI)a | 1.00 | 0.59 (0.39–0.90) | 0.49 (0.23–1.05) | 0.02 |
| cModel 2, HR (95% CI)b | 1.00 | 0.69 (0.44–1.06) | 0.35 (0.15–0.84) | 0.07 |
| HDL cholesterol (mg/dL) | ≤ 45 | 46–58 | > 58 | |
| Incidence rate per 100 p-y | 2.65 (2.15–3.26) | 1.48 (1.12–1.95) | 0.85 (0.59–1.21) | |
| Model 1, HR (95% CI) | 1.00 | 0.54 (0.38–0.79) | 0.31 (0.19–0.50) | <0.001 |
| dModel 2, HR (95% CI) | 1.00 | 0.70 (0.47–1.05) | 0.67 (0.40–1.13) | 0.10 |
| Triglycerides (mg/dL) | ≤ 91 | 92–136 | > 136 | |
| Incidence rate per 100 p-y | 0.95 (0.69–1.30) | 1.43 (1.08–1.88) | 2.90 (2.34–3.61) | |
| Model 1, HR (95% CI) | 1.00 | 1.41 (0.91–2.20) | 2.85 (1.91–4.26) | <0.001 |
| eModel 2, HR (95% CI) | 1.00 | 1.22 (0.77–1.93) | 2.21 (1.41–3.45) | 0.001 |
| Triglyceride/HDL cholesterol ratio | ≤1.63 | 1.64–2.88 | >2.88 | |
| Incidence rate per 100 p-y | 0.80 (0.55–1.12) | 1.56 (1.18–2.01) | 2.88 (2.30–3.56) | |
| Model 1, HR (95% CI) | 1.00 | 2.01 (1.27–3.18) | 3.36 (2.16–5.25) | <0.001 |
| fModel 2, HR (95% CI) | 1.00 | 1.32 (0.82–2.12) | 2.36 (1.47–3.67) | <0.001 |
| Non-HDL cholesterol (mg/dL) | ≤ 86 | 87–134 | > 134 | |
| Incidence rate per 100 p-y | 1.63 (1.36–1.97) | 1.73 (1.29–2.31) | 1.40 (0.80–2.45) | |
| Model 1, HR (95% CI) | 1.00 | 1.08 (0.75–1.55) | 0.78 (0.41–1.50) | 0.79 |
| gModel 2, HR (95% CI) | 1.00 | 1.14 (0.79–1.65) | 0.65 (0.32–1.32) | 0.69 |
| Apolipoprotein B (mg/dL) | ≤ 73 | 74–104 | > 104 | |
| Incidence rate per 100 p-y | 1.56 (1.29–1.89) | 2.00 (1.53–2.60) | 1.12 (0.61–2.09) | |
| Model 1, HR (95% CI) | 1.00 | 1.34 (0.95–1.88) | 0.65 (0.31–1.33) | 0.90 |
| Model 2, HR (95% CI) | 1.00 | 2.28 (1.38–3.77) | 2.33 (0.69–7.85) | 0.004 |
| hModel 3, HR (95% CI) | 1.00 | 1.27 (0.89–1.81) | 0.52 (0.24–1.10) | 0.60 |
| LPIR scorej (range) | ≤ 40 | 41–62 | > 62 | |
| Incidence rate per 100 p-y | 0.75 (0.51–1.10) | 1.27 (0.96–1.68) | 3.16 (2.59–3.86) | |
| Model 1, HR (95% CI) | 1.00 | 1.81 (1.09–3.01) | 4.41 (2.73–7.13) | <0.001 |
| Model 2, HR (95% CI) | 1.00 | 1.35 (0.78–2.32) | 2.55 (1.38–4.72) | 0.001 |
| iModel 3, HR (95% CI) | 1.00 | 1.49 (0.87–2.54) | 3.33 (1.90–5.81) | <0.001 |
Incidence rate per 100 p-y (person-years); HR, hazard ratio; CI, confidence interval. LDL low-density lipoprotein; HDL high-density lipoprotein.
Number of cases of incident diabetes among rosuvastatin-allocated individuals were 167/4419.
Model 1: Cox proportional hazards ratios were adjusted for age, sex, ethnic origin, education, exercise, family history of diabetes, and smoking
Model 2: Cox proportional hazards ratios were adjusted for Model 1 variables + systolic blood pressure, body-mass index, log transformed hsCRP, glycated hemoglobin, HDL cholesterol, LDL cholesterol, and log transformed triglycerides.
Model 2 excludes LDL cholesterol
Model 2 excludes HDL cholesterol
Model 2 excludes log transformed triglycerides
Model 2 excludes HDL cholesterol and log transformed triglycerides
Model 2 excludes LDL cholesterol and log transformed triglycerides
Model 3 excludes LDL cholesterol and log transformed triglycerides, but includes LPIR score
Model 3 excludes LDL cholesterol and log transformed triglycerides, but includes Apolipoprotein B
LPIR score ranges from 0 (most insulin sensitive) to 100 (most insulin resistant).
In addition to LPIR score, baseline and 12 month levels of apolipoprotein B were positively associated with diabetes. In mutually adjusted models, LPIR score remained associated with diabetes, while the association between apolipoprotein B and diabetes was completely abrogated (Tables 3 and 4). Likewise, LPIR score and the triglyceride/HDL cholesterol ratio were both significantly associated with diabetes (Tables 3 and 4), but in mutually adjusted models, LPIR score remained significant in both arms, whereas the triglyceride/HDL cholesterol ratio was no longer significant in the rosuvastatin arm.
Model Performance with the LPIR Score
To investigate if LPIR score would improve risk prediction metrics, we used Model 2 and a modified model (Model 2A) that included fasting glucose instead of glycated hemoglobin (eTable 6). The likelihood ratio chi-squares were significantly improved when LPIR score was added to Model 2 (chi-squared = 18.23, p<0.001) and Model 2A (chi-squared = 12.26, p<0.001). The c-statistic of Model 2 (0.827 [0.804 to 0.851]) was unchanged after adding LPIR score (0.827 [0.804 to 0.851]). Similarly, the c-statistic of Model 2A (0.853 [0.832 to 0.873]) was unchanged after adding LPIR score (0.855 [0.835 to 0.873]). Further, the relative IDI did not improve significantly after addition of the LPIR score to Model 2 (0.038 [−0.009 to 0.076]) and Model 2A 0.0239 [−0.0025 to 0.0504]). However, the categorical NRI was improved after adding LPIR score to Model 2 (0.039 [0.003 to 0.072]) driven mainly by re-classification of non-events (0.036) and events (0.002). The categorical NRI of Model 2A after adding LPIR score was 0.012 (−0.008 to 0.0184).While the improvement in Model 2 NRI was statistically significant, the gain in the model's predictive ability was modest.
DISCUSSION
Results from this study support the following conclusions: first, rosuvastatin was associated with differential effects on the size and concentration of LDL, HDL, and VLDL particles; second, rosuvastatin substantially reduced LDL cholesterol and triglycerides, but only slightly reduced LPIR score, shifting the LDL and VLDL lipoprotein subclass distribution towards a smaller average size for LDL and a larger average size for VLDL particles; third, LPIR score, a lipoprotein correlate of insulin resistance, was positively associated with incident diabetes in both placebo- and rosuvastatin-allocated individuals and finally, LPIR score was significantly associated with incident diabetes after adjusting for traditional risk factors including family history of diabetes, exercise, body-mass index, glycated hemoglobin, HDL cholesterol, non-HDL cholesterol, triglycerides, and apolipoprotein B. This study, nested within a randomized placebo-controlled trial, is the first to characterize the association between LPIR score and diabetes among individuals randomly allocated to placebo or high-intensity statin therapy, and our results suggest that LPIR score may identify additional individuals at risk of developing diabetes, including when on rosuvastatin.
Recently, a similar positive association between LPIR score and incident diabetes was described in a multi-ethnic cohort, in which a small proportion of participants were on cholesterol-lowering medications19. Statin users at risk of developing diabetes very often have pre-existing impairments in fasting glucose and features of the metabolic syndrome8,9, factors that also predispose to diabetes in statin-naïve individuals10. To identify other risk factors that might predispose to the development of diabetes, we focused on lipoprotein characteristics, given reports of differing associations between diabetes and size/concentration of LDL, HDL, and VLDL particles12–16,18. Here, LPIR score remained associated with diabetes after adjusting for clinical risk factors that were recently shown to be independent predictors of developing diabetes when on a statin8. Interestingly, even though rosuvastatin substantially reduced LDL cholesterol and triglycerides, it only slightly reduced LPIR score (by 3%; Table 2), as rosuvastatin altered the LDL and VLDL lipoprotein subclass distribution, resulting in smaller average size for LDL and larger average size for VLDL.
While statins are associated with a higher incidence of diabetes, the underlying mechanisms are not well understood29 and may involve inhibition of on-target 3-hydroxy-3-methylglutaryl-CoA reductase30 and effects on glucose tolerance, insulin sensitivity and insulin secretion31, and circulating levels of adipokines32. Animal models have shown that statins alter the expression levels of glucose transporter 433 through isoprenoid synthesis34, the main insulin-responsive glucose transporter that facilitates glucose uptake in muscle and adipose tissue. Conceivably, lipoproteins that constitute the LPIR score could be involved in these and/or additional pathways34.
Our study has several strengths including that it was nested within a randomized, prospective trial, its large sample size and number of events, excellent follow-up, robust information on risk factors that could modify or confound our interpretation, and pre-specification of incident diabetes as a secondary endpoint of interest. Our study has potential limitations. JUPITER was stopped early by the independent data and safety monitoring board after a median follow up 1.9 years for cardiovascular and mortality efficacy, and the long-term effect of statins on incident diabetes could not be determined. The JUPITER study included individuals with elevated levels of hsCRP (which is also associated with incident diabetes) and excluded those with serum triglyceride ≥500 mg/dL. This study evaluated a fixed dose of one statin (rosuvastatin 20 mg), and the association of LPIR score and diabetes with other statins or among individuals who do not meet the current study's inclusion or exclusion criteria requires further evaluation. Future studies should also examine whether modifying or adding additional metabolic predictors (e.g. branched chain amino acids) to the LPIR score could result in improved diabetes risk prediction. In conclusion, among placebo- and rosuvastatin-allocated individuals in JUPITER, LPIR score is positively associated with incident diabetes after adjusting for traditional risk factors. LPIR score has the potential to serve as part of a broader clinical approach to identify additional cases at risk for diabetes.
Supplementary Material
ACKNOWLEDGMENTS
The authors are grateful to Chunying Li, Jean MacFadyen, MV Moorthy, Latha Padmanabhan, and Lynda Rose, all from the Division of Preventive Medicine, Brigham and Women's Hospital, Boston, USA, for guidance and technical assistance during this study.
The research for this article was supported by the National Heart, Lung, And Blood Institute of the National Institutes of Health under Award Number R01HL117861 to SM. The content is solely the responsibility of the authors and does not necessarily represent the official views of the National Institutes of Health. The JUPITER trial was financially supported by AstraZeneca, who collected trial data and monitored sites but had no role in the design and conduct of the study; collection, management, analysis, and interpretation of the data; preparation, review, or approval of the manuscript; and decision to submit the manuscript for publication”. SM had full access to all of the data in the study and takes responsibility for the integrity of the data and the accuracy of the data analysis. Written permission was obtained from all contributors (CL, JM, MVM, LP, and LR) listed in the Acknowledgments section. LipoScience Inc. (now LabCorp) supplied the NMR information at no additional charge. AOA was supported by the National Heart, Lung, and Blood Institute (T32 HL007575).
RJG reports grants from AstraZeneca, during the conduct of the study; PMR reports grants from AstraZeneca, non-financial support from LipoScience (now LabCorp), during the conduct of the study; grants from AstraZeneca, grants from Novartis, grants from Pfizer, non-financial support from Amgen, outside the submitted work. In addition, Dr. Ridker has a patent “Use of inflammatory biomarkers in cardiovascular disease” issued to AstraZeneca and Siemens; SM reports grants from AstraZeneca, non-financial support from LipoScience (now LabCorp), during the conduct of the study; grants from Atherotech Diagnostics, personal fees from Genzyme, personal fees from Quest Diagnostics, personal fees from Lilly, personal fees from Pfizer, personal fees from Cerenis Therapeutics, outside the submitted work. Parts of this manuscript were presented in abstract form at the American Heart Association Meeting November 15 to 19, 2014, in Chicago, Illinois.
Footnotes
Trial Registration: clinicaltrials.gov Identifier: NCT00239681
SD, AOA, and NP report no conflict of interest.
REFERENCES
- 1.Baigent C, Blackwell L, Emberson J, et al. Efficacy and safety of more intensive lowering of LDL cholesterol: a meta-analysis of data from 170,000 participants in 26 randomised trials. Lancet. 2010;376(9753):1670–1681. doi: 10.1016/S0140-6736(10)61350-5. [DOI] [PMC free article] [PubMed] [Google Scholar]
- 2.Ridker PM, Danielson E, Fonseca FAH, et al. Rosuvastatin to prevent vascular events in men and women with elevated C-reactive protein. N Engl J Med. 2008;359(21):2195–2207. doi: 10.1056/NEJMoa0807646. [DOI] [PubMed] [Google Scholar]
- 3.Taylor F, Huffman MD, Macedo AF, et al. Statins for the primary prevention of cardiovascular disease. Cochrane database Syst Rev. 2013;1:CD004816. doi: 10.1002/14651858.CD004816.pub5. [DOI] [PMC free article] [PubMed] [Google Scholar]
- 4.Preiss D, Seshasai SRK, Welsh P, et al. Risk of incident diabetes with intensive-dose compared with moderate-dose statin therapy: a meta-analysis. JAMA. 2011;305(24):2556–2564. doi: 10.1001/jama.2011.860. [DOI] [PubMed] [Google Scholar]
- 5.Sattar N, Preiss D, Murray HM, et al. Statins and risk of incident diabetes: a collaborative meta-analysis of randomised statin trials. Lancet. 2010;375(9716):735–742. doi: 10.1016/S0140-6736(09)61965-6. [DOI] [PubMed] [Google Scholar]
- 6.Carter AA, Gomes T, Camacho X, Juurlink DN, Shah BR, Mamdani MM. Risk of incident diabetes among patients treated with statins: population based study. BMJ. 2013;346:f2610. doi: 10.1136/bmj.f2610. [DOI] [PMC free article] [PubMed] [Google Scholar]
- 7.Dormuth CR, Filion KB, Paterson JM, et al. Higher potency statins and the risk of new diabetes: multicentre, observational study of administrative databases. BMJ. 2014;348:g3244. doi: 10.1136/bmj.g3244. [DOI] [PMC free article] [PubMed] [Google Scholar]
- 8.Waters DD, Ho JE, DeMicco DA, et al. Predictors of new-onset diabetes in patients treated with atorvastatin: results from 3 large randomized clinical trials. J Am Coll Cardiol. 2011;57(14):1535–1545. doi: 10.1016/j.jacc.2010.10.047. [DOI] [PubMed] [Google Scholar]
- 9.Ridker PM, Pradhan A, MacFadyen JG, Libby P, Glynn RJ. Cardiovascular benefits and diabetes risks of statin therapy in primary prevention: An analysis from the JUPITER trial. Lancet. 2012;380:565–571. doi: 10.1016/S0140-6736(12)61190-8. [DOI] [PMC free article] [PubMed] [Google Scholar]
- 10.Hu FB, Manson JE, Stampfer MJ, et al. Diet, lifestyle, and the risk of type 2 diabetes mellitus in women. N Engl J Med. 2001;345(11):790–797. doi: 10.1056/NEJMoa010492. [DOI] [PubMed] [Google Scholar]
- 11.Stone NJ, Robinson JG, Lichtenstein AH, et al. 2013 ACC/AHA Guideline on the Treatment of Blood Cholesterol to Reduce Atherosclerotic Cardiovascular Risk in Adults: A Report of the American College of Cardiology/American Heart Association Task Force on Practice Guidelines. J Am Coll Cardiol. 2014;63(25 Pt B):2889–2934. doi: 10.1016/j.jacc.2013.11.002. [DOI] [PubMed] [Google Scholar]
- 12.Garvey WT, Kwon S, Zheng D, et al. Effects of insulin resistance and type 2 diabetes on lipoprotein subclass particle size and concentration determined by nuclear magnetic resonance. Diabetes. 2003;52(2):453–462. doi: 10.2337/diabetes.52.2.453. [DOI] [PubMed] [Google Scholar]
- 13.Festa A, Williams K, Hanley AJG, et al. Nuclear magnetic resonance lipoprotein abnormalities in prediabetic subjects in the Insulin Resistance Atherosclerosis Study. Circulation. 2005;111(25):3465–3472. doi: 10.1161/CIRCULATIONAHA.104.512079. [DOI] [PubMed] [Google Scholar]
- 14.Goff DC, D'Agostino RB, Haffner SM, Otvos JD. Insulin resistance and adiposity influence lipoprotein size and subclass concentrations. Results from the Insulin Resistance Atherosclerosis Study. Metabolism. 2005;54(2):264–270. doi: 10.1016/j.metabol.2004.09.002. [DOI] [PubMed] [Google Scholar]
- 15.Hodge AM, Jenkins AJ, English DR, O'Dea K, Giles GG. NMR-determined lipoprotein subclass profile predicts type 2 diabetes. Diabetes Res Clin Pract. 2009;83(1):132–139. doi: 10.1016/j.diabres.2008.11.007. [DOI] [PubMed] [Google Scholar]
- 16.Mora S, Otvos JD, Rosenson RS, Pradhan A, Buring JE, Ridker PM. Lipoprotein particle size and concentration by nuclear magnetic resonance and incident type 2 diabetes in women. Diabetes. 2010;59(5):1153–1160. doi: 10.2337/db09-1114. [DOI] [PMC free article] [PubMed] [Google Scholar]
- 17.Ai M, Otokozawa S, Asztalos BF, et al. Effects of maximal doses of atorvastatin versus rosuvastatin on small dense low-density lipoprotein cholesterol levels. Am J Cardiol. 2008;101(3):315–318. doi: 10.1016/j.amjcard.2007.08.035. [DOI] [PubMed] [Google Scholar]
- 18.Wang J, Stančáková A, Soininen P, et al. Lipoprotein subclass profiles in individuals with varying degrees of glucose tolerance: a population-based study of 9399 Finnish men. J Intern Med. 2012;272(6):562–572. doi: 10.1111/j.1365-2796.2012.02562.x. [DOI] [PubMed] [Google Scholar]
- 19.Mackey RH, Mora S, Bertoni AG, et al. Lipoprotein particles and incident type 2 diabetes in the multi-ethnic study of atherosclerosis. Diabetes Care. 2015;38(4):628–636. doi: 10.2337/dc14-0645. [DOI] [PMC free article] [PubMed] [Google Scholar]
- 20.Shalaurova I, Connelly MA, Garvey WT, Otvos JD. Lipoprotein insulin resistance index: a lipoprotein particle-derived measure of insulin resistance. Metab Syndr Relat Disord. 2014;12(8):422–429. doi: 10.1089/met.2014.0050. [DOI] [PMC free article] [PubMed] [Google Scholar]
- 21.Ridker PM, Fonseca FAH, Genest J, et al. Baseline characteristics of participants in the JUPITER trial, a randomized placebo-controlled primary prevention trial of statin therapy among individuals with low low-density lipoprotein cholesterol and elevated high- sensitivity C-reactive protein. Am J Cardiol. 2007;100(11):1659–1664. doi: 10.1016/j.amjcard.2007.09.072. [DOI] [PubMed] [Google Scholar]
- 22.Mora S, Glynn RJ, Boekholdt SM, Nordestgaard BG, Kastelein JJP, Ridker PM. On- treatment non-high-density lipoprotein cholesterol, apolipoprotein B, triglycerides, and lipid ratios in relation to residual vascular risk after treatment with potent statin therapy: JUPITER (justification for the use of statins in prevention: an inte. J Am Coll Cardiol. 2012;59(17):1521–1528. doi: 10.1016/j.jacc.2011.12.035. [DOI] [PMC free article] [PubMed] [Google Scholar]
- 23.Mora S, Glynn RJ, Ridker PM. High-density lipoprotein cholesterol, size, particle number, and residual vascular risk after potent statin therapy. Circulation. 2013;128(11):1189–1197. doi: 10.1161/CIRCULATIONAHA.113.002671. [DOI] [PMC free article] [PubMed] [Google Scholar]
- 24.Friedewald WT, Levy RI, Fredrickson DS. Estimation of the concentration of low-density lipoprotein cholesterol in plasma, without use of the preparative ultracentrifuge. Clin Chem. 1972;18(6):499–502. [PubMed] [Google Scholar]
- 25.Jeyarajah EJ, Cromwell WC, Otvos JD. Lipoprotein particle analysis by nuclear magnetic resonance spectroscopy. Clin Lab Med. 2006;26(4):847–870. doi: 10.1016/j.cll.2006.07.006. [DOI] [PubMed] [Google Scholar]
- 26.Harrell FE, Lee KL, Mark DB. Multivariable prognostic models: issues in developing models, evaluating assumptions and adequacy, and measuring and reducing errors. Stat Med. 1996;15(4):361–387. doi: 10.1002/(SICI)1097-0258(19960229)15:4<361::AID-SIM168>3.0.CO;2-4. [DOI] [PubMed] [Google Scholar]
- 27.Pencina MJ, D'Agostino RB, Vasan RS. Evaluating the added predictive ability of a new marker: from area under the ROC curve to reclassification and beyond. Stat Med. 2008;27(2):157–172. doi: 10.1002/sim.2929. [DOI] [PubMed] [Google Scholar]
- 28.Pencina MJ, D'Agostino RB, Steyerberg EW. Extensions of net reclassification improvement calculations to measure usefulness of new biomarkers. Stat Med. 2011;30(1):11–21. doi: 10.1002/sim.4085. [DOI] [PMC free article] [PubMed] [Google Scholar]
- 29.Preiss D, Sattar N. Statins and the risk of new-onset diabetes: a review of recent evidence. Curr Opin Lipidol. 2011;22(6):460–466. doi: 10.1097/MOL.0b013e32834b4994. [DOI] [PubMed] [Google Scholar]
- 30.Swerdlow DI, Preiss D, Kuchenbaecker KB, et al. HMG-coenzyme A reductase inhibition, type 2 diabetes, and bodyweight: evidence from genetic analysis and randomised trials. Lancet. 2014;385(9965):351–361. doi: 10.1016/S0140-6736(14)61183-1. [DOI] [PMC free article] [PubMed] [Google Scholar]
- 31.Koh KK, Quon MJ, Han SH, Lee Y, Kim SJ, Shin EK. Atorvastatin causes insulin resistance and increases ambient glycemia in hypercholesterolemic patients. J Am Coll Cardiol. 2010;55(12):1209–1216. doi: 10.1016/j.jacc.2009.10.053. [DOI] [PMC free article] [PubMed] [Google Scholar]
- 32.Koh KK, Quon MJ, Sakuma I, et al. Effects of simvastatin therapy on circulating adipocytokines in patients with hypercholesterolemia. Int J Cardiol. 2011;146(3):434–437. doi: 10.1016/j.ijcard.2010.10.103. [DOI] [PubMed] [Google Scholar]
- 33.Nakata M, Nagasaka S, Kusaka I, Matsuoka H, Ishibashi S, Yada T. Effects of statins on the adipocyte maturation and expression of glucose transporter 4 (SLC2A4): implications in glycaemic control. Diabetologia. 2006;49(8):1881–1892. doi: 10.1007/s00125-006-0269-5. [DOI] [PubMed] [Google Scholar]
- 34.Sampson UK, Linton MF, Fazio S. Are statins diabetogenic? Curr Opin Cardiol. 2011;26(4):342–347. doi: 10.1097/HCO.0b013e3283470359. [DOI] [PMC free article] [PubMed] [Google Scholar]
Associated Data
This section collects any data citations, data availability statements, or supplementary materials included in this article.