

Abstract
The world's population is ageing and an important part of this demographic shift is the development of chronic illness. In short, a person who does not die of acute illnesses, such as infections, and survives with chronic illnesses is more likely to develop additional chronic illnesses. Chronic respiratory diseases are an important component of these diseases associated with ageing. This article reviews the relationship between ageing and chronic respiratory disease, and also how certain chronic diseases cluster with others, either on the basis of underlying risk factors, complication of the primary disease or other factors, such as an increased state of inflammation. While death is inevitable, disabling chronic illnesses are not. Better understanding of how individuals can age healthily without the development of multiple chronic illnesses should lead to an improved global quality of life.
Population growth and ageing
In 2012, the world population reached 7 billion inhabitants, which is 6 billion more than in 1800 [1]. Population growth rate increased linearly up until the early 1900s, when it transitioned to an exponential growth. The rate of growth reached it maximum peak of 2.2% per year from 1950 to 1962 (fig. 1).
Figure 1.

Total world population growth from 1800–2050. Reproduced from [1].
This historic population growth is the result of several factors: contributions from medical, technological and public health advances resulting in the control and treatment of communicable diseases; the control of pandemics; the end of large-scale wars; improvement in living conditions; and the agricultural revolution [2]. Because of these improvements, life expectancy has increased dramatically. In 1950, life expectancy at birth was 65 years in the more developed regions of the world and 42 years in the less developed regions of the world. Currently, life expectancy is 78 years in the developed world and 68 years in the developing world. At the same time, there has been a decline in population growth rate. Population growth rate peaked at 2.2% per year in the 1960s compared with the current estimate of 1.1% per year. It is estimated to decline further to 0.5% by 2050 [3]. This decline is mainly explained by falling fertility rates in most regions of the world. Over the last few decades, fertility rate decreased from 5.0 children per female in 1950–1955 to 2.5 children per female in 2010–2015 and is projected to drop to 1.8–2.2 by 2050 [4]. In addition, a significant gap in fertility rate exists between developed countries and less developed countries. This gap is projected to narrow by 2050.
The combination of decreasing fertility rate and increased life expectancies has led to a change in the demographics of the population with the strata of older individuals growing faster than the younger individuals (fig. 2 and the interactive graph www.gapminder.org/world).
Figure 2.

Relationship of life expectancy at birth in years and fertility (children born per females) at three points of time worldwide. Each dot represents a country, with the size of that dot proportional to the country population. Free material from www.gapminder.org.
The United Nations Population Division reported that the global share of older people (aged 60 years or over) increased from 8% in 1950 and 9% in 1990 to 12% in 2013, and will continue to grow to an estimated 21% by 2050 (fig. 3) [4]. Population demographics differ by region and level of development (fig. 3). More developed regions had 12% of their population aged 60 years and older in 1950. This proportion rose to 23% in 2013 and is expected to reach 32% in 2050. In less developed regions, the proportion of older persons increased slowly between 1950 and 2013, from 6% to 9% however, the proportion of older persons is expected to reach 19% by 2050. By 2045–2050, life expectancy is projected to reach 83 years in the more developed regions of the world and 75 years in the less developed regions of the world.
Figure 3.

The ageing pyramid is a graphic representation of population composition changes between a, b) 1970, c, d) 2013 and e, f) 2050 projection, stratified by less (a, c, and e) and more developed regions (b, d and f), sex, and age strata. Reproduced from [4] with permission from the publisher.
The proportion of the population aged 80 years and older is also increasing dramatically. In 1950, the number of adults aged 80 years and older was estimated to be 6 million in the less developed regions of the world and 8 million in the more developed regions. By 2050, these numbers are projected to increase to 268 million and 124 million, respectively [4].
Another important aspect of the ageing of the global population is the difference between males and females. For example, in the developed regions of the world, in 2010, for every 100 females over the age of 60 years there were 87 living males. In the developing regions of the world, this number was 75 [4]. This reflects longer life expectancy among females, which is related to a number of lifestyle and exposure factors (diet, smoking, occupational exposures, violence, war, etc.).
Ironically, the pace at which gains have been attained in life expectancy is higher in developing regions, potentially stressing their social support systems. For example, it took France 115 years, Sweden 85 years and the USA 69 years to increase the proportion of the population aged 60 years or over from 7% to 14%. In contrast, it will take China, Brazil or Colombia only 20 to 26 years to experience the same change in population ageing [5].
In summary, the population of older persons is growing by 2% each year, considerably faster than the population as a whole. For at least the next 25 years, the older population is expected to continue growing more rapidly than other age groups. This increase in the ageing population is in absolute numbers as well in relation to the working-age population (15 to 64 years of age), impacting economic growth, savings, investment and consumption, labour markets, pensions, taxation, and intergenerational transfers, in addition to impacts on health and the healthcare system.
The changing burden of disease
Based on standardized estimates from 187 countries, the Global Burden of Diseases 2010 project demonstrated that premature death from communicable diseases decreased from 34% in 1990 to 25% in 2010 [6].
The most important drivers of the shift were decreases in diseases of children, specifically diarrhoeal disease (from 2.5 to 1.4 million), lower respiratory infections (from 3.4 to 2.8 million), neonatal disorders (from 3.1 to 2.2 million), measles (from 0.6 to 0.1 million) and tetanus (from 0.3 to 0.1 million) [6]. This represents the ongoing “epidemiological transition” which is the movement from communicable diseases towards noncommunicable diseases (NCDs) [6].
However, both population growth and ageing are increasing the number of deaths from NCDs. A 2013 report from the United Nations noted “Population ageing has major social and economic consequences […] While people are living longer lives almost everywhere, the prevalence of non-communicable diseases and disability increase as populations age” [4]. NCDs are characterised by slow progression and long duration; therefore, the clinical manifestation and burden disproportionally affect older adults (figs 4 and 5). The most important chronic diseases include ischaemic cardiovascular disease, cerebrovascular disease, chronic obstructive pulmonary disease (COPD), diabetes, cancer and depression. During the same period that premature death from infectious disease decreased (1990 to 2010), the proportion of deaths due to NCDs rose from 57.1% to 65.5% (fig. 4a).
Figure 4.

a) Comparison of causes of death in 1990 and 2010 expressed as percentage of total deaths. Data from [7]. b) Leading causes of death worldwide for both sexes and all ages. UI: uncertainty interval. Data from [8]
Figure 5.

Global distribution of disability-adjusted life-years (DALYs) ranking in three different age groups: a) 15–49 years, b) 50–69 years, and c) 70 years and older) at two time points (1990 and 2010). DALYs are calculated as years of life lost plus years lost due to disability (table 1). UI: uncertainty interval. Data from [8].
Risk factors and the burden of disease
In addition to ageing, a number of other important risk factors are associated with the development of chronic disease. These include habits such as tobacco smoking and alcohol intake, over- and undernutrition, inactivity, and occupational exposures. Many of these factors can cause multiple diseases. Tobacco smoking, for example, causes COPD, cardiovascular disease, stroke and other chronic diseases, and overnutrition causes diabetes and cardiovascular disease.
Understanding the role of these risk factors starts with two important unmet assumptions. First, that comorbidity as observed in many epidemiological studies and reports does not necessarily reflect a causal association between diseases, as it may result from chance and bias [9]. If chance and bias can be excluded, the different determinants (from shared heredity to shared environment and disease to disease) of comorbidity can be considered. Second, how biological ageing by itself influences the development of chronic diseases is far from clear and the concept of healthy ageing is a useful one [10].
Some of these risk factors have changed over the past two decades. In 1990, the leading risk factors for global disease burden were childhood underweight (7.9%), household air pollution from solid fuels (6.8%) and tobacco smoking including second-hand smoke (6.1%). By 2010, the three leading risk factors were high blood pressure (7.0%), tobacco smoking including second-hand smoke (6.3%) and household air pollution from solid fuels (4.3%) [11].
The global burden of chronic respiratory diseases
The next three sections will discuss the global burden of chronic respiratory diseases. The focus will be on COPD, which is the chronic respiratory disease most related to ageing. We have also included information on interstitial lung diseases (ILDs), which are increasing related to ageing. Missing from this discussion is the important chronic respiratory disease asthma, which affects all age groups, including the elderly, but has not typically been considered a disease of ageing.
Mortality and disability-adjusted life-years
Two important metrics in determining the burden of disease are disease-related mortality and disease-related disability-adjusted life-years (DALYs). While death is a firm end-point, attribution of cause of death is sometimes difficult, particularly in the elderly or among those with multiple diseases. Most countries have systems in place where the underlying cause of death (of which there can only be one) is determined based on algorithms that look at all data contained on the death certificate and further review by nosologists. DALYs are an additional measure of disease burden that incorporates both premature death from a disease in addition to years of disability spent living with that disease (table 1).
Table 1. Definitions and concepts.
| Years of life lost (YLL) | A measure of premature mortality in the population | |
| Corresponds to the number of deaths (N) multiplied by the standard life expectancy (L) at the age at which death occurs for a given cause, age and sex: | ||
|
|
||
| Years lost due to disability (YLD) for people living with the health condition | Prevalence YLD: | |
|
|
||
| where P is the number of prevalent cases; DW is the disability weight, a weight factor that reflects the severity of the disease on a scale from 0 (perfect health) to 1 (dead); and L is the average duration of the case until remission or death (years) | ||
| Disability-adjusted life-year | One DALY can be thought of as one lost year of “healthy” life | |
| A measurement of the gap between current health status and an ideal health situation where the entire population lives to an advanced age, free of disease and disability | ||
| DALYs for a disease or health condition are calculated as the sum of the YLL due to premature mortality in the population and the years lost due to disability (YLD) for people living with the health condition or its consequences: | ||
|
|
||
| Developed regions | High-income Asia Pacific, Western Europe, high-income North America and Australasia | |
| Developing regions | A nation with a lower living standard, underdeveloped industrial base and low human development index (HDI) relative to other countries |
The number of deaths, globally, increased from 46.5 million in 1990 to 52.8 million deaths in 2010, although the overall mortality rates were trending downward during this period. Ischaemic heart disease, stroke, COPD, lower respiratory infections and lung cancer were the five leading causes of death in 2010 (fig. 4a) [6]. Combined, pulmonary diseases accounted for 7.3 million deaths or 14% of all deaths worldwide. COPD climbed to the third place among the leading causes of death worldwide by 2010. In absolute numbers, COPD was responsible for a total of 3.1 million deaths (95% uncertainty interval (UI) 2.9–3.4 million) in 1990 and 2.9 million (95% UI 2.7–3.3 million) in 2010. Lower respiratory tract infections accounted for 2.8 million deaths in 2010, and lung cancer increased from 1.0 million deaths in 1990 to 1.5 million deaths in 2010 and became the fifth cause of death worldwide (fig. 4b).
DALYs of leading diseases are noted in figure 5 for three different age groups. In both of the older age groups (50–69 years old and ≥70 years old), COPD is the third leading cause of DALYs.
Another important pulmonary disease affecting older adults is ILD. Although the absolute number of deaths for this condition does not parallel that described above for COPD, there has been a 77% increase in the number of deaths from 65 000 in 1990 to 115 000 in 2010 [6]. Deaths related to ILD are probably greatly underestimated, particularly in parts of the world where modern imaging technology, such as computed tomography scans, are not routinely available. As this technology becomes more available (and with the recent data demonstrating the efficacy of computed tomography scans for early detection of lung cancer [12, 13]), the burden of these diseases will probably increase.
Prevalence
The estimated prevalence of COPD in 28 countries among adults aged >40 years is 9–10% [14]. There are important regional differences in the estimated prevalence, due in part to methodological differences in case definition and classification using pre-bronchodilator spirometric values, the latter being important as the pre-bronchodilator spirometry could overestimate the presence of airway obstruction by up to 50% in some subgroups [15]. The best estimates of prevalence are provided by the Latin American Project for the Investigation of Obstructive Lung Disease (PLATINO) (five countries in Latin America) and Burden of Obstructive Lung disease (BOLD) study (12 countries) also demonstrated a significant variation in prevalence ranging from 5–20% [16] (fig. 6). Both studies are comparable as they used the same case definition and standardised post-bronchodilator spirometric values to estimate COPD prevalence. The large variation by region and country suggest differences in susceptibility and exposures.
Figure 6.

Chronic obstructive pulmonary disease prevalence by region. Data from [17, 18].
In figure 7, we arranged the prevalence in the 17 regions that participated in the PLATINO and BOLD studies, and compared prevalence of smoking, indoor and outdoor air pollution, and tuberculosis in these same countries. This comparison suggests that although cigarette smoking is the main risk factor for developing the disease, other environmental factors, exposures, and the cumulative effect of socioeconomic status and geographical latitude may influence disease progression, and therefore prevalence. This variability in the specific risk factors for COPD in different parts of the world and in different age groups may also be related to the multimorbidities that are found in different populations.
Figure 7.

Global prevalence of chronic obstructive pulmonary disease (COPD) and risk factors. PM10: particulate matter <10 μm in diameter; TB: tuberculosis. Data from [17, 18].
ILDs, including idiopathic pulmonary fibrosis (IPF), are less common than COPD but appear to be increasing in the population. The overall prevalence of IPF ranges from 0.5 to 27.9 per 100 000 population [19]. IPF represents about 20% of the burden of ILDs, so the total burden of ILD may be much higher [20].
Functional effects relevant to ageing
While financial burden, mortality and acute events requiring emergency treatment or hospital admissions (e.g. COPD exacerbations) are the usual metrics used to describe disease impact, the complex effects of chronic diseases in the elderly population, both from the individual and the societal perspectives, are insufficiently captured by these descriptors. Additional relevant measures, such as the need for informal caregivers (subtracting their participation in the regular workforce), home healthcare, nursing homecare and years lived with disability (or loss of disability-free years), are becoming more important to identify areas of intervention and prevention. Research efforts in this area are still limited, but growing. For example, COPD is associated with federal disability benefits in the USA, with an association strong or stronger than other chronic diseases such as cardiovascular disease [21], and subjects with COPD have significant loss of disability-free years, after adjusting for the effects of other chronic diseases [22]. Earlier steps in the development of disability (functional limitation to and dependency for activities of daily living) are also adversely impacted by COPD [23–25]. A growing understanding of these effects of COPD [26] will help to identify trajectories of decline important for future interventions.
Ageing and multimorbidity
Impact of ageing
The physiological changes of ageing and the impact of multimorbidity are discussed elsewhere in this article. Ageing is a heterogeneous process, with individuals ageing differently depending on their genetic background, environmental exposures and other factors. A component of ageing is the imbalance between inflammatory and anti-inflammatory networks in individuals resulting in a low-grade chronic inflammatory state referred to as “inflammaging” [27].
This chronic inflammatory state is also part of the development and progression of COPD, which is increasingly recognised as a systemic illness [28] Multiple diseases can coexist in an individual for a number of reasons, including: random chance (where two diseases are common in a population); two diseases that are part of the same continuum; two diseases that share a common risk factor; two diseases where one disease causes the second disease; and scenarios where the presence of one disease increases the risk of a second disease [29]. Ageing and multimorbidity contribute to frailty, which, in turn, confers a higher risk of a number of complications and poor outcomes such as falls, disability, hospitalisation and mortality [30, 31].
Multimorbidity increases in the elderly as was demonstrated in the study by Barnett et al. [31] that included 1.7 million patients in Scotland, UK, where 30.4% of adults aged 45 to 64 years reported at least two chronic conditions, increasing to 64.9% of adults aged 65 to 84 years and more than 80% for those above 85 years old (fig. 8). Similar findings were described in the USA Medicare enrolee population [32, 33]. These results are not unexpected, in that the longer one lives, the more likely one is to be diagnosed with any chronic disease. While many chronic diseases are ultimately lethal, there may be a long time before death occurs. Thus, increasing longevity with diseases that are not immediately lethal, such as hypertension, can be expected to result in multimorbidity in ageing populations.
Figure 8.

Number of chronic comorbidities by age stratum. The number of comorbidities increases with age and is larger in individuals 65 years and older. Reproduced from [28] with permission from the publisher.
Ageing can lead to the appearance of chronic diseases in different ways. In some instances, diseases become more common in the older population, with malignancies such as lung cancer or prostate cancer being examples. In other instances, the disease may have been present for some time but becomes more apparent with ageing because of the general senescence in multiple organ systems. Examples of this include arthritis and its complications. Often, there is an overlap of these processes, which is true for chronic respiratory disease. COPD is also a disease of ageing, with prevalence doubling for each decade of life above the age of 40 years [17]. Some authorities suggest that pulmonary fibrosis may also be related to injury to the ageing lung [34].
Another interesting measure of ageing and chronic lung diseases is the changing referral patterns for lung transplantation in the USA. In the early era of lung transplantation, there was an age limit of ≤60 years, but in recent years the age limit has been increased. The International Society of Heart and Lung Transplantation reports an increase in the median age of lung transplant recipients from 45 years in 1985 to 55 years in 2012 [35]. During 2000–2005, 3% of recipients were ≥65 years and 0.3% were ≥70 years. By 2006–2012, this proportion had increased to 10% and 3%, respectively. The increased age of recipients occurred mainly in the diagnostic groups of ILDs and COPD excluding α1-antitrypsin deficiency [35]. Interestingly, the presence of multiple chronic diseases is a contraindication for lung transplant.
Approaches to multimorbidity
Traditionally, researchers have focused on a single disease or disease pairs, but recent evidence supports departing from this reductionist approach towards more integrative studies assessing the relationship and impact of multimorbidities. This approach could reveal disease clusters and novel pathobiology mechanisms, and lead toward a better understanding and, possibly, integrated co-management [36– 39].
Using the mathematics of network theory [40], it has been demonstrated that disease coexistence is not the result of simple chance. For chronic NCDs, co-occurrence of diseases that are the result of genetic predisposition in combination with the cumulative effect of generic responses to biological stress, evoked either by the principal mutation and/or environmental exposures [40]. These generic responses constitute the so-called intermediate pathophenotypes and include: inflammation; thrombosis and haemorrhage; fibrosis; the immune response; proliferation; and apoptosis/necrosis. Given that these intermediate pathophenotypes constitute the entire range of human response to injury or infection, most chronic diseases can be linked back to these pathways. Hidalgo et al. [41] generated a visual map representing disease association in the US Medicare claim data (age ≥65 years), as shown in figure 9.
Figure 9.
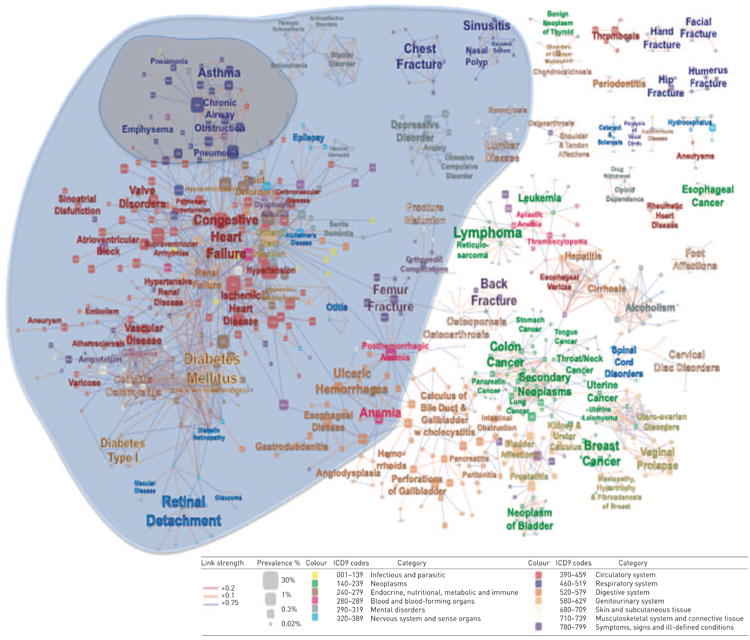
US Medicare claims disease network map. Nodes are diseases classified according to International Classification of Diseases (ICD)9 codes at the five-digit level. Link weight corresponds to the association between diseases. The blue area represents the respiratory disease neighbourhood and the grey area represents the interlinked comorbidities neighbourhood. Reproduced and modified from [41].
This map is two dimensional but attempts to portray multidimensional relationships. For example, “chronic airway obstruction” appears in the cluster of respiratory diseases in the upper left hand corner of the map and is surrounded by other chronic respiratory diseases but is also linked to congestive heart failure, which has been well described [42]. Other data, however, have shown links between COPD and lung cancer [43] and diabetes [44], yet this map does not show a direct connection between these diseases.
Patients with COPD have, on average, four to six chronic comorbidities, compared with two to three comorbidities in age-matched controls [45–47]. Considering COPD as the index disease, prevalent comorbidities include cardiovascular, metabolic, musculoskeletal, cancer and psychiatric conditions, which are presented in detail in table 2 using data from multiple studies. Variability in comorbidity prevalence exists and probably represents the differences in disease ascertainment in each study, as they used administrative databases, patient self-reported disease, and data extracted from medical records or measured with specific cut-offs [42, 44, 46, 48, 49]. Nevertheless, compared with aged-matched subjects without COPD, the prevalence of such comorbidities are 1.5–2 times higher (table 2).
Table 2. Chronic obstructive pulmonary disease (COPD) comorbidity prevalence from studies that included multiple comorbidities in their analysis.
| First auther[ref] | ||||||||||
|---|---|---|---|---|---|---|---|---|---|---|
|
|
||||||||||
| Divo [46] | Vanfleteren [48] | Mapel [45] | Cazzola [44] | Van Manen [49] | Schnell [42] | |||||
|
| ||||||||||
| Disease ascertainment | Self-reported | Measured | Administrative database | Administrative database | Administrative database | Self-reported/measured | ||||
|
| ||||||||||
| COPD | Control | COPD | Control | COPD | Control | COPD | Control | |||
| Subjects n | 1659 | 213 | 200 | 200 | 15 000 | 325 000 | 290 | 421 | 995 | 14828 |
| Hypertension | 52.3 | 48 | 45 | 36.5 | 22.7 | 21.4 | 60.4 | 52.2 | ||
| Hyperlipidaemia | 43.5 | 36 | 47.6 | 41.3 | ||||||
| CAD | 30.2 | 9 | 22 | 14.5 | 15.9 | 6.6 | ||||
| Obesity | 29.0 | 23 | 40.3 | 33.5 | ||||||
| DJD | 28.7 | 22 | 19.5 | 54.6 | 36.9 | |||||
| Muscle wasting | 28 | |||||||||
| Diabetes mellitus | 21.5 | 54 | 8 | 6.5 | 18.7 | 10.5 | 7.1 | 4.6 | 16.3 | 12.8 |
| GORD | 17.7 | |||||||||
| PAD | 16.7 | 53 | 5.5 | 1.7 | ||||||
| Depression | 16.7 | 16 | 17 | 13 | 7.4 | 5.3 | 8.7 | 4.4 | 20.6 | 12.5 |
| CRF | 16.7 | 22 | 1.5 | 1 | 16.2 | 10.5 | ||||
| CHF | 15.7 | 13.5 | 2.5 | 7.9 | 2.0 | 12.1 | ||||
| Underweight | 15.0 | 14 | ||||||||
| Substance abuse | 13.8 | |||||||||
| Atrial fibrillation | 13.0 | |||||||||
| Anxiety | 11.9 | 21 | 8.6 | 3.8 | ||||||
| Erectile dysfunction | 11.7 | |||||||||
| Gastric/duodenal ulcer | 11.5 | 32 | 17 | 7.2 | 1.5 | |||||
| CVA | 10.7 | 4 | 3.5 | 3.1 | 3.7 | 8.9 | 4.5 | |||
| Pulmonary HTN+CP | 10.2 | |||||||||
| OSA | 10.1 | |||||||||
| Lung cancer | 9.1 | 1.9 | 0.4 | |||||||
| Osteoporosis | 8.4 | 31 | 14.8 | 10.8 | 16.9 | 8.5 | ||||
| Hypothyroidism | 7.0 | |||||||||
| Breast cancer | 7.0 | |||||||||
| AAA | 6.5 | |||||||||
| Pulmonary fibrosis | 6.1 | |||||||||
| DVT | 5.1 | |||||||||
| Anaemia | 5 | 9.3 | 6.2 | |||||||
| Cardiac arrhythmia | 12 | 9.5 | 13.6 | 6.9 | ||||||
Data are presented as % unless otherwise stated. CAD: coronary artery disease; DJD: degenerative joint disease; GORD: gastro-oesophageal reflux disease; PAD: peripheral artery disease; CRF: chronic renal failure; CHF: congestive heart failure; CVA: cerebrovascular accident; HTN: hypertension; CP: cor pulmonale; OSA: obstructive sleep apnoea; AAA: abdominal aortic aneurism; DVT: deep-venous thrombosis.
For IPF, there are no large-scale epidemiological studies looking at multimorbidity, although one small study showed higher mortality when comorbid cardiovascular disease was present [50] and another showed a high prevalence of comorbid depression [51]. As noted earlier, the prevalence estimates for ILDs vary greatly [20, 52–56] and are much lower than that of COPD. The wide range in these numbers is probably explained by the previous lack of a uniform definition used in identifying cases of IPF, as well as by differences in study designs and populations. 80% of patients with IPF die from respiratory failure, although heart failure, bronchogenic carcinoma, ischaemic heart disease, infection and pulmonary embolism are also common, suggesting that comorbidity may be associated with and play a significant role in the disease [57].
Conclusions
The population of the world is ageing rapidly, with a global shift from communicable, maternal, neonatal and nutritional causes of morbidity and mortality toward noncommunicable ones. With increasing survival into old age, the likelihood of developing multiple chronic diseases also increases. Chronic respiratory diseases increase with age and are linked to many other diseases due to both shared risk factors and the intermediate phenotypes of inflammation, thrombosis and haemorrhage, fibrosis, the immune response, proliferation, and apoptosis/necrosis. The future interventions of chronic respiratory diseases will have to consider how multiple morbidities related to these diseases impact prognosis and therapy. Conversely, not all patients with chronic respiratory diseases develop other disabling chronic illnesses. Better understanding the factors that lead to the development (and nondevelopment) of multiple morbidities in these patients may lead to improved treatments and outcomes.
Footnotes
Conflict of interest: Disclosures can be found alongside the online version of this article at erj.ersjournals.com
References
- 1.US Census Bureau. Global Population at a Glance: 2002 and Beyond. [Date last accessed: April 15, 2014]; www.census.gov/prod/2004pubs/wp02-1.pdf. Date last updated: March 2004.
- 2.Wang H, Dwyer-Lindgren L, Lofgren KT, et al. Age-specific and sex-specific mortality in 187 countries, 1970–2010: a systematic analysis for the Global Burden of Disease Study 2010. Lancet. 2012;380:2071–2094. doi: 10.1016/S0140-6736(12)61719-X. [DOI] [PubMed] [Google Scholar]
- 3.Gutierrez AM, Nobauer K, Soler L, et al. Detection of potential markers for systemic disease in saliva of pigs by proteomics: a pilot study. Vet Immunol Immunopathol. 2013;151:73–82. doi: 10.1016/j.vetimm.2012.10.007. [DOI] [PubMed] [Google Scholar]
- 4.United Nations. World Population Ageing 2013. [pdf Date last accessed: March 27, 2014]; www.un.org/en/development/desa/population/publications/pdf/ageing/WorldPopulationAgeingReport2013. Date last updated: March 2005.
- 5.Kinsella K, Phillips DR. Global Aging: the Challenge of Success. [Date last accessed: March 27, 2014]; www.prb.org/pdf05/60.1globalaging.pdf. Date last updated: March 2005.
- 6.Lozano R, Naghavi M, Foreman K, et al. Global and regional mortality from 235 causes of death for 20 age groups in 1990 and 2010: a systematic analysis for the Global Burden of Disease Study 2010. Lancet. 2012;380:2095–2128. doi: 10.1016/S0140-6736(12)61728-0. [DOI] [PMC free article] [PubMed] [Google Scholar]
- 7.Global Burden of Disease Study. Results by cause 1990–2010. Seattle: University of Washington; 2012. [Google Scholar]
- 8.Institute for Health Metrics and Evaluation. GBD 2010 Arrow Diagram. [Date last accessed: March 23, 2014]; http://vizhub.healthdata.org/irank/arrow.php. Date last updated: 2013.
- 9.Valderas JM, Starfield B, Sibbald B, et al. Defining comorbidity: implications for understanding health and health services. Ann Fam Med. 2009;7:357–363. doi: 10.1370/afm.983. [DOI] [PMC free article] [PubMed] [Google Scholar]
- 10.Kuh D, Karunananthan S, Bergman H, et al. A life-course approach to healthy ageing: maintaining physical capability. Proc Nutr Soc. 2014;73:237–248. doi: 10.1017/S0029665113003923. [DOI] [PMC free article] [PubMed] [Google Scholar]
- 11.Lim SS, Vos T, Flaxman AD, et al. A comparative risk assessment of burden of disease and injury attributable to 67 risk factors and risk factor clusters in 21 regions, 1990-2010: a systematic analysis for the Global Burden of Disease Study 2010. Lancet. 2012;380:2224–2260. doi: 10.1016/S0140-6736(12)61766-8. [DOI] [PMC free article] [PubMed] [Google Scholar]
- 12.National Lung Screening Trial Research Team. Church TR, Black WC, et al. Results of initial low-dose computed tomographic screening for lung cancer. N Engl J Med. 2013;368:1980–1991. doi: 10.1056/NEJMoa1209120. [DOI] [PMC free article] [PubMed] [Google Scholar]
- 13.Jin GY, Lynch D, Chawla A, et al. Interstitial lung abnormalities in a CT lung cancer screening population: prevalence and progression rate. Radiology. 2013;268:563–571. doi: 10.1148/radiol.13120816. [DOI] [PMC free article] [PubMed] [Google Scholar]
- 14.Halbert RJ, Natoli JL, Gano A, et al. Global burden of COPD: systematic review and meta-analysis. Eur Respir J. 2006;28:523–532. doi: 10.1183/09031936.06.00124605. [DOI] [PubMed] [Google Scholar]
- 15.Johannessen A, Omenaas ER, Bakke PS, et al. Implications of reversibility testing on prevalence and risk factors for chronic obstructive pulmonary disease: a community study. Thorax. 2005;60:842–847. doi: 10.1136/thx.2005.043943. [DOI] [PMC free article] [PubMed] [Google Scholar]
- 16.Mannino DM, Buist AS. Global burden of COPD: risk factors, prevalence, and future trends. Lancet. 2007;370:765–773. doi: 10.1016/S0140-6736(07)61380-4. [DOI] [PubMed] [Google Scholar]
- 17.Buist AS, McBurnie MA, Vollmer WM, et al. International variation in the prevalence of COPD (the BOLD Study): a population-based prevalence study. Lancet. 2007;370:741–750. doi: 10.1016/S0140-6736(07)61377-4. [DOI] [PubMed] [Google Scholar]
- 18.Menezes AM, Perez-Padilla R, Jardim JR, et al. Chronic obstructive pulmonary disease in five Latin American cities (the PLATINO study): a prevalence study. Lancet. 2005;366:1875–1881. doi: 10.1016/S0140-6736(05)67632-5. [DOI] [PubMed] [Google Scholar]
- 19.Kaunisto J, Salomaa ER, Hodgson U, et al. Idiopathic pulmonary fibrosis–a systematic review on methodology for the collection of epidemiological data. BMC Pulm Med. 2013;13:53. doi: 10.1186/1471-2466-13-53. [DOI] [PMC free article] [PubMed] [Google Scholar]
- 20.Raghu G, Weycker D, Edelsberg J, et al. Incidence and prevalence of idiopathic pulmonary fibrosis. Am J Respir Crit Care Med. 2006;174:810–816. doi: 10.1164/rccm.200602-163OC. [DOI] [PubMed] [Google Scholar]
- 21.Thornton Snider J, Romley JA, Wong KS, et al. The Disability burden of COPD. COPD. 2012;9:513–521. doi: 10.3109/15412555.2012.696159. [DOI] [PubMed] [Google Scholar]
- 22.Locke E, Thielke S, Diehr P, et al. Effects of respiratory and non-respiratory factors on disability among older adults with airway obstruction: the Cardiovascular Health Study. COPD. 2013;10:588–596. doi: 10.3109/15412555.2013.781148. [DOI] [PMC free article] [PubMed] [Google Scholar]
- 23.Rodriguez-Rodriguez P, Jimenez-Garcia R, Hernandez-Barrera V, et al. Prevalence of physical disability in patients with chronic obstructive pulmonary disease and associated risk factors. COPD. 2013;10:611–617. doi: 10.3109/15412555.2013.781150. [DOI] [PubMed] [Google Scholar]
- 24.Eisner MD, Iribarren C, Blanc PD, et al. Development of disability in chronic obstructive pulmonary disease: beyond lung function. Thorax. 2011;66:108–114. doi: 10.1136/thx.2010.137661. [DOI] [PMC free article] [PubMed] [Google Scholar]
- 25.Gaugler JE, Duval S, Anderson KA, Kane RL. Predicting nursing home admission in the U.S: a meta-analysis. BMC Geriatr. 2007;7:13. doi: 10.1186/1471-2318-7-13. [DOI] [PMC free article] [PubMed] [Google Scholar]
- 26.Janaudis-Ferreira T, Beauchamp MK, Robles PG, et al. Measurement of activities of daily living in patients with COPD: a systematic review. Chest. 2014;145:253–271. doi: 10.1378/chest.13-0016. [DOI] [PubMed] [Google Scholar]
- 27.Franceschi C, Capri M, Monti D, et al. Inflammaging and anti-inflammaging: a systemic perspective on aging and longevity emerged from studies in humans. Mech Ageing Dev. 2007;128:92–105. doi: 10.1016/j.mad.2006.11.016. [DOI] [PubMed] [Google Scholar]
- 28.Fabbri LM, Rabe KF. From COPD to chronic systemic inflammatory syndrome? Lancet. 2007;370:797–799. doi: 10.1016/S0140-6736(07)61383-X. [DOI] [PubMed] [Google Scholar]
- 29.Neale MC, Kendler KS. Models of comorbidity for multifactorial disorders. Am J Hum Genet. 1995;57:935–953. [PMC free article] [PubMed] [Google Scholar]
- 30.Fried LP, Ferrucci L, Darer J, et al. Untangling the concepts of disability, frailty, and comorbidity: implications for improved targeting and care. J Gerontol A Biol Sci Med Sci. 2004;59:255–263. doi: 10.1093/gerona/59.3.m255. [DOI] [PubMed] [Google Scholar]
- 31.Barnett K, Mercer SW, Norbury M, et al. Epidemiology of multimorbidity and implications for health care, research, and medical education: a cross-sectional study. Lancet. 2012;380:37–43. doi: 10.1016/S0140-6736(12)60240-2. [DOI] [PubMed] [Google Scholar]
- 32.Wolff JL, Starfield B, Anderson G. Prevalence, expenditures, and complications of multiple chronic conditions in the elderly. Arch Intern Med. 2002;162:2269–2276. doi: 10.1001/archinte.162.20.2269. [DOI] [PubMed] [Google Scholar]
- 33.Freid VM, Bernstein AB, Bush MA. Multiple chronic conditions among adults aged 45 and over: trends over the past 10 years. NCHS Data Brief. 2012;100:1–8. [PubMed] [Google Scholar]
- 34.Leslie KO. Idiopathic pulmonary fibrosis may be a disease of recurrent, tractional injury to the periphery of the aging lung: a unifying hypothesis regarding etiology and pathogenesis. Arch Pathol Lab Med. 2012;136:591–600. doi: 10.5858/arpa.2011-0511-OA. [DOI] [PubMed] [Google Scholar]
- 35.Yusen RD, Christie JD, Edwards LB, et al. The Registry of the International Society for Heart and Lung Transplantation: Thirtieth Adult Lung and Heart–Lung Transplant Report – 2013; focus theme: age. J Heart Lung Transplant. 2013;32:965–978. doi: 10.1016/j.healun.2013.08.007. [DOI] [PubMed] [Google Scholar]
- 36.Garfinkel D, Mangin D. Feasibility study of a systematic approach for discontinuation of multiple medications in older adults: addressing polypharmacy. Arch Intern Med. 2010;170:1648–1654. doi: 10.1001/archinternmed.2010.355. [DOI] [PubMed] [Google Scholar]
- 37.Fabbri LM, Boyd C, Boschetto P, et al. How to integrate multiple comorbidities in guideline development: article 10 in Integrating and coordinating efforts in COPD guideline development. An official ATS/ERS workshop report. Proc Am Thorac Soc. 2012;9:274–281. doi: 10.1513/pats.201208-063ST. [DOI] [PMC free article] [PubMed] [Google Scholar]
- 38.Boyd CM, Darer J, Boult C, et al. Clinical practice guidelines and quality of care for older patients with multiple comorbid diseases: implications for pay for performance. JAMA. 2005;294:716–724. doi: 10.1001/jama.294.6.716. [DOI] [PubMed] [Google Scholar]
- 39.van Weel C, Schellevis FG. Comorbidity and guidelines: conflicting interests. Lancet. 2006;367:550–551. doi: 10.1016/S0140-6736(06)68198-1. [DOI] [PubMed] [Google Scholar]
- 40.Barabasi AL, Gulbahce N, Loscalzo J. Network medicine: a network-based approach to human disease. Nat Rev Genet. 2011;12:56–68. doi: 10.1038/nrg2918. [DOI] [PMC free article] [PubMed] [Google Scholar]
- 41.Hidalgo CA, Blumm N, Barabasi AL, et al. A dynamic network approach for the study of human phenotypes. PLoS Comput Biol. 2009;5:e1000353. doi: 10.1371/journal.pcbi.1000353. [DOI] [PMC free article] [PubMed] [Google Scholar]
- 42.Schnell K, Weiss CO, Lee T, et al. The prevalence of clinically-relevant comorbid conditions in patients with physician-diagnosed COPD: a cross-sectional study using data from NHANES 1999–2008. BMC Pulm Med. 2012;12:26. doi: 10.1186/1471-2466-12-26. [DOI] [PMC free article] [PubMed] [Google Scholar]
- 43.Decramer M, Janssens W. Chronic obstructive pulmonary disease and comorbidities. Lancet Respir Med. 2013;1:73–83. doi: 10.1016/S2213-2600(12)70060-7. [DOI] [PubMed] [Google Scholar]
- 44.Cazzola M, Bettoncelli G, Sessa E, et al. Prevalence of comorbidities in patients with chronic obstructive pulmonary disease. Respiration. 2010;80:112–119. doi: 10.1159/000281880. [DOI] [PubMed] [Google Scholar]
- 45.Mapel DW, Hurley JS, Frost FJ, et al. Health care utilization in chronic obstructive pulmonary disease. A case– control study in a health maintenance organization. Arch Intern Med. 2000;160:2653–2658. doi: 10.1001/archinte.160.17.2653. [DOI] [PubMed] [Google Scholar]
- 46.Divo M, Cote C, de Torres JP, et al. Comorbidities and risk of mortality in patients with chronic obstructive pulmonary disease. Am J Respir Crit Care Med. 2012;186:155–161. doi: 10.1164/rccm.201201-0034OC. [DOI] [PubMed] [Google Scholar]
- 47.Soriano JB, Visick GT, Muellerova H, et al. Patterns of comorbidities in newly diagnosed COPD and asthma in primary care. Chest. 2005;128:2099–2107. doi: 10.1378/chest.128.4.2099. [DOI] [PubMed] [Google Scholar]
- 48.van Manen JG, Bindels PJ, IJzermans CJ, et al. Prevalence of comorbidity in patients with a chronic airway obstruction and controls over the age of 40. J Clin Epidemiol. 2001;54:287–293. doi: 10.1016/s0895-4356(01)00346-8. [DOI] [PubMed] [Google Scholar]
- 49.Vanfleteren LE, Spruit MA, Groenen M, et al. Clusters of comorbidities based on validated objective measurements and systemic inflammation in patients with chronic obstructive pulmonary disease. Am J Respir Crit Care Med. 2013;187:728–735. doi: 10.1164/rccm.201209-1665OC. [DOI] [PubMed] [Google Scholar]
- 50.Hyldgaard C, Hilberg O, Bendstrup E. How does comorbidity influence survival in idiopathic pulmonary fibrosis? Respir Med. 2014;108:647–653. doi: 10.1016/j.rmed.2014.01.008. [DOI] [PubMed] [Google Scholar]
- 51.Ryerson CJ, Arean PA, Berkeley J, et al. Depression is a common and chronic comorbidity in patients with interstitial lung disease. Respirology. 2012;17:525–532. doi: 10.1111/j.1440-1843.2011.02122.x. [DOI] [PubMed] [Google Scholar]
- 52.Raghu G, Collard HR, Egan JJ, et al. An official ATS/ERS/JRS/ALAT statement: idiopathic pulmonary fibrosis: evidence-based guidelines for diagnosis and management. Am J Respir Crit Care Med. 2011;183:788–824. doi: 10.1164/rccm.2009-040GL. [DOI] [PMC free article] [PubMed] [Google Scholar]
- 53.Demedts M, Wells AU, Anto JM, et al. Interstitial lung diseases: an epidemiological overview. Eur Respir J. 2001;18(Suppl. 32):2s–16s. [PubMed] [Google Scholar]
- 54.Roelandt M, Demedts M, Callebaut W, et al. Epidemiology of interstitial lung disease (ILD) in Flanders: registration by pneumologists in 1992–1994. Working group on ILD, VRGT. Vereniging voor Respiratoire Gezondheidszorg en Tuberculosebestrijding. Acta Clin Belg. 1995;50:260–268. doi: 10.1080/17843286.1995.11718459. [DOI] [PubMed] [Google Scholar]
- 55.Coultas DB, Zumwalt RE, Black WC, et al. The epidemiology of interstitial lung diseases. Am J Respir Crit Care Med. 1994;150:967–972. doi: 10.1164/ajrccm.150.4.7921471. [DOI] [PubMed] [Google Scholar]
- 56.Raghu G, Nyberg F, Morgan G. The epidemiology of interstitial lung disease and its association with lung cancer. Br J Cancer. 2004;91(Suppl. 2):S3–S10. doi: 10.1038/sj.bjc.6602061. [DOI] [PMC free article] [PubMed] [Google Scholar]
- 57.Olson AL, Swigris JJ. Idiopathic pulmonary fibrosis: diagnosis and epidemiology. Clin Chest Med. 2012;33:41–50. doi: 10.1016/j.ccm.2011.12.001. [DOI] [PubMed] [Google Scholar]