Abstract
Background:
Cell culture techniques have many advantages for investigation of drug transport to target organ like liver. HepG2 and Huh-7 are two cell lines available from hepatoma that can be used as a model for hepatic drug transport. The present study is aimed to analyze the expression level of several drug transporter genes in two hepatoma cell lines, HepG2 and Huh-7 and their response to inhibitors.
Materials and Methods:
This is an in vitro study using HepG2 and Huh-7 cells. The expression level of the following drug transporter genes was quantified: P-glycoprotein/multidrug resistance protein 1, Organic Anionic Transporter Protein 1B1 (OATP1B1) and Organic Cationic Transporter-1 (OCT1). Ribonucleic acid was extracted from the cells using Tripure isolation reagent, then gene expression level of the transporters is quantified using Applied Biosystems quantitative reverse transcriptase polymerase chain reaction. Verapamil (P-glycoprotein inhibitor), nelfinavir (OATP1B1 inhibitor), quinidine (OCT1 inhibitor) were used to differentiate the inhibitory properties of these agents to the transporter expressions in HepG2 and Huh-7 cells.
Results:
Huh-7 shows a higher level of P-glycoprotein, OATP1B1 and OCT1 expressions compared with those of HepG2. Verapamil reduces the expressions of P-glycoprotein in HepG2 and Huh-7; nelfinavir reduces the expression of OATP1B1 in HepG2 and Huh-7; while quinidine reduces the OCT1 gene expressions in HepG2, but not in Huh-7 cells.
Conclusion:
This study indicates that HepG2 might be a more suitable in vitro model than Huh-7 to study drug transport in hepatocytes involving drug transporters.
Keywords: HepG2, Huh-7, in vitro model, transporters
INTRODUCTION
In the field of pharmacokinetics, the importance of drug transporters as factors in determining drug efficacy and tissue distribution and elimination has recently been recognized.[1,2] Drug elimination in the liver consists of the following process: (1) Hepatic uptake; (2) metabolism and/or (3) biliary excretion and (4) sinusoidal efflux from the inside of the cell to the blood. Among these process, drug transporters are involved in the uptake, sinusoidal efflux and biliary excretion.[3] It should be noted that hepatic uptake and biliary excretion determine the drug concentration in the liver.[4] Thus, action of drug transporters is also determinant of pharmacological effects of drugs whose target is in the liver.[3]
Until now, primary human hepatocytes are still gold standard to study human drug metabolism and transport, but their availability is limited.[2,5] Therefore, hepatoma cell lines can serve as valuable alternatives to study transport of drugs and xenobiotic to the liver. The use of cell lines has many advantages for investigation of drug transport to target organs like liver. The major advantage of cell lines is immediate availability, standardized culture conditions and unlimited life span.[6]
HepG2 and Huh-7 are two cell lines available from hepatoma that can be used as a model for hepatic drug transport. HepG2 is widely used human hepatocellular carcinomas that are highly differentiated and display many of the genotypic features of the normal liver cells.[7] HepG2 is a standard in vitro model for drug metabolism and transport study, despite the low expression levels of drug metabolizing enzymes.[8,9] Recently, Huh-7, a human hepatoma cell line, frequently used as in vitro system to study hepatotoxicity, hepatitis C virus infection and gene regulation, has been used as an alternative to HepG2 cell line for drug metabolism and transport study.[10]
The present study is aimed to analyze the expressions of several drug transporters in two hepatoma cell lines, HepG2 and Huh-7 and their response to inhibitors. Tissue specific messenger ribonucleic acid (mRNA) expression profiles proved to be important information to study the mechanism of drug disposition. The information gained from this study provides gene expression profiles of HepG2 and Huh-7 cell lines for the use of future research using in vitro model for drug transports in the liver.
MATERIALS AND METHODS
Cell culture
HepG2 cells were obtained from BPPT Serpong while Huh-7 was a kind gift from Dr. Chie Aoki, Kobe University.
The human hepatoma HepG2 cell line was cultured in Roswell Park Memorial Institute 1640 medium supplemented with 10% heat-inactivated fetal bovine serum, 100 IU/mL penicillin, 100 µg/mL streptomycin and 1% fungizone.
The human hepatoma Huh-7 cell line was grown in Dulbecco's modified Eagle's medium supplemented with 10% heat-inactivated fetal bovine serum, 100 IU/mL penicillin and 100 µg/mL streptomycin, 1% Fungizone and 1% non-essential amino acids. Medium was routinely changed every 2 days. The cells were sub-cultured when reaching 90% of confluence. All the cell culture plates were purchased from NUNC Thermo Fisher Scientific and culture media and supplements from Invitrogen.
RNA extraction
Total RNA was extracted using Tripure Isolation Reagents (Roche) according to the manufacturer's protocol. Quantity and purity of the RNA were determined by measuring absorbance in 260/280 nm wavelength using NanoDrop spectrophotometer. RNA was then subjected to quantitative reverse transcriptase polymerase chain reaction (qRT-PCR)
qRT-PCR
The mRNA expression levels of the following drug transporters were determined: P-glycoprotein/ABCB1, Organic Anionic Transporter Protein 1B1 (OATP1B1) and Organic Cationic Transporter-1 (OCT1).
qRT-PCR was done using SYBR Green methodology from KAPA Biosystem, USA and ABI Prism 7500 detector (Applied Biosystems). Primers for transporters are as described previously:
ABCB1, ABCB1_F: AAAGCGACTGAATGTTCAGTGG; ABCB_R: TTCACCTTCCCAAAGACCAC.[11] OATP1B1, OATP1B1_F: GAATGCCCAAGAGATGATGCTT; OATP1B1_R: AATCCAGTGCAAGTGATTTCAAT.[12] OCT1, OCT1_F: CGCCGAGAACCTTGGGAGAAA; OCT1_R: AATAGATGCCTTTCTGTGCCAG.[13] Cyclophilin A was used as housekeeping gene. Primers for cyclophilin A: cyclophilinA_F AGCATACAGGTCCTGGCATC; cyclophilinA_R: TTCACCTTCCCAAAGACCAC.[14]
PCR reaction mixture was prepared using the following reagents: 10 µL KAPA SYBR Fast qPCR master mix, 200 nM forward primer, 200 nM reverse primer, 200 µM dUTP, 0,4 µL KAPA RT mix, 500 ng RNA template and RNAse free water up to 20 µL.
Samples were incubated in qRT-PCR machine with the following conditions: Complementary deoxyribonucleic acid synthesis at 50°C for 2 min, RT enzymes inactivation at 95°C for 10 min, 40 cycles consists of 15 s at 95°C for denaturation step; 1 min at 60° for annealing step and 30 s for extension step. Melting curve analysis was performed for 80 cycles of: 1 min at 95°C; 1 min at 60°C and 15 s at 95°C. Ct was generated automatically by ABI Prism™ software (Applied Biosystems Inc). Level of mRNA transporter expressions in untreated HepG2 and Huh-7 cells were calculated using the equation of 2^-d(Ct),[15,16] while the relative mRNA transporter expressions in cells treated with inhibitors were calculated using Livak and Schmittgen method.[17]
Treatment with inhibitors
Verapamil (P-glycoprotein inhibitor), nelfinavir (OATP1B1 inhibitor), quinidine (OCT1 inhibitor) were used to differentiate the inhibitory properties of these agents to the transporter gene expression levels in HepG2 and Huh-7 cells.
HepG2 and Huh-7 cells were exposed to verapamil (10, 25 and 50 µM) for P-glycoprotein inhibition, or nelfinavir (1, 2.5 and 5 µM) for OATP1B1 inhibition or quinidine (25, 63 and 125 µM) for OCT1 inhibition for 24 h. All the inhibitors were dissolved in double-distilled water then diluted with serum-free medium.
Data analysis
The data were presented in the form of means ± standard deviation. Graphs were created using GraphPad Prism software (GraphPad Software, Inc, USA).
RESULTS
Comparison of cell morphology and growth characteristics
HepG2 and Huh-7 cells morphology have closely related characteristics. The photographs of cell morphology are shown in Figure 1. HepG2 and Huh-7 cells display the typical epithelial-like morphology. Both cells show uniform shapes throughout the vessel. HepG2 cells are somewhat bigger and easier to observe under inverted microscope.
Figure 1.
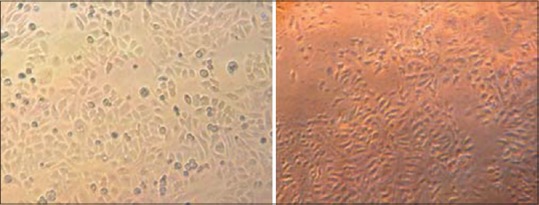
Morphology of cells used for analysis of transporter gene expression level. (a) HepG2 cells, (b) Huh-7 cells. Photographed under contrast phase microscope
Growth characteristics
To observe growth characteristics of HepG2 and Huh-7 cells, suspension of cells containing 300,000 cells/well were applied to 6-well plates. Number of the cells was counted every day up to 6 days after plating. HepG2 cells grow faster and easier with calculated doubling time of 2.05 days and Huh-7 with 1.98 days [Figure 2].
Figure 2.
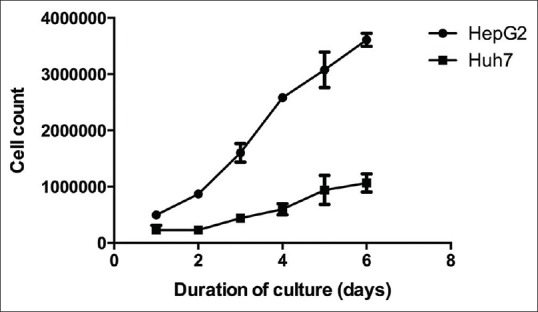
Growth of HepG2 and Huh-7 cells from day 1 to day 6. Calculated doubling time for HepG2 cells = 1.98 days, while for Huh-7 cells = 2.05 days
Level of mRNA expressions of P-glycoprotein, OATP1B1 and OCT1
We calculated level of mRNA expressions of P-glycoprotein, OATP1B1 and OCT1 with the equation of 2^-d (Ct) (normalized to cyclophilin A as reference gene) [Figure 3]. We find that for all three transporters, HepG2 showed significantly lower level of mRNA expressions compared with those in Huh-7 cells.
Figure 3.
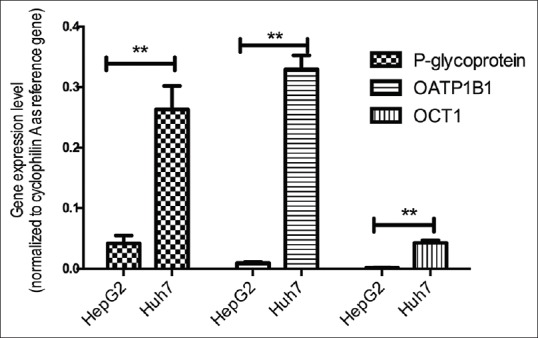
Messenger ribonucleic acid expression levels of P-glycoprotein, Organic Anionic Transporter Protein 1B1 and Organic Cationic Transporter-1 as calculated by 2^-d(Ct) (normalized to cyclophilin A as reference gene). **P<0.001
Relative mRNA expression levels of P-glycoprotein, OATP1B1 and OCT1 in HepG2 cells after treatment with inhibitors
Figure 4 gives detail information on the inhibitory properties of verapamil, nelfinavir and quinidine on P-glycoprotein, OATP1B1 and OCT1 mRNA expression, respectively. Verapamil modifies P-glycoprotein mRNA expressions in a dose-dependent manner. Nelfinavir strongly modifies mRNA expressions of OATP1B1 also in a dose-dependent manner. While quinidine decreases the mRNA expression level of OCT1 at concentrations of 25, 63 and 125 µM.
Figure 4.
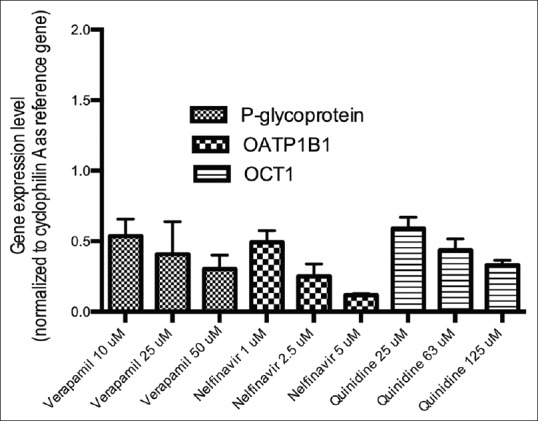
Gene expression levels of several drug transporter genes after treatment with inhibitors: Verapamil (P-glycoprotein inhibitor); nelfinavir (Organic Anionic Transporter Protein 1B1 inhibitor) and quinidine (Organic Cationic Transporter-1 inhibitor) in HepG2 cells
Relative mRNA expressions of P-glycoprotein, OATP1B1 and OCT1 in Huh-7 cells after treatment with inhibitors
Inhibitory effect of verapamil, nelfinavir and quinidine on P-glycoprotein, OATP1B1 and OCT1 were presented in Figure 5. Huh-7 exposure to verapamil resulted in the reduction of Pgp mRNA expression. Nelfinavir at concentration of 1, 2.5 and 5 µM reduces the expression of OATP1B1 mRNA expression in Huh-7 cells. Unlike the effect of quinidine in HepG2 cells, quinidine at concentrations of 25 and 63 µM did not result in the reduction of OCT1 expression. Quinidine can suppress the expression of OCT1 only at the highest concentration used (125 µM).
Figure 5.
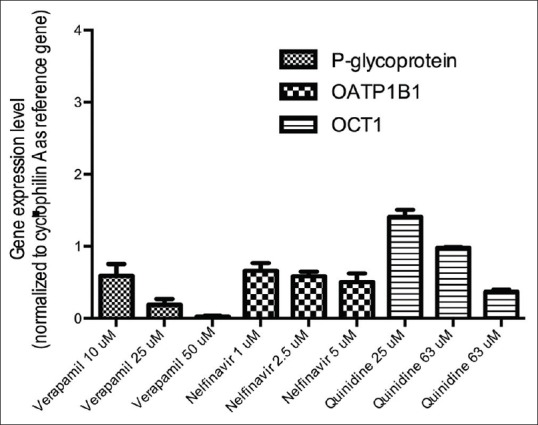
Relative expressions of several drug transporters gene after treatment with inhibitors: P-verapamil (P-glycoprotein inhibitor); nelfinavir (Organic Anionic Transporter Protein 1B1 inhibitor) and quinidine (Organic Cationic Transporter-1 inhibitor) in Huh-7 cells
DISCUSSION
Cell lines are often used as in vitro models of human tissues.[18] However, gene expression levels were in general low in comparison with those in human tissues.[16] For the study of drug transport in the liver, primary human hepatocytes are still gold standard.[2,5] However, due to limited availability of human hepatocytes, cell culture can be used as an alternative. Therefore, characterization of drug transporters in hepatoma cell lines is important, that can provide valuable information for future studies.
Many of the studies on gene expressions for drug metabolism and transports for several cell lines have been reported previously.[6,19] Despite the wide use of HepG2 and Huh-7 as tools for pharmacological and toxicological studies,[6,7,10] recent findings by Guo et al.[19] in several hepatic cell lines showed that HepG2 and Huh-7 have a large difference in drug-metabolizing enzymes and transporters expression levels.
Our present study confirmed previous findings reported by Guo et al.[19] which showed that HepG2 cells expressed significantly lower levels of drug transporter genes. Our study were not only confirming existing knowledge on transporter gene expression levels, but also reported their response to inhibitors that have not been reported previously.
Transporters investigated in this study are three major transporters in the liver.[20,21] P-glycoprotein is the most recognized efflux transporter that mediates the transports of hydrophobic cations.[22] OATP1B1 and OCT1 are uptake transporters that extract its substrates from portal blood into the hepatocytes.[23] OATP1B1 has been shown to transport organic anionic compounds and OCT1 transports cationic organic substances.[24]
Our results showed that HepG2 expressed a low level of P-glycoprotein, OATP1B1 and OCT1. This result is in accordance with the Hilgendorf et al.[15] that showed that HepG2 express a low level of transporter genes. Huh-7 cells expressed a much higher level of P-glycoprotein, OATP1B1 and OCT1.
Our study showed that Huh-7 expressed moderate level of transporter genes. This results confirmed similar findings reported by Sivertsson et al.[10] and Guo et al.[19] However, choosing a specific cell lines as surrogate for human hepatocytes is rather difficult, given the markedly high variability across studies in primary hepatocytes. The study by Nishimura and Naito[21] in normal hepatocytes showed that the overall expressions of drug transporters is low while other studies reported by Nishimura and Naito[25] reported that the expression of OCT1 is relatively high while for OATP1B1 and P-glycoprotein is very low.
After the determination of transporter's mRNA expression levels in HepG2 and Huh-7 cells, these cells were exposed to inhibitors of P-glycoprotein, OATP1B1 and OCT1. We followed EMA guideline for in vitro transport studies that suggests the use of substrate and inhibitors. We chose three concentrations of inhibitors that showed significant inhibitory effects in transporter gene expressions reported previously.[26,27,28,29,30,31]
Our results showed that HepG2 cells are more sensitive to drug inhibitions than Huh-7 cells. This might be due to the lower level of transporters expressed in HepG2 cells. Huh-7 showed significantly higher level of transporter's expressions that the cells also need significantly higher concentrations of inhibitors to suppress the level of expressions. The most plausible explanation for the difference might be due to the variability of transcription factors expressed in the two cells.[32] This different characteristic has to be taken to the account when one of the two cells must be chosen for drug transport studies. Our results are based on mRNA expression data, which may not always correlated with the expression of encoded proteins. However, for P-glycoprotein, in the literature we can find a good correlation between mRNA level, protein expressions and protein functionality.[33,34]
CONCLUSION
The present study showed a differential response of cells to the inhibitory effects of inhibitors used in our study (verapamil, nelfinavir and quinidine). We propose that both cells can be used as in vitro system for the study of transporters, but HepG2 cells are more sensitive to drug inhibitions than in Huh-7 cells.
Footnotes
Source of Support: Nil
Conflict of Interest: None declared.
REFERENCES
- 1.Mizuno N, Niwa T, Yotsumoto Y, Sugiyama Y. Impact of drug transporter studies on drug discovery and development. Pharmacol Rev. 2003;55:425–61. doi: 10.1124/pr.55.3.1. [DOI] [PubMed] [Google Scholar]
- 2.Kitamura S, Maeda K, Sugiyama Y. Recent progresses in the experimental methods and evaluation strategies of transporter functions for the prediction of the pharmacokinetics in humans. Naunyn Schmiedebergs Arch Pharmacol. 2008;377:617–28. doi: 10.1007/s00210-008-0312-9. [DOI] [PubMed] [Google Scholar]
- 3.Shitara Y, Horie T, Sugiyama Y. Transporters as a determinant of drug clearance and tissue distribution. Eur J Pharm Sci. 2006;27:425–46. doi: 10.1016/j.ejps.2005.12.003. [DOI] [PubMed] [Google Scholar]
- 4.Giacomini KM, Sugiyama Y. Membrane transporters and drug response. Goodman and Gilman's The Pharmacological Basis of Therapeutics. 12th ed. New York: McGraw-Hill; 2011. pp. 89–121. [Google Scholar]
- 5.Jessen BA, Mullins JS, De Peyster A, Stevens GJ. Assessment of hepatocytes and liver slices as in vitro test systems to predict in vivo gene expression. Toxicol Sci. 2003;75:208–22. doi: 10.1093/toxsci/kfg172. [DOI] [PubMed] [Google Scholar]
- 6.Gerets HH, Tilmant K, Gerin B, Chanteux H, Depelchin BO, Dhalluin S, et al. Characterization of primary human hepatocytes, HepG2 cells, and HepaRG cells at the mRNA level and CYP activity in response to inducers and their predictivity for the detection of human hepatotoxins. Cell Biol Toxicol. 2012;28:69–87. doi: 10.1007/s10565-011-9208-4. [DOI] [PMC free article] [PubMed] [Google Scholar]
- 7.Wilkening S, Stahl F, Bader A. Comparison of primary human hepatocytes and hepatoma cell line Hepg2 with regard to their biotransformation properties. Drug Metab Dispos. 2003;31:1035–42. doi: 10.1124/dmd.31.8.1035. [DOI] [PubMed] [Google Scholar]
- 8.Brandon EF, Bosch TM, Deenen MJ, Levink R, van der Wal E, van Meerveld JB, et al. Validation of in vitro cell models used in drug metabolism and transport studies; genotyping of cytochrome P450, phase II enzymes and drug transporter polymorphisms in the human hepatoma (HepG2), ovarian carcinoma (IGROV-1) and colon carcinoma (CaCo-2, LS180) cell lines. Toxicol Appl Pharmacol. 2006;211:1–10. doi: 10.1016/j.taap.2005.05.004. [DOI] [PubMed] [Google Scholar]
- 9.Zhang L, Strong JM, Qiu W, Lesko LJ, Huang SM. Scientific perspectives on drug transporters and their role in drug interactions. Mol Pharm. 2006;3:62–9. doi: 10.1021/mp050095h. [DOI] [PubMed] [Google Scholar]
- 10.Sivertsson L, Ek M, Darnell M, Edebert I, Ingelman-Sundberg M, Neve EP. CYP3A4 catalytic activity is induced in confluent Huh7 hepatoma cells. Drug Metab Dispos. 2010;38:995–1002. doi: 10.1124/dmd.110.032367. [DOI] [PubMed] [Google Scholar]
- 11.He S, Liu F, Xie Z, Zu X, Xu W, Jiang Y. P-Glycoprotein/MDR1 Regulates pokemon gene transcription through p53 expression in human breast cancer cells. Int J Mol Sci. 2010;11:3309–051. doi: 10.3390/ijms11093039. [DOI] [PMC free article] [PubMed] [Google Scholar]
- 12.Briz O, Serrano MA, MacIas RI, Gonzalez-Gallego J, Marin JJ. Role of organic anion-transporting polypeptides, OATP-A, OATP-C and OATP-8, in the human placenta-maternal liver tandem excretory pathway for foetal bilirubin. Biochem J. 2003;371:897–905. doi: 10.1042/BJ20030034. [DOI] [PMC free article] [PubMed] [Google Scholar]
- 13.Libra A, Fernetti C, Lorusso V, Visigalli M, Anelli PL, Staud F, et al. Molecular determinants in the transport of a bile acid-derived diagnostic agent in tumoral and nontumoral cell lines of human liver. J Pharmacol Exp Ther. 2006;319:809–17. doi: 10.1124/jpet.106.106591. [DOI] [PubMed] [Google Scholar]
- 14.Ahmad F, Lindh R, Tang Y, Weston M, Degerman E, Manganiello VC. Insulin-induced formation of macromolecular complexes involved in activation of cyclic nucleotide phosphodiesterase 3B (PDE3B) and its interaction with PKB. Biochem J. 2007;404:257–68. doi: 10.1042/BJ20060960. [DOI] [PMC free article] [PubMed] [Google Scholar]
- 15.Hilgendorf C, Ahlin G, Seithel A, Artursson P, Ungell AL, Karlsson J. Expression of thirty-six drug transporter genes in human intestine, liver, kidney, and organotypic cell lines. Drug Metab Dispos. 2007;35:1333–40. doi: 10.1124/dmd.107.014902. [DOI] [PubMed] [Google Scholar]
- 16.Ahlin G, Hilgendorf C, Karlsson J, Szigyarto CA, Uhlén M, Artursson P. Endogenous gene and protein expression of drug-transporting proteins in cell lines routinely used in drug discovery programs. Drug Metab Dispos. 2009;37:2275–83. doi: 10.1124/dmd.109.028654. [DOI] [PubMed] [Google Scholar]
- 17.Livak KJ, Schmittgen TD. Analysis of relative gene expression data using real-time quantitative PCR and the 2(-Delta Delta C (T)) Method. Methods. 2001;25:402–8. doi: 10.1006/meth.2001.1262. [DOI] [PubMed] [Google Scholar]
- 18.Donato MT, Lahoz A, Castell JV, Gómez-Lechón MJ. Cell lines: A tool for in vitro drug metabolism studies. Curr Drug Metab. 2008;9:1–11. doi: 10.2174/138920008783331086. [DOI] [PubMed] [Google Scholar]
- 19.Guo L, Dial S, Shi L, Branham W, Liu J, Fang JL, et al. Similarities and differences in the expression of drug-metabolizing enzymes between human hepatic cell lines and primary human hepatocytes. Drug Metab Dispos. 2011;39:528–38. doi: 10.1124/dmd.110.035873. [DOI] [PMC free article] [PubMed] [Google Scholar]
- 20.Faber KN, Müller M, Jansen PL. Drug transport proteins in the liver. Adv Drug Deliv Rev. 2003;55:107–24. doi: 10.1016/s0169-409x(02)00173-4. [DOI] [PubMed] [Google Scholar]
- 21.Nishimura M, Naito S. Tissue-specific mRNA expression profiles of human solute carrier transporter superfamilies. Drug Metab Pharmacokinet. 2008;23:22–44. doi: 10.2133/dmpk.23.22. [DOI] [PubMed] [Google Scholar]
- 22.Chandra P, Brouwer KL. The complexities of hepatic drug transport: Current knowledge and emerging concepts. Pharm Res. 2004;21:719–35. doi: 10.1023/b:pham.0000026420.79421.8f. [DOI] [PubMed] [Google Scholar]
- 23.Kalliokoski A, Niemi M. Impact of OATP transporters on pharmacokinetics. Br J Pharmacol. 2009;158:693–705. doi: 10.1111/j.1476-5381.2009.00430.x. [DOI] [PMC free article] [PubMed] [Google Scholar]
- 24.Ho RH, Kim RB. Transporters and drug therapy: Implications for drug disposition and disease. Clin Pharmacol Ther. 2005;78:260–77. doi: 10.1016/j.clpt.2005.05.011. [DOI] [PubMed] [Google Scholar]
- 25.Nishimura M, Naito S. Tissue-specific mRNA expression profiles of human ATP-binding cassette and solute carrier transporter superfamilies. Drug Metab Pharmacokinet. 2005;20:452–77. doi: 10.2133/dmpk.20.452. [DOI] [PubMed] [Google Scholar]
- 26.Zhang L, Schaner ME, Giacomini KM. Functional characterization of an organic cation transporter (hOCT1) in a transiently transfected human cell line (HeLa) J Pharmacol Exp Ther. 1998;286:354–61. [PubMed] [Google Scholar]
- 27.Luo FR, Paranjpe PV, Guo A, Rubin E, Sinko P. Intestinal transport of irinotecan in Caco-2 cells and MDCK II cells overexpressing efflux transporters Pgp, cMOAT, and MRP1. Drug Metab Dispos. 2002;30:763–70. doi: 10.1124/dmd.30.7.763. [DOI] [PubMed] [Google Scholar]
- 28.Tirona RG, Leake BF, Wolkoff AW, Kim RB. Human organic anion transporting polypeptide-C (SLC21A6) is a major determinant of rifampin-mediated pregnane X receptor activation. J Pharmacol Exp Ther. 2003;304:223–8. doi: 10.1124/jpet.102.043026. [DOI] [PubMed] [Google Scholar]
- 29.Komoto C, Nakamura T, Yamamori M, Ohmoto N, Kobayashi H, Kuwahara A, et al. Reversal effects of Ca2+antagonists on multidrug resistance via down-regulation of MDR1 mRNA. Kobe J Med Sci. 2008;53:355–63. [PubMed] [Google Scholar]
- 30.Minematsu T, Iwai M, Umehara K-I, Usui T, Kamimura H. Characterization of human organic cation transporter 1 (OCT1/SLC22A1)- and OCT2 (SLC22A2) -mediated transport of 1-(2-methoxyethyl)-2-methyl-4,9-dioxo-3-(pyrazin-2-ylmethyl)- 4,9 -dihydro-1H-naphtho[2,3-d] imidazolium bromide (YM155 monobromide), a novel small molecule survivin suppressant. Drug Metab Dispos. 2010;38:1–4. doi: 10.1124/dmd.109.028142. [DOI] [PubMed] [Google Scholar]
- 31.Dönmez Y, Akhmetova L, İşeri ÖD, Kars MD, Gündüz U. Effect of MDR modulators verapamil and promethazine on gene expression levels of MDR1 and MRP1 in doxorubicin-resistant MCF-7 cells. Cancer Chemother Pharmacol. 2011;67:823–8. doi: 10.1007/s00280-010-1385-y. [DOI] [PubMed] [Google Scholar]
- 32.Jung D, Hagenbuch B, Gresh L, Pontoglio M, Meier PJ, Kullak-Ublick GA. Characterization of the human OATP-C (SLC21A6) gene promoter and regulation of liver-specific OATP genes by hepatocyte nuclear factor 1 alpha. J Biol Chem. 2001;276:37206–14. doi: 10.1074/jbc.M103988200. [DOI] [PubMed] [Google Scholar]
- 33.Taipalensuu J, Törnblom H, Lindberg G, Einarsson C, Sjöqvist F, Melhus H, et al. Correlation of gene expression of ten drug efflux proteins of the ATP-binding cassette transporter family in normal human jejunum and in human intestinal epithelial Caco-2 cell monolayers. J Pharmacol Exp Ther. 2001;299:164–70. [PubMed] [Google Scholar]
- 34.Taipalensuu J, Tavelin S, Lazorova L, Svensson AC, Artursson P. Exploring the quantitative relationship between the level of MDR1 transcript, protein and function using digoxin as a marker of MDR1-dependent drug efflux activity. Eur J Pharm Sci. 2004;21:69–75. doi: 10.1016/s0928-0987(03)00204-5. [DOI] [PubMed] [Google Scholar]


