

Abstract
PV1 is an endothelial-specific integral membrane glycoprotein associated with the stomatal diaphragms of caveolae, transendothelial channels, and vesiculo-vacuolar organelles and the diaphragms of endothelial fenestrae. Multiple PV1 homodimers are found within each stomatal and fenestral diaphragm. We investigated the function of PV1 within these diaphragms and their regulation and found that treatment of endothelial cells in culture with phorbol myristate acetate (PMA) led to upregulation of PV1. This correlated with de novo formation of stomatal diaphragms of caveolae and transendothelial channels as well as fenestrae upon PMA treatment. The newly formed diaphragms could be labeled with anti-PV1 antibodies. The upregulation of PV1 and formation of stomatal and fenestral diaphragms by PMA was endothelium specific and was the highest in microvascular endothelial cells compared with their large vessel counterparts. By using a siRNA approach, PV1 mRNA silencing prevented the de novo formation of the diaphragms of caveolae as well as fenestrae and transendothelial channels. Overexpression of PV1 in endothelial cells as well as in cell types that do not harbor caveolar diaphragms in situ induced de novo formation of caveolar stomatal diaphragms. Lastly, PV1 upregulation by PMA required the activation of Erk1/2 MAP kinase pathway and was protein kinase C independent. Taken together, these data show that PV1 is a key structural component, necessary for the biogenesis of the stomatal and fenestral diaphragms.
INTRODUCTION
Vascular endothelium is a highly differentiated cellular monolayer that lines the entire cardiovascular system. Judged by its magnitude and importance for the underlying tissues, a critical function of the endothelium is to mediate the fluid and solute exchanges between the blood plasma and the interstitial fluid, in short microvascular permeability. Although the molecular mechanisms underlying this function are still largely unknown, several endothelial specialized subcellular structures have been involved in these processes: caveolae, transendothelial channels (TEC), fenestrae, sinusoidal gaps, vesiculo-vacuolar organelles (VVOs), and intercellular junctions (for reviews see Palade, 1991; Michel and Curry, 1999; Dvorak and Feng, 2001; Bendayan, 2002; Stan, 2002).
One of the puzzling features of these endothelial structures is that, in select microvascular beds, caveolae, TEC and VVOs can be provided with a stomatal diaphragm (SD; reviewed in Stan, 2002), whereas fenestrae are subtended by a fenestral diaphragm (FD) in all cases (i.e., in kidney peritubullar capillaries, all endocrine and exocrine glands, intestinal villi) except in capillaries of kidney glomerulus (reviewed in Roberts and Palade, 2000).
Based on electron microscopy (EM) studies, the SDs of caveolae, TEC and VVOs and the FDs have the same morphology: thin (5–7 nm) protein barrier provided with a central density or “knob” (Palade and Bruns, 1968; Clementi and Palade, 1969a, 1969b). The FD has an octagonal symmetry (Maul, 1971; Bearer and Orci, 1985), being constituted of radial fibrils starting at the rim and interweaving in a central mesh (Bearer and Orci, 1985). The intimate structure of the SD could not be clearly elucidated, due in part to technical limitations caused by the slight diameter differences between the SDs (<40 nm) diaphragms and their fenestral (∼65 nm) counterparts. However, close examination of the SDs of both caveolae and TEC reveals hints of the same pattern, radial fibrils and a central mesh (Bearer and Orci, 1985).
The molecular composition of the SDs and FDs has been investigated with “general” probes such as lectins (Simionescu et al., 1982a; Pino, 1986) and cationized ferritin (Simionescu et al., 1981a, 1981b, 1981b, 1982b; Bankston and Milici, 1983), which demonstrated that SDs and FDs behave differently: the former bind lectins avidly and lack anionic sites, whereas the latter do not (Simionescu et al., 1982a) or poorly (Pino, 1986) bind lectins and have multiple anionic sites conferred by heparan sulfate proteoglycans (HSPGs; Simionescu et al., 1981a). The HSPGs are present only on the luminal side of fenestrae (Simionescu et al., 1982b; Rostgaard and Qvortrup, 1997).
Recently, we have shown that the SDs of caveolae and TEC and the FDs of fenestrae share at least one protein, namely PV1 (Stan et al., 1999a, 1999b). PV1 is a single-span, 60-kDa, type II membrane N-glycosylated glycoprotein with a short intracellular tail and a long extracellular domain (Stan et al., 1999b). There is no conserved known consensus site in the intracellular domain across mammalian species. The extracellular domain contains four N-glycosylation sites near the membrane, a proline-rich region near the C–terminus, and two large coiled-coil domains, suggesting a rod-like protein (Stan et al., 2001). From the studies done so far, PV1 seems to be endothelium specific and moreover to be specifically associated with the SDs of caveolae and TEC and the FDs, at both fronts of ECs (Stan et al., 1999a, 1999b). PV1 forms homodimers in situ as well as in culture (Stan, 2003). Moreover, several PV1 homodimers have been shown to reside in close proximity in the same diaphragm in either the SDs in the lung or FDs in kidney (Stan, 2003).
The function of PV1 within the diaphragms is unknown as is their precise function(s), biogenesis and regulation.
Endothelial fenestrae and TEC are inducible structures, as shown in a considerable body of literature. The surface density of these structures and their diaphragms can be modulated by several pathological conditions in situ and different factors in culture (reviewed in Roberts and Palade, 2000). Culturing ECs that have fenestrae and TECs in situ causes a drastic reduction in the surface density of these structures (Milici et al., 1985a; Lombardi et al., 1986). This can be reversed by either culturing these cells on extracellular matrix from epithelial cells (Milici et al., 1985a) or in presence of phorbol myristate acetate (PMA), retinoic acid (Lombardi et al., 1986, 1987, 1988) or vascular endothelial growth factor (VEGF; Esser et al., 1998). PMA is able to induce fenestrae and TEC even in ECs that do not have them in situ (e.g., ECs from umbilical vein or pulmonary artery), an effect that is blocked by TGFβ. The fenestrae and TEC newly formed in culture are morphologically similar to those from in situ, as shown by EM (Milici et al., 1985a; Lombardi et al., 1987). There is no data in the literature documenting the conditions of induction of the SDs of caveolae.
Here, we have addressed the role of PV1 within the diaphragms and probed into their regulation and biogenesis. We present data showing that i) PV1 has a key structural function within both the SDs and FDs being both necessary and sufficient for their formation and ii) PV1 upregulation and diaphragm formation is PKC independent and is dependent on the activation of Erk1/2 MAP kinase.
MATERIALS AND METHODS
Materials
ECL reagents were from Pierce-Endogen (Rockford, IL). Protein kinase C (PKC) inhibitors (staurosporine, calphostin C, Go9068, and bis-indolilmaleimide I) and MEK1 Inhibitors (PD98059, U0126 and its negative control U0124) were from Calbiochem (San Diego, CA). All the other general reagents were as reported in our previous articles.
Cells and Cell Culture
Table 1 summarizes the cell types used in this study and the culture conditions.
Table 1.
Cell types used
| Cell type | Abbreviation | Species | Passage | Cultured on | Medium | Sourcea |
|---|---|---|---|---|---|---|
| Endothelial cells | ||||||
| Lung microvascular ECs | HLMVEC | Human | 6–10 | Plastic or gelatin | EGM2-MV | Clonetics or VEC Tec |
| Dermal microvascular ECs, adult | HDMVEC-Ad | Human | 6–10 | Plastic or gelatin | EGM2-MV | Clonetics or VEC Tec |
| Dermal microvascular ECs, neonate | HDMVEC-neo | Human | 6–10 | Plastic or gelatin | EGM2-MV | Clonetics |
| Umbilical vein ECs | HUVEC | Human | 3–10 | Plastic or gelatin | EGM2 | Clonetics |
| Nonendothelial cells | ||||||
| Dermal fibroblasts | HDF | Human | 5–12 | Plastic | MCDB131 + EndoGro | VecTec |
| Embryonic kidney fibroblasts | HEK293 | Human | Plastic | DMEM, 10% FBS, antibiotics | ATTC | |
| Cervical epithelium cancer | HeLa | Human | Plastic | DMEM, 10% FBS, antibiotics | ATTC | |
| Epithelial | COS7 | Primate | Plastic | DMEM, 10% FBS, antibiotics | ATTC |
Clonetics (San Diego, CA), VecTechnologies (Rensselaer, NY), ATCC (Manassas, VA)
Antibodies
Anti-human PV1C pAb (α-hPV1C) was raised in chickens against a synthetic peptide (KGPPAGIPVAPSSG single-letter code, hPV1C peptide) coupled to BSA. The hPV1C peptide consisted of the last 12 aa from hPV1 C terminus, to which a glycine and a lysine (in bold) were added for increased solubility and coupling purposes, respectively. IgY purification was done as before (Stan et al., 1999a). The anti-huPV1C pAb was affinity-purified on the huPV1C peptide coupled to Affi-Gel10 followed by extensive cross-absorption on a BSA-agarose column (Stan et al., 1999a). Mouse anti-FLAG mAb (clone M2), anti-FLAG-agarose, and anti-β-actin mAb (clone AC15) were from Sigma (St. Louis, MO). Mouse anti-HA.11 mAb, (clone 16B12) and anti-HA-agarose was from Covance (Denver, PA). Rat anti-HA mAb (3F10) was from Roche (Indianapolis, IN). Rabbit anticaveolin 1 pAb was purchased from BD Pharmigen-Transduction (San Diego, CA). Rabbit anti-Erk1/2, -phospho-Erk1/2, -phospho-MEK1, -phospho-Raf 1, phospho-Elk1, and -phosphoserine PKC pseudosubstrate (PS-PKC-PS) were from Cell Signaling (Beverly, MA).
PMA Treatments
Fenestrae, TEC, and caveolar SDs were induced de novo by using a published method (Lombardi et al., 1986) with slight modifications. Briefly, ECs were seeded at 50% confluence in six-well plates (or as noted) and either treated after cells have attached (i.e., 4 h postseeding) or grown to confluence on gelatin-coated plastic dishes and then treated with 50 nM phorbol myristate acetate (PMA) or as noted. In most experiments, the ECs were serum-starved for 6–24 h in EBM2 supplemented with 0.5% FBS and 1% BSA (serum-starving medium [SSM]). The PMA treatment was carried out in either SSM or EBM2 supplemented with either 2% (HUVEC) or 5% (HDMVEC, HLMVEC) serum. The PMA treatment of non-EC types (HDF, HEK, HeLa, COS7) was done in their corresponding either full growth or serum-starving media. To assess for the levels of PV1, the cells were rinsed twice in cold PBS and solubilized in equal volumes of reducing SDS-PAGE sample buffer, and the samples were boiled and used for immunoblotting with anti-hPV1C pAb and anti–β-actin to show the loading.
Immunoblotting and Densitometry
Proteins were resolved by SDS-PAGE in reducing conditions and blotted to either nitrocellulose or PVDF membranes, which were blocked and probed with appropriate primary antibodies followed by HRP-conjugated reporter antibodies. The signal was detected by enhanced chemiluminescence by exposure to autoradiography film. Quantitation of the signal was obtained by densitometry using an AlphaImager device (Alpha Innotech, San Leandro, CA).
Activation of the MAPK by PMA
HUVEC and HDMVEC were used for these studies. Cells were grown to confluence in 35-mm dishes, serum-starved in SSM for 24 h followed by treatment with 50 nM PMA in EBM2 containing 2% (HUVEC) or 5% (HDMVEC) FBS for 0, 5, 10, 15, 60 min and 16–20 h. After each time point the cells were solubilized in reducing SDS-PAGE sample buffer containing 1 mM NaOV4, boiled, and used for immunoblotting. The phosphorylation status of the enzymes in the MAP kinase pathway was determined with the respective phospho-specific antibodies.
Pharmacological Inhibition of PKC and MEK-1
HUVEC and HDMVEC were used for these studies. All the inhibitor stocks were freshly made as 1000× stocks in DMSO before the experiment. The inhibitor solutions were kept in the dark on ice, and the treatments were carried out in the dark (except for Calphostin C that was light activate for 15 min before addition to cells). Briefly, cells were grown to confluence, serum-starved for 4–24 h, and treated with the inhibitors for 15–30 min before adding PMA directly into the wells, to a final concentration of 50 nM using a 1000× stock solution freshly made in EBM2. Controls consisted of cells treated with only the vehicle for the same lengths of time as the experimental samples or, where applicable, a negative control for the inhibitors (e.g., U0124). The PV1 and β-actin were checked by immunoblotting after 20–24 h. The level of PKC activity was determined after 30 min by immunoblotting with antiphospho-serine PKC pseudosubstrate (PS-PKC-PS) antibody. The concentration range tested for each inhibitor was bisindolylmaleimide (10–500 nM), Go6983 (10–500 nM), calphostin C (10–100 nM), staurosporine (0.05–50 nM), U0126 (0.1–10 μM), and PD98059 (0.25–250 μM).
Constructs
Full-length human PV1 (hPV1) was PCR amplified using pfu DNA polymerase (Stratagene, San Diego, CA) and forward 5′TGAATTCAAATGGGTCTGGCCATGGAGCAC3′ and reverse 5′AAAAGTCGACAGCCACTGGATGGGGCTACAG3′ primers. The resulting DNA fragment was inserted using the EcoRI and SalI restriction sites (in bold) in the pIRES-hrGFP-1a or pIRES-hrGFP-2a (Stratagene) bicistronic vectors, upstream and in frame with sequences encoding for either a 3xFLAG or 3xHA epitopes, respectively. These vectors also contained the hrGFP gene (humanized Renilla GFP). For colocalization with endogenous caveolin 1, the constructs used contained either PV1–3xHA or PV1–3xFlag into the pCDNA3.1(-) vector that lacked hrGFP expression. Caveolin1-mRFP was as published (Wadia et al., 2004).
PV1 Gene Product Silencing Using siRNA
All the experiments were carried out in HUVECs at passage 3–8. Cells were grown six-well plates on either gelatin or plastic to near confluence and chemically synthesized siRNA duplexes (either 75 or 200 picomoles per well) were transfected using Targefect-siRNA reagent (Targeting Systems, San Diego, CA) as per manufacturer's instructions. After 24 h, the cells were treated with PMA for 24–72 h when they were either solubilized and processed for immunoblotting or fixed and processed for EM (Note: the EM studies were mostly done on cells after 72 h treatment with PMA). The sequences used for PV1 silencing were as follows: 1) duplex1 hPV1–249: CUUGACCAAGGAGCUCAACTT (sense) and GUUGAGCUCCUUGGUCAAGTT (antisense); 2) duplex 2 hPV1–258: GGAGCUCAACUUCACCACCTT (sense) and GGUGGUGAAGUUGAGCUCCTT (antisense); and 3) hPV1-scrambled control: CAGCACAUGCAUGUACACGTT (sense) and CGUGUACAUGCAUGUGCUGTT (antisense).
Transfections
The transfection reagents used, such as Effectene (HUVEC; Qiagen, Valencia, CA), Targefect F1 (HUVEC, HEK293) and Targefect F2 (COS7, HeLa; Targeting Systems), were used according to the manufacturer's instructions. For high transfection efficiency into cell types hard to transfect (HUVEC, HLMVEC, and HDF), the DNA was delivered by electroporation using the Nucleofector device and the cell-specific kits, according to the manufacturer's instructions (Amaxa, Koeln, Germany). The electroporated cells were used for either immunofluorescence (HDF) or immunogold labeling (HDF, HUVEC, HLMVEC) with antitag antibodies as described below.
Surface Biotinylation
All the procedure was carried out at 4°C as described in Tkachenko and Simons (2002). Cells (2× 3.5-cm dishes per condition/per experiment) were rinsed twice (2 min, 4°C) in ice-cold PBS lacking both Ca and Mg and incubated (15–20 min, 4°C) with 0.5 μg/ml water-soluble NHSPEO4-biotin (Pierce-Endogen) in PBS after which the biotin solution was aspirated. The reaction was quenched by incubation (5–10 min, 4°C) with 1% BSA in PBS.
Determination of the Ratio of Surface vs. Intracellular PV1 Pools
To determine the pool of PV1 present at the cell surface in either PMA treated ECs or in cells transfected with tagged versions of human PV1, the surface biotinylated cells were lysed in RIPA buffer (1% TX-100, 0.4% sodium deoxycholate, and 0.1% SDS, 1 mM EDTA) with protease inhibitors cocktail (Sigma cat. no. P2714) for 1 h at 4°C with gentle rocking, and the extract was cleared by centrifugation (1 h, 4°C, 128,000 × g, TLA45 rotor). The supernatant containing total cellular PV1 was incubated (1 h, 4°C, end-over end) with 15 μl neutravidin-agarose (Pierce-Endogen). The beads were collected by centrifugation (5 min, 600 × g) and washed (3 × 5 min, RT) in ice-cold RIPA buffer, and the bound proteins (representing the biotinylated surface proteins) were solubilized (2 min, 100°C) in nonreducing sample buffer for SDS-PAGE. The supernatant was moved to another tube where it was further incubated (O/N, 4°C) with anti-hPV1C pAb covalently coupled to Affi-Gel10 beads (Bio-Rad, Richmond, CA). The coupling of anti-hPV1CpAb was done as before (Stan et al., 1999a). The beads were collected by centrifugation (5 min, 600 × g) and washed (3 × 5 min, RT) in ice-cold RIPA buffer, and the bound PV1 (representing intracellular PV1) was solubilized (2 min, 100°C) in 100 μl nonreducing sample buffer for SDS-PAGE.
To determine the amount of PV1 bound to neutravidin and to PV1 in each sample, equivalent volumes of the bound proteins were resolved by SDS-PAGE, transferred to PVDF membranes, and blotted with either anti-PV1 or anti-HA antibodies (for PMA-treated cells or cells transfected with PV1–3xHA, respectively).
Equivalent volumes of the cell extract (starting material) and the neutravidin and anti-PV1 supernatants were also processed for SDS-PAGE and immunoblotting to show depletion of PV1 after each step.
Fluorescence-activated Cell Sorting
HUVECs were transfected with bicistronic vectors encoding for hrGFPas well as either hPV1–3xHA or hPV1–3xFLAG. The proteins were allowed to express for 48 h, when the cells were dissociated using an enzyme-free buffer (Cell Dissociation Buffer; Invitrogen), centrifuged (5 min, 4°C, 300 × g) and resuspended in cold PBS supplemented 0.5% BSA. The cells were sorted in a Becton Dickinson FACS Vantage SE cell sorter using the CellQuest software (Becton Dickinson, Mountain View, CA). Transfected (fluorescent) cells were collected in warm (37°C) EGM2 medium and immediately plated at high density (80–100%) on gelatin-coated plastic dishes. After 4–6 h, the unattached, dead cells were washed out with serum-free medium and the viable transfected cells were cultured for 20 more hours when they were fixed and processed for immunogold labeling as described below.
Immunofluorescence
Either PMA-treated (with or without prior PV1-siRNA treatment) or tagged hPV1-transfected cells were fixed (30 min, RT) in 2% paraformaldehyde in 0.1 M phosphate buffer (PB), pH 7.4, quenched by washes (3 × 10 min, RT) in PB containing 0.07 M glycine, and incubation (1–2 h, RT) in 10% fetal calf serum (FCS) in PB, followed by overnight incubation with the primary antibody (anti-huPV1C pAb, anti-HA mAb, or anti-FLAG mAb) diluted in 1% BSA in PBS (PBSA). Cells were washed (3 × 30 min, RT) in PBSA followed by incubation (2 h, RT) with F(ab)2 fragments of either anti-chicken IgY-Texas Red or anti-mouse IgG-Alexa 594 secondary antibodies. The cells were washed again, mounted under coverslips using PermaFluor mounting medium (ThermoShandon, Pittsburgh, PA) and examined under a microscope equipped with appropriate filters. The images were acquired with a Hamamatsu Orca ER CCD camera (Hamamatsu, Tustin, CA) and the Open-Lab software (Improvison, Lexington, MA), and images were processed as TIFF files using Adobe Photoshop 5.5. software (Adobe Systems, San Jose, CA). For colocalization studies that entailed permeabilization, cells (HUVEC, HDF, HEK293, COS7 and HeLa) were briefly permeabilized (10 min, RT) using 0.1% Triton X-100 in PB after fixation, followed by blocking and labeling with antibodies as above.
Transient expression of caveolin 1-mRFP and PV-1–3xHA_IRES_hrGFP construct was performed using Superfect (Qiagen), and the cells were analyzed by fluorescent microscopy 48–72 h posttransfection. To label PV-1-HA, 100 μl of PBS with Ca and Mg, 1% BSA and 100 ng of high affinity anti-HA mAb (Roche) were dropped on paraffin film, and the coverslip was placed cells-down on the top of the drop. Incubation was performed for 30 min at 4°C. Cells were washed then twice with ice-cold PBS and incubated with Alexa-647–labeled secondary antibody (Molecular Probes, Eugene, OR) at concentration 5 μg/ml for 15 min using the procedure described above. After washing in PBS, the coverslips were mounted on microscope slides and imaged within 5 min. All microscopy was done using an Olympus IX-71 microscope equipped with a Sensicam QE cooled CCD camera (Cooks, Auburn Hills, MI), DG-4 xenon arc light source (Sutter, Novato, CA) and 100× 1.4 NA lens. QED software (Media Cybernetics, Carlsbad, CA) was used for image acquisitions. Image processing and analysis was done using Adobe Photoshop 7.0 and AutoDeblur 9.2 (Auto Quant Imaging, Rochester, NY).
In all fluorescence experiments the minimum number of cells examined was 20.
Immunogold labeling was performed by a pre-embedding method as in our past work (Stan et al., 1999a, 1999b). Cells were either PMA treated or transfected with huPV-FLAG, followed by fixation (30 min, RT) in 2% paraformaldehyde in 0.1 M PB, pH 7.4. Next, the cells were quenched by washes (three times for 10 min, RT) in PBS containing 0.07 M glycine and incubation (1–2 h, RT) in 10% fetal calf serum (FCS) in PBS followed by overnight incubation with the primary antibody (either anti-huPV1C pAb or anti-FLAG M2 mAb) diluted in PBSA. Cells were washed (three times for 30 min, RT) in PBSA followed by incubation (2 h, RT) with gold-conjugated cognate secondary antibody, washed again (three times for 30 min, RT), and the antibody-antigen complexes were stabilized by fixation (30 min, RT) in 2% glutaraldehyde in 0.1 M sodium cacodylate buffer, pH 7.3. After osmication (1 h, on ice, in the dark) and incubation (30 min, RT, in the dark) in Kellenberger's uranyl acetate, the cells were dehydrated in graded ethanol. The monolayer was cut in small (1–2 mm2) squares, which were collected as a pellet and processed for LX-112 resin embedding. Sections (<50 nm thickness) were cut in a Reichert microtome, mounted on formvar-coated nickel or copper grids, poststained with uranyl acetate and lead citrate, and examined and photographed in a Philips CM 10 electron microscope (Mahwah, NJ). In some cases images were acquired using a Gatan CCD camera and processed using either DigitalMicrograph 3.0 (Gatan, Pleasanton, CA) or Adobe Photoshop software (Adobe Systems). The preembedding immunocytochemistry approach allows a larger sampling with better-preserved morphology that the classical labeling of ultrathin cryosections.
Morphometry
For quantitation of the surface density of SDs and FDs, the treatments were done in triplicate. Cells were fixed and processed for resin embedding and routine morphology with and without preembedding immunocytochemistry with anti-PV1 or antitag (HA or Flag) antibodies, as noted. From each experiment there were three blocks per condition. From each block there were five sections examined from which 10 random pictures were acquired at a magnification of 8900 using a Gatan CCD camera and DigitalMicrograph 3.0 software and saved as TIFF files. This resulted in 50 images per condition (e.g., control vs. PMA treated). The SDs of caveolae, TEC, and the fenestrae were counted on all the cells found in an image. The surface density was estimated from the measured length of endothelium and considering the thickness of a section of 50 nm.
RESULTS
PMA Upregulates PV1 mRNA and Protein Levels in ECs in Culture
A strong correlation between the presence of PV1 and the presence of SDs and FDs has been determined in situ where PV1 was basically found only where the diaphragms are found (Stan et al., 1999a, 1999b). Thus, PV1 antibodies stain only the introits of caveolae provided with SDs and not the caveolae lacking SDs. Similarly, fenestrae are stained by PV1 antibodies only if they are subtended by a FD and not in the glomerulus where fenestrae have no diaphragms.
To see if the same correlation is valid in cell culture, we checked whether conditions that induce the formation of the diaphragms de novo would upregulate PV1. For this, we used as a test an established cell culture model published by Lombardi et al. (1986). In this model, the treatment of ECs in culture with phorbol myristate acetate (PMA) induces the formation of fenestrae and TEC. PMA is a diacyl glycerol (DAG) analog and activator of several classes of molecules such as PKC PKD, Ras-GRP, chimaerin, and Munc (Kazanietz, 2002). What is remarkable about this system is that the fenestrae and TEC could be induced at varying surface densities in human and bovine ECs isolated from different vascular beds. Most importantly, these structures can be induced even in those ECs (e.g., HUVEC) that lack the diaphragms in situ or in cell culture, as previously shown (Lombardi et al., 1987). Whether PMA treatment leads to the formation of caveolar SDs in any of these cells was not evaluated.
First, we looked at the effects of PMA treatment on PV1 expression levels in ECs in culture as well as in non-EC types (HDF, HeLa, COS7, HEK293), for comparison. The human ECs used were either from the microvasculature of the lung (HLMVEC) or skin (HDMVEC-Ad, HDMVEC-neo) or a large vessel such as the umbilical vein (HUVEC). We chose these cell types as none of them contain any TEC or fenestrae and their associated diaphragms in situ (Clementi and Palade, 1969a; Simionescu et al., 1974; Milici et al., 1985b). Only the lung microvascular ECs contain SDs at the mouth of their caveolae in situ (Stan et al., 1999a, 1999b).
By RT-PCR, we found that PV1 mRNA levels were upregulated in time-dependent manner (Figure 1A) in the ECs treated with PMA. This suggests that the PMA treatment leads to transcriptional activation of the PLVAP gene. Extremely low levels of PV1 mRNA could be detected only in control microvascular ECs (i.e., HDMVEC, HLMVEC; Figure 1A) but none in control large vessel ECs (i.e., HUVEC; unpublished data). No PV1 mRNA was detected in either control or PMA-treated non-EC types (HDF, HeLa, COS7, HEK293) at any time (unpublished data).
Figure 1.

PMA upregulates PV1 mRNA and protein only in ECs and not in other cell types. (A) RT-PCR amplification using hPV1 specific primers from 2 μg mRNA purified from HDMVEC treated with PMA (D1–D5) or control EC (C). The levels of the expected 200-bp band show time-dependent upregulation of PV1 mRNA. “-” negative and “+” positive controls for RT-PCR reaction. RT-PCR using GAPDH primers (GAPDH) served as control for the relative amounts of mRNA used. (B) Time dependence of the PV1 upregulation by PMA in HUVECs. Immunoblotting using the anti-hPV1C antibody (PV1, two top panels) on PMA-treated or control ECs. The two top panels represent different exposure times of the same PV1 blot. The earliest time point PV1 protein was detected at was between 6 and 12 h (bottom panel). Immunoblotting with anti–β-actin mAb on the same membrane shows loading (Actin). Caveolin-1 levels remained the same during PMA treatment (Cav1). (C) PV1 upregulation by PMA in HUVECs is dose dependent. Note the low doses of PMA required for PV1 upregulation. (D) PV1 upregulation does not occur in nonendothelial cell types exemplified by HDF. No PV1 was detected in these cells whereas β-actin (Actin, middle panel) and caveolin 1 (Cav1, bottom panel) are readily detectable on the same membrane.
PMA also upregulated PV1 protein, which became detectable at 12 h (Figure 1B, bottom panel) with ever-increasing levels (Figure 1B, top panel) up 5 days, the longest time point assessed. PV1 was undetectable in our assay in the control human ECs (Figure 1B) and non-EC types (Figure 1F). Surprisingly, ECs from lung (HLMVEC), which had been demonstrated to contain PV1 in situ (Stan et al., 1999a), showed undetectable PV1 protein levels when kept in culture for 4–5 passages (Figure 1B, control lane). This adds to the evidence showing dedifferentiation of ECs in culture. The discrepancy between the RT-PCR data and immunoblotting regarding the control could be explained by the much lower sensitivity of the latter assay.
PMA upregulated PV1 in a dose-dependent manner; the lowest effective PMA concentration was 0.5 nM (Figure 1C), and PV1 upregulation was maximal at ∼50 nM. Higher PMA doses (i.e., 500 nM) did not increase PV1 levels, suggesting that the process is saturatable (unpublished data).
Treatment of ECs with dose of 50–500 nM phorbol didecanoate (PDD), an inactive PMA analog used as a negative control to demonstrate specificity, failed to upregulate PV1 (see Figure 9A). This, in combination with the low PMA ED (low nanomolar range > 0.5 nM) and the dose and time dependence, shows that the upregulation of PV1 is PMA specific.
Figure 9.

PMA-induced PV1 upregulation is PMA specific and does not require the kinase activity of PKC in ECs. (A) Western blotting using the anti-hPV1C antibody (PV1, two top panels) and anti β-actin mAb (Actin, bottom panel) on proteins from either control ECs or ECs treated with 30 nM phorbol didecanoate, an inactive PMA analog, 30 nM PMA, 500 nM bisindolylmaleimide I, 500 nM Go6893, and 100 nM calphostin C. The lack of effect of PDD and the inhibition of DAG competitor calphostin C show that PMA specifically upregulates PV1. Both PKC kinase activity inhibitors bisindolylmaleimide I and Go6983 were without effect, showing that PV1 upregulation by PMA is PKC independent. (B) Staurosporine, another inhibitor of PKC kinase activity, has a synergistic effect with PMA, augmenting the PV1 levels in dose-dependent manner.
Treatment of non-EC cell types (HDF, HEK293, HeLa, COS7; Figure 1D) with PMA in doses up to 500 nM did not induce PV1 expression (Table 2). This lack of response was not due to inactivation of the reagent upon handling, because PMA treatment of these cells resulted in PKC activation, as shown by immunoblotting with antiphosphoserine PKC pseudosubstrate antibody (unpublished results). These results correlate with the lack of phenotype changes seen by light microscopy in these cells.
Table 2.
Effect of PMA on different cell types
| Cell type | Lamelipodia formation | PV1 upregulationa | Species |
|---|---|---|---|
| Endothelial | |||
| HUVEC | Yes | 1 | Human |
| HLMVEC | Yes | 14 | Human |
| HDMVEC, adult | Yes | 69 | Human |
| HDMVEC, neonate | Yes | 93 | Human |
| Nonendothelial | |||
| HDF | ND | ND | Human |
| HEK293 | ND | ND | Human |
| HeLa | ND | ND | Human |
| COS7 | ND | ND | Primate |
Relative arbitrary units. The level of PV1 upregulation obtained in HUVEC and measured by densitometry was considered as the unit. Because the densitometry of the ECL signal is semiquantitative, the mean relative values shown were rounded up to show the range. ND, nondetectable
The Level of PV1 Upregulation by PMA Is Higher in Microvascular than in Large Vessel ECs
Although PV1 was upregulated in all EC types, there were remarkable differences with respect to the intensity of response. Although the upregulation of PV1 was lowest in HUVEC, the levels it reached in the microvascular ECs (HDMVEC > HLMVEC) were 10–100-fold higher and this was the true when the cells were plated at either low or high density (Figure 2A and Table 2).
Figure 2.

The phenotype changes induced by PMA depend on the type of EC. (A) The levels of PV1 are highest in HDMVEC >> HLMVEC >> HUVEC at 24 h post-PMA treatment. The difference was as high as two orders of magnitude as detected by densitometry of the signal obtained by immunoblotting in cell treated at both low (60%) and high (100%) density. (B–G) PMA induces characteristic morphological changes in human ECs. The change in phenotype differs according to the EC type (e.g., macro vs. microvascular) and their density/proliferative state. HDMVEC (B–D) and HUVEC (E–G) either confluent (C and F) or at 60% confluence (D and G) were serum-starved followed by treatment with 30 nM PMA in SSM (see MATERIALS AND METHODS) for 24 h before phase contrast images were taken. Control cells (B and E). (B–G) Bar, 3 μm.
This difference in PV1 upregulation was paralleled by differences in cell shape change induced by PMA. A morphological change from cobblestone to spindle-like shape was observed within hours (between 8 and 24 h) in all human ECs treated at high density/confluent monolayer (Figure 2, C and F), confirming the previous findings (Lombardi et al., 1987). This change in shape was accompanied by marked attenuation of the periphery of the ECs due to lamelipodia formation, as previously determined by EM. Interestingly, although the shape of the PMA-treated HLMVEC (unpublished data) or HUVEC (Figure 2E) plated at 60% density was still spindle-like, the HDMVEC adopted a flattened, “pancake-like” shape (Figure 2D). No apparent shape change was detected in the control ECs where no PMA was added (Figure 2, B and E).
These data show that the PV1 upregulation occurs in all human ECs studied and bolster the marked phenotype differences between endothelial cells according to vascular bed. However, reasons for these differences are not clear and are currently under investigation.
Most of the PV1 Induced by PMA Is Found on the Cell Surface
To determine how much of the PMA induced PV1 is found at the cell surface and how much inside the cell, we performed surface biotinylation of plasma membrane proteins of ECs (HUVEC and HDMVEC) as described in MATERIALS AND METHODS. Biotin is a small molecule that penetrates the intercellular junctions of the EC monolayers (very leaky to begin with, in our cell culture conditions), thus having access to both apical and basolateral aspects of the plasma membrane. Total cellular extracts were clarified and subjected to sequential incubations with neutravidin-agarose (to bind the biotinylated cell surface proteins) and anti-hPV1C pAb-agarose to bind the remaining (intracellular) pool of PV1.
As seen in Figure 3A, most of PV1 is found at the cell surface after 2 and 5 days of continuous PMA treatment, shown by immunoblotting with anti-PV1 antibodies. The higher molecular weight band is chicken IgY that leaked from the beads during boiling in SDS-PAGE sample buffer.
Figure 3.
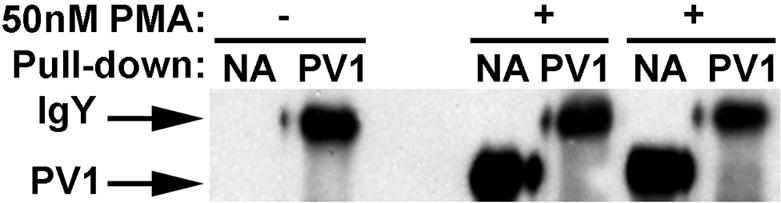
Most of PV1 protein is found on the cell surface. Immunoblotting with anti-hPV1C pAb of proteins bound to either neutravidin (NA) or anti-PV1 (PV1) from extracts obtained from either control ECs or ECs treated with 50 nM PMA for 2 or 5 days, showing that most of PV1 in on the cell surface.
PMA Induces De Novo Formation of SDs and FDs That Can Be Labeled with PV1 Antibodies
Previous work demonstrated the lack of diaphragms in HUVECs in culture (Lombardi et al., 1987). Likewise, analysis by transmission electron microscopy (TEM) of the human ECs from control experiments (i.e., same time-length culture in absence of PMA) documented the absence of caveolar SDs (Figure 4H) and the absence of TEC and fenestrae (unpublished data). Noteworthy, is the loss of the caveolar SDs in HLMVEC, in line with the loss of PV1 expression, as shown above.
Figure 4.

PMA induces de novo formation of fenestrae, TEC, and caveolar SDs only in ECs (A and D, and G and I) but not in non-EC types such as fibroblasts (F) as demonstrated by routine morphology of LX-112–embedded specimens. PMA induces fenestrae with FDs (A and B, and G and I), TEC with SDs (B and I) and caveolar SDs (C–D and I) in HUVEC. The newly formed FDs and SDs contain PV1 as demonstrated by immunogold labeling with anti-hPV1C pAb followed by a 6-nm gold-conjugated reporter antibody (G and I). Caveolae from control HUVECs do not have SDs and do not stain with PV1 antibodies (H). Similar results were obtained in HDMVEC or HLMVEC. Caveolae from either control (E) or PMA-treated (F) HDF do not stain with anti-PV1 antibodies and do not have SDs. Arrows point to either SDs or FDs. Arrowheads point to the insertion point of the SDs in the neck of caveolae. Bars, 100 nm.
The caveolae in each of the EC type studied had SDs as early as 24 h after PMA treatment (Figure 4, B and C, and Table 3) in addition to fenestrae (Figure 4, A, B, G, and I) and TEC (Figure 4, B and I), as shown by TEM micrographs. Quantitative analysis of the surface density of SDs, TEC and fenestrae induced by PMA in different cell types is presented in Table 3. Note that the surface density of fenestrae in HUVEC falls in the same order of magnitude with the previously reported data (Lombardi et al., 1987). We have expanded the survey to several other ECs as well as nonendothelial cell types. Surprisingly, the kinetics and magnitude of the formation of SDs and FDs were drastically different according to the EC type. Although in HUVEC fenestrae and TEC appeared only after 2 or more days of culture in presence of PMA, in the microvascular cells (most notably HDMVEC) they were present as soon as 16–24 h at much higher surface density (i.e., two orders of magnitude difference) than in their large vessel counterparts. The number of fenestrae and TEC found decreased from HDMVEC-neo > HDMVEC-Ad > HLMVEC >> HUVEC, which parallel the PV1 levels (Tables 3 and 2, respectively). Preliminary data also showed that the surface density of the SDs and FDs in HDMVEC is dependent on the commercial source of the cells (unpublished results), which presumably indicates differences in the isolation of the ECs. No SDs or FDs were detected in control (Figure 4E) or PMA-treated human dermal fibroblasts (Figure 4F), HeLa, HEK293 or COS7 (unpublished results).
Table 3.
Morphometric analysis of the presence of SDs and FDs
| Fenestrae/100 μm2a | TEC/100 μm2a | Caveolar SDs TEM, no tilting (%) of total no. of vesiclesb | Caveolar SDs TEM + tilting (%) of total no. of vesiclesb | Anti-PV1 labeled caveolae (%) of total no. of vesicles | Caveolar SDs TEM + Tilting + anti-PV1 labeling (%) of total no. of vesicles | SDs of TEC TEM + Tilting + anti-PV1 labeling (%) of total no. of vesicles | FDs of Fenestrae TEM + Tilting + anti-PV1 labeling (%) of total no. of vesicles | |
|---|---|---|---|---|---|---|---|---|
| PMA treatment | ||||||||
| HUVEC | 0.0079 | 0.0006 | 5% | 17% | 68.9% | 81.16% | – | – |
| HLMVEC | 0.99 | 0.0005 | 15% | 21% | 58.52% | 63.7% | – | – |
| HDMVECneo | 8.04 | 0.59 | 3% | 13% | 74.6% | 75.2% | – | – |
| HDMVECAd | 6.17 | 1.42 | 1% | 24% | 54.95% | 70% | 48% | 56.61% |
| Controls | NDc | ND | ND | ND | ND | ND | ND | ND |
| SiRNA | ||||||||
| HUVEC-PV1siRNA | ND | ND | 1% | 14% | 3% | 7% | ND | ND |
| HUVEC-scrsiRNA | 0.0063 | 0.0006 | 6% | 9% | 72.9% | 86.16% | 37% | 60% |
| HUVEC-nosiRNA | 0.0095 | 0.0007 | 2% | 21% | 79.3% | 82.13% | 20% | 31% |
| Transfections | ||||||||
| HUVEC | ND | ND | 7% | 18% | 68% | 83% | ND | ND |
| HUVEC mock | ND | ND | ND | ND | ND | ND | ND | ND |
| HDF | ND | ND | 1% | 14% | 53% | 62% | ND | ND |
| HDF mock | ND | ND | ND | ND | ND | ND | ND | ND |
–, represents experiments not done.
The area was calculated considering the thickness of the sections as 50 nm
A fraction of the SDs identified by TEM or upon tilting was also labeled by anti-PV1 or anti-tag antibodies
ND, none detected
To see whether these newly formed SDs and FDs contain PV1 or not, we localized the protein in ECs treated with PMA by immunogold labeling using anti-hPV1C pAb. PV1 was specifically associated with the newly formed SDs and FDs (Figure 4, G and I). This demonstrates that the same correlation between the presence of the diaphragms and the presence of PV1, shown previously in situ (Stan et al., 1999a, 1999b), is maintained in cells in culture. In favorable sections, several gold particles were found per diaphragm (Figure 4, G and I). No label was found on either plasmalemma proper, coated pits, or intercellular junctions. Similar results were obtained in all ECs studied.
The quantitative analysis of the presence of the TEC and fenestrae was fairly easy to perform (Table 3). However, the presence of the SDs of caveolae was much harder to demonstrate. The reason is that their diameter is smaller (∼25–40 nm) than the thickness of a standard section (∼50–70 nm). In any given section, the number of caveolae that were cut under an incidence that would allow the unequivocal discrimination of the presence of the SDs was small (Table 3). Basically, in order to see the SD in the neck of caveola, the latter has to be still attached to the plasma membrane and the SD has to be cut in such a way as to leave any portion or the rim of the caveolar neck out of the picture. For this the standard (50–70 nm) sections were clearly inappropriate. The detection of the SDs was improved by reducing the section thickness to 30–40 nm, which enabled unambiguous morphological identification of the SDs in a fraction of the total number of caveolar profiles on a given section (Table 3). Specimen tilting at various angles in the microscope allowed us to detect caveolar SDs in even higher numbers. This enabled the unbiased collection of statistically significant data in conditions of adequate sampling (Table 3). Most importantly, in the PMA-treated samples most (>98%) caveolar necks that allowed a clear assessment of the presence of the diaphragm had a SD. The level of confidence of the SD presence was further increased by the use of anti-PV1 immunocytochemistry, although this was chiefly used to demonstrate the correlation between presence of the diaphragms and PV1 expression.
Admittedly, even these combinations of techniques did not allow assessing whether all caveolae had SDs labeled by anti-PV1 antibodies. There were few instances where we have encountered caveolae-like vesicular profiles that were labeled by the antibody and where it was impossible to determine whether there was a diaphragm and conversely, vesicular profiles that contained a diaphragm but were not labeled by the antibody (Table 3). Although the former discrepancy is clearly a technical limitation in detection, the latter most probably means incomplete antibody labeling, which is a common occurrence.
The imperfections in detection of the SDs do not hurt the overall conclusions. The lack of diaphragms was previously demonstrated by other investigators by both TEM and freeze-fracture in the case of HUVECs (Lombardi et al., 1987). This is in agreement with our data that correlate the lack of SDs or FDs and lack of PV1 in the control ECs. Furthermore, PV1 presence clearly correlates with the physical presence of the SDs of TEC and FDs of fenestrae induced by PMA. Although we were not able to assess the presence of the SDs in all caveolae, we were able to show it for significant numbers.
Thus, in keeping with the data obtained in situ (Stan et al., 1999a, 1999b), the strong correlation between the presence of the diaphragms and presence of PV1 is maintained in cells in culture, which is important to bear in mind.
The above results show that conditions that induce the formation of the SDs and FDs lead to the upregulation of PV1, which can be found within the de novo formed structures, in several copies per diaphragm. This further validates the close temporal and spatial correlation between PV1 and the FDs of fenestrae in situ and those induced in culture are the same, in addition to the published EM data (e.g., by rapid-freeze deep-etch) documenting their morphological similarity (Lombardi et al., 1986).
Downregulation of PV1 mRNA with siRNA Prevents the Formation of SDs and FDs
The next question was to see whether the silencing of PV1 mRNA and knockdown of the protein using small interfering PV1 RNA (PV1 siRNA) would prevent the formation of the SDs and FDs induced by PMA. If successful, this experiment would be the equivalent of the genetic deletion of the PV1 gene. To achieve the silencing of PV1 mRNA we used several PV1-siRNA duplexes, which we transfected into endothelial cells 16–24 h before PMA treatment. The controls consisted of their scrambled siRNA counterparts. We primarily used HUVEC for these experiments for two reasons: i) HUVEC are devoid of PV1 expression and do not have either SDs and FDs as determined by others and confirmed by us (Table 2); ii) HUVEC were the most amenable cells to transfection in combination with Targefect-siRNA reagent, as determined by using a FITC-labeled siRNA (our unpublished data).
First, we determined that two siRNA duplexes were particularly effective in downregulating the PV1 mRNA and, most importantly, the PV1 protein. These siRNAs were dubbed 258PV1-siRNA and 249PV1-siRNA (see MATERIALS AND METHODS for sequence information). The 258PV1-siRNA downregulated up to 98% of the PV1 protein (Figure 5A) at doses as low as 75 pmoles/well, whereas 249PV1-siRNA was this effective at higher dose (200 pmoles/well). This result was also confirmed by immunofluorescence with anti-hPV1C pAb (Figure 5B, bottom panels). The PV1 levels in HUVEC treated with scrambled PV1-siRNA were roughly the same as those induced in a nontreated control cell (Figure 5A, right panel).
Figure 5.

PV1 down-regulation by siRNA prevents the formation of the diaphragms in PMA-treated HUVEC. (A) Immunoblotting with anti-hPV1C pAb. The treatment of HUVEC with two independent PV1-siRNAs prevents the upregulation of PV1 by PMA (left panel), whereas the scrambled siRNA does not (right panel). (B) Colocalization of PV1 and caveolin-1 by immunofluorescence with anti-hPV1C pAb (red) and anti-Cav1 pAb (green). In HUVEC treated with 75 pmol of 258PV1-siRNA, PV1 is effectively downregulated, whereas scrambled siRNA (scr) has no effect. Bar, 2 μm. (C) The down-regulation of PV1 by 258PV1-siRNA prevents the formation of caveolar SDs as shown by EM (bottom panels). Both SDs and FDs are present and can be labeled with anti-PV1 pAb in control cells treated with scrambled siRNA (scr, top panels).
We then compared by EM analysis PMA-treated HUVECs that have been previously transfected with either the PV1-siRNA, scrPV1-siRNA control, or no siRNA treatment control. The goal was to demonstrate the lack of the SDs and FDs in the PV1-siRNA–treated cells upon PMA treatment, compared with the controls. As above, to help with the quantitative aspect of EM we have performed specimen tilting and labeling with gold-conjugated anti-hPV1C antibodies. As expected, we did not detect any labeling with anti-hPV1C antibody in the PV1-siRNA–treated samples, in marked contradistinction with the scrPV1-siRNA control or untreated control, where roughly ∼70% of the caveolae were labeled. The SDs and FDs (Table 3) in the PMA-treated controls (Figure 5C, top panel) were readily present and labeled by the anti-PV1 antibody, in high contrast with the marked absence of both the SDs and gold label on the PV1-siRNA–treated ones (Figure 5C, bottom panel). Most importantly, in the siRNA-treated samples none of the caveolar necks that allowed a clear assessment of the presence of the diaphragm had an SD present. The quantitation data have been incorporated in Table 3 and clearly show that PV1 downregulation by siRNA prevents the formation of the SDs. A notable finding was that no fenestrae or TEC were detected in the PV1siRNA–treated samples, which implies that PV1 is required for their formation.
The data from these crucial experiments strongly suggest that PV1 is necessary for the formation of SDs and FDs.
Overexpression of Exogenous, Tagged PV1 Shows Colocalization With Caveolin 1 at the Level of Plasma Membrane of Cells in Culture
Another way of looking at the role of PV1 in the formation of the diaphragms is the reverse experiment, that is, to see whether over expression of PV1 in both ECs and nonendothelial cell types (e.g., HDF, HeLa, COS7, HEK293) lacking both SDs and FDs would result into a diaphragm phenotype. We first characterized the PV1 overexpression constructs in order to make sure that they express a correct protein that is trafficked to the correct location in the cell (i.e., caveolae).
To aid the detection of the exogenously introduced protein, human PV1 was tagged with either FLAG (hPV1-FLAG) or HA (hPV1-HA) epitopes at its C terminus, which is extracellular. In most experiments, the epigenetic expression of tagged hPV1 was from bicistronic vectors that also encoded for a humanized green fluorescent protein from Renilla (hrGFP). hrGFP expression was used for the identification of transfected cells in imaging experiments as well as to judge the transfection efficiency for biochemistry and EM experiments.
Immunoblotting of proteins from ECs or non-EC types after transfection with either of the constructs (i.e., hPV1-FLAG or hPV1-HA) with the appropriate antitag antibody as well as anti-hPV1C pAb, showed a single band at the appropriate MW size (∼60 kDa; Figure 6A). The band immunoprecipitated by either anti-FLAG or anti-HA mAb was recognized by blotting with anti-hPV1C pAb (Figure 6B); the reverse experiment (immunoprecipitation with anti-PV1 and blot with corresponding antitag) was also positive (Figure 6C). These demonstrate that the correct protein sequence was expressed.
Figure 6.

Validation of huPV1-HA or huPV1-Flag constructs and demonstration of their cell surface pool. (A) Western blotting using anti-FlagM2 mAb of total cell lysates of HUVECs mock-transfected with pIRES-hrGFP-1a empty vector (Mock) or transfected with 0.1 (0.1) or 0.4 (0.4) μg of huPV1-Flag plasmid DNA. (B) Immunoprecipitations using either anti-HA or anti-Flag of either huPV1-HA or huPV1-Flag proteins, respectively, immunoblotted with anti-huPV1C pAb. (C) Immunoprecipitations of either huPV1-HA or huPV1-Flag proteins from HUVEC lysates, using anti-huPV1C pAb, immunoblotted with either anti-HA or anti-Flag, respectively. (D) Immunoblotting with anti-PV1 of proteins bound to either neutravidin (NA) or anti-PV1-agarose (PV1) resulted from surface biotinylation of control cells or cells transfected with either empty vector (mock) or with PV1–3xHA (PV1-HA). Data in D are representative for at least three independent experiments.
To determine the size of the tagged PV1 pool that was able to reach the plasma membrane, we have performed surface biotinylation followed by sequential pull-down with neutravidin and anti-PV1, as already described. As seen in Figure 6D, >75% (average of three independent experiments) of PV1 can be biotinylated on the cell surface at 48 h posttransfection, consistent with a large PV1 pool at the level of the plasma membrane.
In keeping with this, we found a punctuated pattern at the level of the plasma membrane in transfected nonpermeabilized cells (Figure 7A) by immunofluorescence using antitag antibodies (i.e., anti-FLAG mAb and anti-HA mAb). The same pattern was found when hPV1 was tagged with either FLAG or HA epitopes demonstrating that this localization is tag-independent (unpublished data).
Figure 7.

Transiently expressed PV1–3xHA colocalizes with caveolin 1 at the cell surface in either ECs (A and B) or fibroblasts (C). (A) Immunofluorescence with anti-HA mAbs (red) demonstrating the staining in fixed, nonpermeabilized ECs transfected with hPV1–3xHA_IRES_hrGFP construct. HrGFP (green) demonstrates the transfected cells. Bars, 10 μm. (B) Colocalization by immunofluorescence of PV1-HA (green) and caveolin 1-mRFP (red) in live ECs. An overlay of a brightfield image (bottom left panel) and the hrGFP staining (blue) demonstrates a cell transfected with the hPV1–3xHA_IRES_hrGFP construct. The bottom right panel (Merge) shows the signal obtained from hrGFP (blue), caveolin 1-mRFP (red), and PV1-HA (green). The staining obtained with anti-HA mAb is shown in green in the top right panel (PV1-HA) and the pattern obtained with caveolin 1-mRFP in the top left panel (Caveolin 1-mRFP). The white squares indicate the area shown enlarged (3×) in the insets. Bars, 10 μm (C). Colocalization of PV1–3xHA and native Caveolin 1 in permeabilized human dermal fibroblasts as demonstrated by epifluorescence. Due to high signal obtained from ER and Golgi in the case of PV1–3xHA overexpression, only peripheral parts of the cells were imaged in permeabilized cells.
Finally, to determine whether the overexpressed hPV1 traffics correctly to the neck of caveolae, we have colocalized it with caveolin 1, the most accepted caveolar marker (Kurzchalia et al., 1992; Rothberg et al., 1992; Dupree et al., 1993). As seen in Figure 7B, PV1 significantly colocalizes with caveolin 1-mRFP at the cell surface in cotransfection experiments in live endothelial cells (see MATERIALS AND METHODS and figure legend). Similarly, PV1-HA colocalized with native caveolin 1 in permeabilized fixed ECs (unpublished data) and fibroblasts (Figure 7C) or other non-EC types (e.g., HeLa, COS7, and HEK293; unpublished data).
Expression of Tagged PV1 Induces Formation of only SDs That Can Be Stained with Antitag Antibodies
We next looked using EM if overexpression of hPV1 would lead to formation of the diaphragms or not. For this we used both ECs (HUVEC) and fibroblasts (HDF) that do not have caveolar SDs and do not express hPV1 either in situ or in culture. To be used for EM studies, the cell population needed to have a high content of transfected cells. Because of low transfection efficiency of these cell types by most available transfection reagents, we electroporated (“nucleofected”) HUVEC (∼60–70% efficiency by flow cytometry) and HDF (∼80–85% efficiency) using the Nucleofector device. The “nucleofection” has the advantage to be very efficient for cell lines hard to transfect and delivers the DNA directly to the nucleus, resulting in expression of the protein as soon as 2–4 h posttransfection. Because of high efficiency, it also did not require detachment of the cells after PV1 was expressed. However, this is a relatively new technology, which still awaits a full explanation of its mechanism. Therefore, we also used an alternate transfection strategy for control, where we transfected HUVEC using the Targefect F1 (∼20–30% efficiency) reagent followed by cell dissociation in a trypsin-free buffer and isolation of the transfected cells by FACS. To eliminate dead cells and avoid possible artifacts due to loss of adhesion, the isolated cells were replated at high density (>85%) and allowed to reattach for 20 h before fixation. We did not find any reagent that yielded satisfactory results for HDF transfection (<1% with the most efficient reagent); therefore, we used other cell types such as HeLa, Cos7, or HEK293 for this type of experiment. The DNA transfected was either hPV1-HA or hPV1-Flag encoded in a bicistronic vector also expressing hrGFP. In both sets of experiments (nucleofection vs. transfection) cells were fixed and processed for immunogold labeling with antitag antibodies to follow the exogenous protein and then resin embedded. Similar results have been found with both transfection strategies (see below).
As seen in Figure 8, the caveolae in both ECs (Figure 8, B–E) and non-EC types (i.e., HDF; Figure 8, G and H) transfected with tagged hPV1 were provided with SDs that were labeled with antitag antibodies. This demonstrated that the exogenous hPV1 protein participates in the formation of these diaphragms. No gold particles were found on either plasmalemma proper, coated pits, or intercellular junctions. Also, no gold particles were found on the controls where the primary antibody was either replaced with an irrelevant, isotype matched mouse IgG or omitted altogether. Moreover, no TEC or fenestrae were detected in these cells after extensive surveys of the samples, suggesting that PV1 expression is not enough for the expression of these structures. This lack of fenestrae and TEC is not unexpected, because this very phenotype is usually found in situ in the continuous endothelium of the lung, tongue, or kidney vasa recta.
Figure 8.

Overexpression of PV1 in cells that lack PV1 and both FDs and SDs results in formation of caveolar SDs. Electron micrographs of cells transfected (by nucleofection) with huPV1-Flag construct showing that caveolae are provided with SDs in HUVECs (B–E) or HDF (G–H) while the SDs lack in empty vector transfected control HUVEC (A) or HDF (F). The newly formed diaphragms can be labeled with anti-FLAG mAb (B, C, G, and H) showing that the exogenous PV1 protein participates in their structure. In favorable sections, several gold particles were detected in one diaphragm (G and H). Arrows point to labeled diaphragms. Bars, 50 nm.
The quantitative aspects of the overexpression experiments are shown in Table 3. Again the unambiguous demonstration of both the label and SDs occurred on a relatively small number of caveolae in transfected cells. However, the contrast between this and the complete lack of label and SDs in the controls are indicative of the fact that PV1 is a key component for SD formation. What bolsters this conclusion is the fact that PV1 forms SDs in cells that do not have them in situ, such as HDF.
Signaling Pathways Involved in the Upregulation of PV1 by PMA
The Upregulation of PV1 by PMA is PKC Independent PMA is a known activator of PKC but recent findings have shown that it can also activate at least four other classes of proteins including Ras-GRP (an activator of Ras GTPase), chimaerin (an GAP/activator of Rac1 GTPase), PKD, and Munc13 (reviewed in Kazanietz, 2002).
To ascertain whether PV1 upregulation by PMA is PKC dependent, we looked at the PV1 levels in ECs treated with PMA in presence of pharmacological inhibitors of PKC. We found that inhibition of the kinase enzymatic activity of PKC by bisindolylmaleimide and Go6983 at concentrations of 10–500 nM did not inhibit PV1 upregulation by PMA (Figure 9A and unpublished data). Moreover, staurosporine, also an inhibitor of PKC catalytic activity, had a synergistic effect with PMA, increasing the PV1 levels in dose-dependent manner (Figure 9B). Although the doses used (0.5–50 nM) were well within the interval of “specificity” for PKC inhibition, staurosporine is a rather promiscuous inhibitor that inactivates several other classes of kinases including PKA and Akt and can interfere with other pathways. This suggests that another kinase could be involved in PV1 regulation.
Because all these inhibitors have issues of stability in solution, we performed controls to demonstrate their activity. Immunoblotting with antiphosphoserine PKC pseudosubstrate antibody (PS-PKC-PS) showed marked increase in staining in the control PMA-treated cells compared with untreated ECs, whereas the staining markedly decreased in the samples treated with PMA plus inhibitors (unpublished data).
The Upregulation of PV1 by PMA Is Dependent on the Activation of a C1 Domain–containing Protein We also found that calphostin C, an inhibitor that competes the binding of DAG/PMA to the C1 domain of PKC and other C1 domain–containing proteins, inhibits PV1 upregulation at doses of 10–100 nM (Figure 9A and our unpublished data).
Taken together, these data show that PV1 upregulation by PMA is PKC independent. The data obtained with staurosporine treatment indicates that yet another kinase might be involved in PV1 regulation. The inhibition observed after calphostin C treatment demonstrates that a C1 domain–containing protein is required for the upregulation of PV1.
PV1 Upregulation Requires the Activation of Erk1/2 MAP Kinase Pathway Another well-known effect of PMA is the activation of Erk1/2 MAP kinase pathway (Frost et al., 1994; Verin et al., 2000). At least three of the five protein classes directly activated by PMA (i.e., PKC, Ras-GRP, chimaerin) could transduce their transcriptional signals via the MAP kinase pathway (Kazanietz, 2002). To see whether this pathway could affect PV1 regulation, we treated the cells with MAP kinase inhibitors.
As shown in Figure 10A, treatment of human ECs with PMA led to the activation of the components of the Erk1/2 pathway, which led to the activation of Elk1 transcription factor. Elk1 is a known carrier of the transcriptional effects of Erk1/2 (Cobb, 1999)and therefore a putative regulator of PLVAP gene. However, whether this is true or not needs more thorough investigation.
Figure 10.

Erk1/2 MAP kinase activity is required for the upregulation of PV1 as well as for the morphological changes induced by PMA in ECs. PMA activates the Erk1/2 MAP kinase pathway in ECs as demonstrated by immunoblotting with phospho-specific antibodies to components of the pathway such as MEK1, Erk1/2, and Elk-1, a downstream effector of Erk1/2 (F). MEK1, Erk1/2, and β-actin (to show the loading, Actin) were probed on the same membrane. (G) Inhibitors of MEK1 such as U0126 and PD98059 prevent the upregulation of PV1 by PMA in a dose-dependent manner, as shown by immunoblotting with anti-PV1C pAb. U0124, an inactive analog of U0126 is without effect. Immunoblotting with anti β-actin mAb shows the loading (Actin). Same inhibitors of MEK1, U0126 (D), and PD98059 (E), prevent the phenotype change of ECs induced by PMA (A), whereas U0124 has no effect (C). Control ECs (A) treated with 50 nM PMA or (B) without treatment.
Treatment of ECs with inhibitors of MEK1 (kinase immediately upstream of Erk1/2), such as PD98059 (0.25–25 μM) and U0126 (1–10 μM), prevented the upregulation of PV1 by PMA in dose-dependent manner, whereas the inactive compound U0124 did not have any effect (Figure 10B). Moreover, the inhibition of MEK1 abolished also the lamelipodia formation induced by PMA in these ECs (Figure 10A).
DISCUSSION
The work presented here is a result of our interest on the elucidation of the molecular components of the structures involved in transendothelial exchanges. Using our purification method of endothelial caveolae (Stan et al., 1997) and taken advantage of a novel antiendothelium antibody (Ghitescu et al., 1997), we have identified and cloned PV1, an endothelial specific protein (Stan et al., 1999b). We have further shown PV1 to be specifically associated with the SDs of caveolae and TEC as well as with the diaphragms of fenestrae in situ. Moreover, several PV1 dimers were shown to reside in one diaphragm (either SDs or FDs) by immunocytochemistry (Stan et al., 1999a, 1999b) and by cross-linking (Stan, 2003). This was the first demonstration that these structures, besides being morphologically similar, were also biochemically related sharing at least one protein, namely PV1.
The function of the diaphragms is not known. By their localization at proposed sites of transendothelial exchange, one could assume that they function either as a sieving device (opposing the exchanges of select molecules) or a facilitating device (enabling selective transport of molecules) or both.
As for the presence of PV1 on such diaphragms, it could function as either a structural component, function modulator component or both. To gain insight into the function of PV1 in the diaphragms, we have carried out experiments by several approaches that address this issue.
First, we turned to a cell culture system where transendothelial channels and fenestrae could be induced de novo in any EC type by phorbol esters such as PMA (Lombardi et al., 1985, 1986, 1987, 1988). For this, we used several human EC types isolated from vessels provided with continuous endothelia, such as large vessels (umbilical vein) as well as from the microvasculature (skin and lung). These comprised ECs whose caveolae do not have SDs (e.g., HUVEC, HDMVEC; Stan et al., 1999b) and ECs whose caveolae are provided with SDs (e.g., lung), in situ. HUVEC were particularly useful as their caveolae were shown to lack SDs by other groups and also provided a control for our ability to reproduce previously reported findings. For controls, nonendothelial cell types that lack both the structures and the protein were used.
On treating the cells with PMA only the human EC types underwent the characteristic morphological changes as previously reported by Lombardi et al. (1985, 1986, 1987, 1988). The changes in cell shape differed according to the EC type (e.g., microvs. macrovascular) and to the proliferative or quiescent state of the cell and ranged from fibroblast-like (e.g., HUVEC, HLMVEC and confluent HDMVEC) to extremely flat “pancake-like” shape (e.g., subconfluent HDMVEC). No detectable change in shape occurred in non-EC types by simple inspection of the culture.
At biochemical level, we show that ECs in culture lack PV1 expression. Moreover, even cells that do express PV1 in situ lose it by the fourth passage (the earliest passage we looked at), such as in the case of HLMVEC. We found that PMA treatment upregulates hPV1 mRNA and protein in time- and dose-dependent dependent manner. Again there were marked differences between the micro- and macrovascular ECs in terms of levels of PV1 expression upon PMA treatment. The highest level of induction occurred in HDMVEC, which paralleled the morphological changes. The PV1 upregulation did not occur in non-EC types. Thus conditions known to induce the de novo formation of SDs and FDs also induce the expression of PV1.
By EM, we show that all untreated human ECs examined in culture lack diaphragms (both SDs and FDs). In the case of the HLMVEC this correlates the biochemical data showing loss of PV1 expression. Remarkably, PMA treatment of human ECs leads to formation of the TEC and fenestrae, with their associated diaphragms. We found that the caveolar SDs were also induced in cells treated with PMA. Please note that in the PMA-treated ECs the level of induction of PV1 protein directly correlates with the level of induction of SDs and FDs (i.e., both are highest in HDMVEC). Additionally, most of the PV1 protein induced by PMA was found at the cell surface as shown by biochemistry (e.g., surface biotinylation) at time points that were evaluated by EM. As expected, the de novo formed diaphragms could be labeled with anti-hPV1C pAb.
Moreover, in crucial experiments in which the PV1 mRNA was silenced and the PV1 protein downregulated >95%, we show that the diaphragms do not form in the absence of PV1. These data strongly suggest that PV1 is a key structural element of the diaphragms.
Another important experiment to do was to see whether the transfection of ECs in culture with tagged PV1 would restore the diaphragms or not. Our findings show that indeed, transfection of ECs with tagged PV1 leads to formation of SDs that could be labeled with antitag antibodies. Moreover, PV1 transfection in the non-EC cell types leads to formation of SDs at the mouth of their caveolae. These data bring further support the idea of PV1 being necessary for the formation of the diaphragms.
It is not unexpected that only caveolar SDs are detected upon PV1 transfection. A possible explanation is suggested by the existence in situ, in the intact animal, of endothelial caveolae with (e.g., in lung, endocrine glands, kidney vasa recta, tongue) and without (e.g., in myocardium, skeletal muscle, skin) SDs, and fenestrae with (e.g., in all endocrine glands, kidney peritubular capillaries, intestine vili) and without FDs (e.g., in kidney glomerulus). A reasonable enough interpretation of this situation is that the signals that concur to the formation of SDs or FDs are different from those involved in the biogenesis of caveolae or fenestrae, respectively. In other words, the component(s) of the diaphragms would form the diaphragm if a preexisting structure (e.g., caveolar invagination or fenestral pore) would be available. Thus, by expressing exogenous PV1 in ECs in culture, one finds only SDs because only caveolae are present in these cells in culture, this mimicking the phenotype found in ECs in the lung in situ. More remarkably, the fact that the SDs were formed even in ECs and nonendothelial cell types that do not have PV1 in situ, such as HUVEC, HDMVEC, and HDF (as well as HeLa, COS7, and HEK293), shows that either i) PV1 alone is sufficient to form the diaphragms or ii) the other putative constituents of the diaphragms (e.g., intracellular proteins) are ubiquitously expressed and PV1 is the key limiting component. Our preliminary data obtained in other systems (e.g., yeast two hybrid and affinity chromatography) point to the second situation to be true. Therefore, it is far from us to sustain that PV1 is the only component necessary for the formation of these diaphragms. What our data have proven so far is that PV1 is present into both SDs and FDs and that it is necessary for diaphragm formation, our case being stronger in the case of the SDs.
Finally, we probed into the signaling pathways that might be involved in PV1 regulation. The PMA effect seems to be PKC independent because none of the PKC kinase activity inhibitors (i.e., BIM and Go6983) prevent/inhibit the upregulation of PV1. Even further, staurosporine, another PKC kinase inhibitor, increased the levels of PV1. Only calphostin C, a DAG/PMA competitor for binding to the C1 domain of PKC and other PMA targets, inhibited the upregulation. Because at least three other classes of C1 domain–containing proteins unrelated to PKCs (e.g., chimaerin, Munc13, Ras-GRP) have been already described (Kazanietz, 2002), this result demonstrates the involvement of a C1 domain–containing protein in the signaling cascade leading to PV1 upregulation. It would be of interest to see whether any of these classes of proteins would have a role in the regulation of PV1 as well as SD and FD formation. For example chimaerin, one of the proteins activated by PMA, activates Rac1 GTPase, which in turn has a well documented role in controlling lamelipodia formation, thus providing an explanation for the EC phenotype changes seen by light microscopy.
The use of PMA in this system also prompted us to look at the involvement of MAP kinase Erk1/2 in the PV1 upregulation. Using pharmacological inhibition of MEK1, the kinase upstream of Erk1/2, we found that its activation is required by both cytoskeletal rearrangements as well as PV1 upregulation. This would be in line with the data showing upregulation of the fenestrae and TEC by growth factors such as VEGF (Roberts and Palade, 1995; Roberts et al., 1997; Esser et al., 1998), which is also known to activate the MAP kinase pathway via Ras. A more detailed analysis of the pathways involved in PV1 upregulation is currently underway.
Acknowledgments
We thank Dr. G. Palade for past support. We also thank to Drs. M. Farquhar, C. Carriere, T. Meerlo, A. Newton, M. Kazanietz, and J. Violin for advice. This work was supported by National Institutes of Health Grants HL65418 and AHA0060080Y.
Article published online ahead of print. Mol. Biol. Cell 10.1091/mbc.E03-08-0593. Article and publication date are available at www.molbiolcell.org/cgi/doi/10.1091/mbc.E03-08-0593.
Abbreviations used: a-hPV1C, anti-human PV1C pAb; DAG, diacyl glycerol; EC, endothelial cell; EBM2, endothelial basal medium lacking supplements; EGM2, endothelial growth medium; FD, fenestral diaphragm; hrGFP, “humanized” Renilla green fluorescent protein; SD, stomatal diaphragm; SSM, serum-starving medium (EBM2 with 1% BSA and 0.5% FBS); TEC, transendothelial channels; TEM, transmission electron microscopy.
References
- Bankston, P.W., and Milici, A.J. (1983). A survey of the binding of polycationic ferritin in several fenestrated capillary beds: indication of heterogeneity in the luminal glycocalyx of fenestral diaphragms. Microvasc. Res. 26, 36-48. [DOI] [PubMed] [Google Scholar]
- Bearer, E.L., and Orci, L. (1985). Endothelial fenestral diaphragms: a quick-freeze, deep-etch study. J. Cell Biol. 100, 418-428. [DOI] [PMC free article] [PubMed] [Google Scholar]
- Bendayan, M. (2002). Morphological and cytochemical aspects of capillary permeability. Microsc. Res. Tech. 57, 327-349. [DOI] [PubMed] [Google Scholar]
- Clementi, F., and Palade, G.E. (1969a). Intestinal capillaries. I. Permeability to peroxidase and ferritin. J. Cell Biol. 41, 33-58. [DOI] [PMC free article] [PubMed] [Google Scholar]
- Clementi, F., and Palade, G.E. (1969b). Intestinal capillaries. II. Structural effects of EDTA and histamine. J. Cell Biol. 42, 706-714. [DOI] [PMC free article] [PubMed] [Google Scholar]
- Cobb, M.H. (1999). MAP kinase pathways. Prog. Biophys. Mol. Biol. 71, 479-500. [DOI] [PubMed] [Google Scholar]
- Dupree, P., Parton, R.G., Raposo, G., Kurzchalia, T.V., and Simons, K. (1993). Caveolae and sorting in the trans-Golgi network of epithelial cells. EMBO J. 12, 1597-1605. [DOI] [PMC free article] [PubMed] [Google Scholar]
- Dvorak, A.M., and Feng, D. (2001). The vesiculo-vacuolar organelle (VVO). A new endothelial cell permeability organelle. J. Histochem. Cytochem. 49, 419-432. [DOI] [PubMed] [Google Scholar]
- Esser, S., Wolburg, K., Wolburg, H., Breier, G., Kurzchalia, T., and Risau, W. (1998). Vascular endothelial growth factor induces endothelial fenestrations in vitro. J. Cell Biol. 140, 947-959. [DOI] [PMC free article] [PubMed] [Google Scholar]
- Frost, J.A., Geppert, T.D., Cobb, M.H., and Feramisco, J.R. (1994). A requirement for extracellular signal-regulated kinase (ERK) function in the activation of AP-1 by Ha-Ras, phorbol 12-myristate 13-acetate, and serum. Proc. Natl. Acad. Sci. USA 91, 3844-3848. [DOI] [PMC free article] [PubMed] [Google Scholar]
- Ghitescu, L.D., Crine, P., and Jacobson, B.S. (1997). Antibodies specific to the plasma membrane of rat lung microvascular endothelium. Exp. Cell Res. 232, 47-55. [DOI] [PubMed] [Google Scholar]
- Kazanietz, M.G. (2002). Novel “nonkinase”phorbol ester receptors: the C1 domain connection. Mol. Pharmacol. 61, 759-767. [DOI] [PubMed] [Google Scholar]
- Kurzchalia, T.V., Dupree, P., Parton, R.G., Kellner, R., Virta, H., Lehnert, M., and Simons, K. (1992). VIP21, a 21-kD membrane protein is an integral component of trans-Golgi-network-derived transport vesicles. J. Cell Biol. 118, 1003-1014. [DOI] [PMC free article] [PubMed] [Google Scholar]
- Lombardi, T., Montesano, R., Furie, M.B., Silverstein, S.C., and Orci, L. (1986). Endothelial diaphragmed fenestrae: in vitro modulation by phorbol myristate acetate. J. Cell Biol. 102, 1965-1970. [DOI] [PMC free article] [PubMed] [Google Scholar]
- Lombardi, T., Montesano, R., Furie, M.B., Silverstein, S.C., and Orci, L. (1988). In vitro modulation of endothelial fenestrae: opposing effects of retinoic acid and transforming growth factor beta. J. Cell Sci. 91, 313-318. [DOI] [PubMed] [Google Scholar]
- Lombardi, T., Montesano, R., and Orci, L. (1985). Polarized plasma membrane domains in cultured endothelial cells. Exp. Cell Res. 161, 242-246. [DOI] [PubMed] [Google Scholar]
- Lombardi, T., Montesano, R., and Orci, L. (1987). Phorbol ester induces diaphragmed fenestrae in large vessel endothelium in vitro. Eur J. Cell Biol. 44, 86-89. [PubMed] [Google Scholar]
- Maul, G.G. (1971). Structure and formation of pores in fenestrated capillaries. J. Ultrastruct. Res. 36, 768-782. [DOI] [PubMed] [Google Scholar]
- Michel, C.C., and Curry, F.E. (1999). Microvascular permeability. Physiol. Rev. 79, 703-761. [DOI] [PubMed] [Google Scholar]
- Milici, A.J., Furie, M.B., and Carley, W.W. (1985a). The formation of fenestrations and channels by capillary endothelium in vitro. Proc. Natl. Acad. Sci. USA 82, 6181-6185. [DOI] [PMC free article] [PubMed] [Google Scholar]
- Milici, A.J., L'Hernault, N., and Palade, G.E. (1985b). Surface densities of diaphragmed fenestrae and transendothelial channels in different murine capillary beds. Circ. Res. 56, 709-717. [DOI] [PubMed] [Google Scholar]
- Palade, G.E. (1991). Role of plasmalemmal vesicles. In: The Lung: Scientific Foundations, ed. R.G. Crystal and J.B. West, New York: Raven Press, Ltd., 359-367.
- Palade, G.E., and Bruns, R.R. (1968). Structural modulations of plasmalemmal vesicles. J. Cell Biol. 37, 633-649. [DOI] [PMC free article] [PubMed] [Google Scholar]
- Pino, R.M. (1986). The cell surface of a restrictive fenestrated endothelium. I. Distribution of lectin-receptor monosaccharides on the choriocapillaris. Cell Tissue Res. 243, 145-155. [DOI] [PubMed] [Google Scholar]
- Roberts, W.G., and G.E. Palade (1995). Increased microvascular permeability and endothelial fenestration induced by vascular endothelial growth factor. J. Cell Sci. 108, 2369-2379. [DOI] [PubMed] [Google Scholar]
- Roberts, W.G., and G.E. Palade (1997). Neovasculature induced by vascular endothelial growth factor is fenestrated. Cancer Res. 57, 765-772. [PubMed] [Google Scholar]
- Roberts, W.G., and Palade, G.E. (2000). Endothelial fenestrae and fenestral diaphragms. In: Morphogenesis of Endothelium, Vol. 8, ed. W.R.a.G.M. Rubanyi, Amsterdam: Hardwood Academic Publishers, 23-41. [Google Scholar]
- Rostgaard, J., and Qvortrup, K. (1997). Electron microscopic demonstrations of filamentous molecular sieve plugs in capillary fenestrae. Microvasc. Res. 53, 1-13. [DOI] [PubMed] [Google Scholar]
- Rothberg, K.G., Heuser, J.E., Donzell, W.C., Ying, Y.S., Glenney, J.R., and Anderson, R.G. (1992). Caveolin, a protein component of caveolae membrane coats. Cell 68, 673-682. [DOI] [PubMed] [Google Scholar]
- Simionescu, M., Simionescu, N., and Palade, G.E. (1974). Morphometric data on the endothelium of blood capillaries. J. Cell Biol. 60, 128-152. [DOI] [PMC free article] [PubMed] [Google Scholar]
- Simionescu, M., Simionescu, N., and Palade, G.E. (1982a). Differentiated microdomains on the luminal surface of capillary endothelium: distribution of lectin receptors. J. Cell Biol. 94, 406-413. [DOI] [PMC free article] [PubMed] [Google Scholar]
- Simionescu, M., Simionescu, N., and Palade, G.E. (1982b). Preferential distribution of anionic sites on the basement membrane and the abluminal aspect of the endothelium in fenestrated capillaries. J. Cell Biol. 95, 425-434. [DOI] [PMC free article] [PubMed] [Google Scholar]
- Simionescu, M., Simionescu, N., Silbert, J.E., and Palade, G.E. (1981a). Differentiated microdomains on the luminal surface of the capillary endothelium. II. Partial characterization of their anionic sites. J. Cell Biol. 90, 614-621. [DOI] [PMC free article] [PubMed] [Google Scholar]
- Simionescu, N., Simionescu, M., and Palade, G.E. (1981b). Differentiated microdomains on the luminal surface of the capillary endothelium. I. Preferential distribution of anionic sites. J. Cell Biol. 90, 605-613. [DOI] [PMC free article] [PubMed] [Google Scholar]
- Stan, R.V. (2002). Structure and function of endothelial caveolae. Microsc. Res. Tech. 57, 350-364. [DOI] [PubMed] [Google Scholar]
- Stan, R.V. (2003). Multiple PV1 dimers reside in the same stomatal or fenestral diaphragm. Am. J. Physiol. Heart Circ. Physiol. DOI: 10.1152/ajpheart. 00909.2003. [DOI] [PubMed]
- Stan, R.V., Arden, K.C., and Palade, G.E. (2001). cDNA and protein sequence, genomic organization, and analysis of cis regulatory elements of mouse and human PLVAP genes. Genomics 72, 304-313. [DOI] [PubMed] [Google Scholar]
- Stan, R.V., Ghitescu, L., Jacobson, B.S., and Palade, G.E. (1999a). Isolation, cloning, and localization of rat PV-1, a novel endothelial caveolar protein. J. Cell Biol. 145, 1189-1198. [DOI] [PMC free article] [PubMed] [Google Scholar]
- Stan, R.V., Kubitza, M., and Palade, G.E. (1999b). PV-1 is a component of the fenestral and stomatal diaphragms in fenestrated endothelia. Proc. Natl. Acad. Sci. USA 96, 13203-13207. [DOI] [PMC free article] [PubMed] [Google Scholar]
- Stan, R.V., Roberts, W.G., Predescu, D., Ihida, K., Saucan, L., Ghitescu, L., and Palade, G.E. (1997). Immunoisolation and partial characterization of endothelial plasmalemmal vesicles (caveolae). Mol. Biol. Cell 8, 595-605. [DOI] [PMC free article] [PubMed] [Google Scholar]
- Tkachenko, E., and Simons, M. (2002). Clustering induces redistribution of syndecan-4 core protein into raft membrane domains. J. Biol. Chem. 277, 19946-19951. [DOI] [PubMed] [Google Scholar]
- Verin, A.D., Liu, F., Bogatcheva, N., Borbiev, T., Hershenson, M.B., Wang, P., and Garcia, J.G. (2000). Role of ras-dependent ERK activation in phorbol ester-induced endothelial cell barrier dysfunction. Am. J. Physiol. Lung Cell Mol. Physiol. 279, L360-L370. [DOI] [PubMed] [Google Scholar]
- Wadia, J.S., Stan, R.V., and Dowdy, S.F. (2004). Transducible TAT-HA fusogenic peptide enhances escape of TAT-fusion proteins after lipid raft macropinocytosis. Nat. Med. 10, 310-315. [DOI] [PubMed] [Google Scholar]