Abstract
Cytotoxic T lymphocytes (CTLs) are important for the recognition of the hepatitis B virus (HBV), mediating immunoprotective mechanisms and determining the clinical outcome following HBV infection. CTLs recognize the invading virus via the T cell receptor (TCR). The aim of the current study was to investigate the variability of TCR in lymphocytes from patients with chronic hepatitis B and whether TCR genomic recombination is regulated by the current treatment strategies. Peripheral blood mononuclear cells (PBMCs) were isolated from patients with chronic hepatitis B and high-throughput sequencing was performed to analyze the gene expression diversity of β chain complementarity determining region. High-throughput sequencing produced ~380,000 reads. The sequences of V and J family mRNAs of the β chain V area were analyzed and databases were created for all 30 V family and J family genes. Using the Basic Local Alignment Search Tool, 15 genes were identified to be upregulated in the samples following treatment. Among them, the expression of T cell receptor β variable 28 (TRBV28)_T cell receptor β joining 1–5 (TRBJ1.5) and TRBV6_TRBJ2.10 were significantly different in the treated samples compared with samples taken prior to treatment. Genomic recombination patterns of TRBV and TRBJ of the β chain V area were observed to be different in the samples following treatment. The data of the current study demonstrated that the genomic rearrangement of the V and J segments of TCR β chain V area may be associated with the chronic progression of HBV and impact on treatment efficacy.
Keywords: chronic hepatitis B, cytotoxic T cells, high-throughput sequencing, T cell receptor, immune response
Introduction
Chronic hepatitis B is global public health issue. Approximately 2 billion people worldwide have been infected with the hepatitis B virus (HBV). Among them, more than 350 million people have experienced chronic infections (1,2). According to the World Health Organization reports, over one million patients with chronic HBV die of liver failure, liver cirrhosis or hepatocellular carcinoma (3). There is a high rate of chronic HBV infection in China; it is estimated that there are over 120 million people carrying the HBsAg antigen and 20 million with chronic hepatitis B. Among them, there are almost 0.3 million mortalities as a consequence of chronic HBV infection each year in China (4).
The efficacy of antiviral treatment of patients with chronic hepatitis B is affected by the virus itself and host factors. Among host factors, host immune cells are important in liver damage and the scavenging of invading viral cells. The immune status of patients is one of the important factors impacting the therapeutic response of patients to antiviral treatment. During acute HBV infection, episodes of which are usually self-limited, the cellular immune response against HBV is relatively strong. However, in patients that become chronically infected, the T cell response is much weaker (5). Previous reports have indicated that the function of T cells in chronic HBV infection is impaired and T cell dysfunction in the host has been considered as the root cause of chronic HBV infection (6,7).
It has been well-established that the host immune response triggered by viral infection causes the liver damage experienced by patients with chronic hepatitis B (8). However, the current therapeutic strategies of chronic hepatitis B treatment, including hepatoprotective drugs, and anti-viral and immune modulation therapy, fail to completely eradicate HBV, even when treatments are administered from an early stage. During the course of the immune response to HBV, the specific cytotoxic T cells (CTL) determine the outcome of the disease and are important in clearing the virus. The T cell receptor (TCR) determines the CTL specificity and is the feature of individual T cells. In peripheral blood, the TCR in 95% T cells is composed of two different protein chains, α and β chains (9). Additionally, these cells actively participate in the specific immune response of the host against the invading virus. Each chain is composed of two extracellular domains: The variable (V) and constant (C) regions (10). The TCR α-chain and β-chain have complementarity determining regions, which can recognize the major histocompatibility complex of viruses (11).
The diversity of TCRs in individual patients may be important for the clinical outcomes of patients with HBV infection (12,13). Thus, investigating the composition of TCR α and β chains may further the understanding of the pathogenesis and improve treatment strategies for HBV infection. In humans, the genes which code for the α and β chains can be divided into several regions according to the corresponding areas of the α and β chain proteins, including the V, D, J and C regions. The heterodimerical TCRs are highly diverse as a result of genomic rearrangement of the V, D, J and C region segments of each T cell (14). Although the genomic rearrangement of these regions of TCRs in T cells has been investigated during the past decade using high-throughput sequencing (15,16), the effect of different treatments on the genomic rearrangement of TCRs in patients with HBV remains to be examined. In response to an effective treatment strategy, the TCR gene may be adjusted to exert polymorphic expression of certain genes in the β chain.
In the present study, peripheral blood lymphocytes were isolated from patients with chronic hepatitis B prior and subsequent to treatment, and the β chain V region gene diversity was analyzed using high-throughput sequencing. The current study also aimed to elucidate the gene patterns that may be closely associated with specific mechanisms of cellular immune response to the treatment in individual patients with HBV. Several genes with abnormal expression levels were identified in the V and J segments of the CD8+ T cell TCR of patients with chronic HBV infection. These genomic abnormalities may be important during the pathogenesis of HBV infection and progression of the chronic stage. Furthermore, by comparing the expression profiles in patients with or without routine treatment, the results of the current study suggested that two gene variants, T cell receptor β variable 28 (TRBV28)_T cell receptor β joining 1–5 (TRBJ1.5) and TRBV6_TRBJ2.1, in addition to their corresponding segments in the TCR of CD8+ T cells, may be important sites whereby T cells can be regulated and induced to eliminate the invading virus. The expression levels of these genes were significantly altered following treatment. The results of the present study may provide evidence to demonstrate that the plasticity of the β chain V region is an essential feature of the host immune response to virus invasion and may provide insight into novel treatment strategies for patients with HBV.
Materials and methods
Patients
The current study was conducted at the Beijing You'an Hospital, Capital Medical University (Beijing, China). Between March 2010 and December 2013, a total of 4 patients who had been diagnosed with chronic hepatitis B and HBeAg+ were enrolled. Routine treatment with nucleotide similitudes, interferon and immunomodulators was administrated to all enrolled patients. All procedures were performed in accordance with the guidelines set by the Declaration of Helsinki and approved by the Clinical and Animal Research Ethnic Committees of Capital Medical University (Beijing, China). All participating individuals provided written informed consent.
Inclusion criteria
All patients enrolled in the present study were required to meet the following criteria: History of hepatitis B or persistent HBsAg+ >6 months; copies of HBV-DNA ≥1×10⁵/ml; HBeAg+; anti-HBe−; abnormal alanine aminotransferase, aspartate aminotransferase or γ-glutamyltransferase; liver abnormality not caused by another medical issue; Knodell histology activity index ≥4 on histology; fibrosis ≥S2; and necrosis ≥G2.
Exclusion criteria
The exclusion criteria for the candidates in the current study were as follows: Co-infection with other viruses, including hepatitis C or D virus, Epstein-Barr virus, cytomegalovirus and human immunodeficiency virus; cancer diagnosis; other liver diseases, including alcoholic hepatitis, nonalcoholic fatty liver disease, drug-induced hepatitis and autoimmune hepatitis; previous incidence of antiviral treatment; recent steroid and immunosuppressant treatment; and intolerance to antivirus treatment.
Peripheral blood mononuclear cell (PBMC) isolation
PBMCs were separated according to the previous reported procedure with minor modifications (17). Briefly, 5 ml venous blood was collected from each patient following fasting and then mixed at a ratio of 1:1 (vol/vol) with phosphate-buffered saline (PBS) at room temperature. Subsequently, 2 ml Lymphocyte Separation Medium (Corning Incorporated, Corning, NY, USA) was added to the mixture and centrifuged at room temperature at 600 × g for 20 min. The PBMCs were carefully aspirated (between the layers of plasma and Lymphocyte Separation Medium) and transferred to a separate tube. The pellets were washed twice with 5 ml Roswell Park Memorial Institute 1640 medium (Thermo Fisher Scientific, Inc., Waltham, MA, USA) and then centrifuged following each wash at 400 × g for 10 min. All samples were stored at −80°C prior to use during experiments.
Reverse transcription-quantitative polymerase chain reaction (RT-qPCR) amplification of the TCR β chain V area
The isolated PBMCs were washed three times with ice-cold PBS then 1 ml TRIzol reagent (Invitrogen; Thermo Fisher Scientific, Inc.) was added to extract the total RNA according to the manufacturer's instructions. An Oligotex kit (Qiagen, Inc., Valencia, CA, USA) was used to purify the mRNA from total RNA according to the manufacturer's protocol. The purified mRNA was converted to cDNA using SuperScript III Reverse Transcriptase, DNase, buffers and dNTPs (all from Thermal Fisher Scientific, Inc.). A degenerated V region primer (5′-GCIITKTIYTGGTAYMGACA-3′), which was designed to cover the majority of the TRBV genes, and a reverse primer (5′-GCACCTCCTTCCCATTCAC-3′) covering both TRBC genes was used as previously reported (18,19). Each 50 µl RT-qPCR reaction contained 2 µl cDNA, 12 µl ddH2O, 25 µl Premix Ex Taq (Takara Bio, Inc., Otsu, Japan), 1 µl forward primer, 1 µl reverse primer. The RT-qPCR cycling conditions were used as follows: 94°C for 10 min; 40 cycles of 94°C for 30 sec, 50°C for 30 sec, and 72°C for 30 sec; and a final 10 min extension at 72°C and 4°C hold for 30 sec. The PCR reaction was performed using an ABI 7500 Real-Time PCR System (Thermo Fisher Scientific, Inc.).
High-throughput sequencing analysis of PCR products
PCR products (5 µl) were run on 1% agarose gels pre-dyed with ethidium bromide (Sigma-Aldrich, St. Louis, MO, USA) and purified using the QIAquick PCR Purification kit (Qiagen, Inc.). Sequencing reactions and high-throughput sequencing were performed using purified PCR products and the Ion PGM System for Next-Generation Sequencing according to the manufacturer's instructions (Thermo Fisher Scientific, Inc.).
Bioinformatics
DNA sequences were produced from each patient corresponding to the samples provided prior and subsequent to treatment. All sequences were analyzed by CLC Genomics Workbench software, version 7.5 (Qiagen, Inc.) and compared with TRBV and TRBJ sequences from the International ImMunoGeneTics database (www.imgt.org). The sequence differences for each patient from the samples with or without treatment were analyzed and the changes in the V and J areas that were common in all patients were identified.
Results
Quality of PCR products
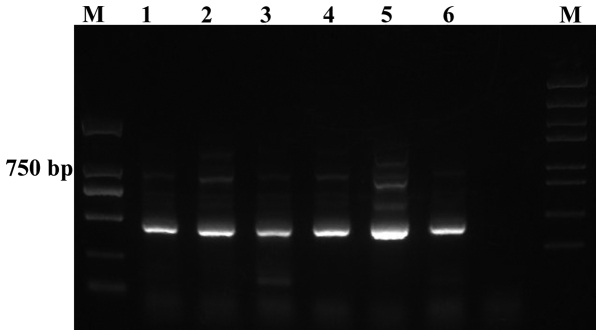
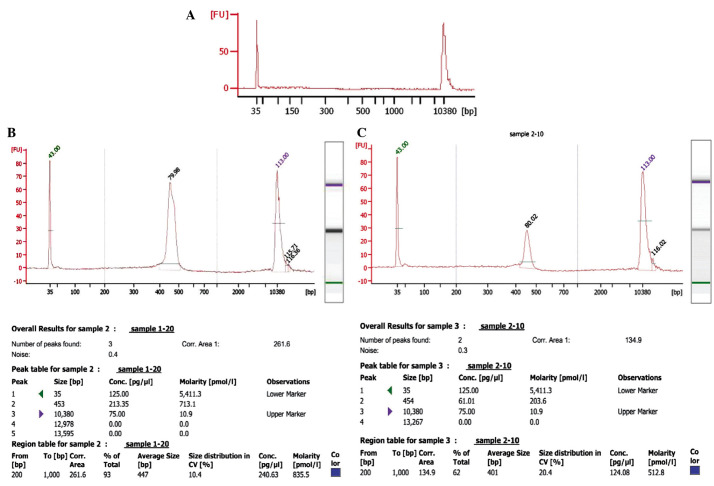
The quality of the amplified PCR products was tested by running on an agarose gel, which demonstrated clear bands with 400–500 bp size (Fig. 1). Agilent 2100 Bioanalyzer System (Agilent Technologies, Inc., Santa Clara, CA, USA) was used to determine the quality of the PCR products from the patient samples prior and subsequent to treatment. Representative data of the samples from one patient (prior and subsequent to treatment) is presented in Fig. 2. As demonstrated, the peak value of the sample prior to treatment was on 454 bp, whereas following treatment while the one of sample after treatment was on the 453 bp. The data was further analyzed using a mimic diagram to demonstrate the sizes of the bands with using the Agilent 2100 Bioanalyzer system (Fig. 3). The results from Agilent 2100 analysis were consistent with the results demonstrated in Fig. 1.
Figure 1.
Ethidium bromide stained 1% agarose gel of representative polymerase chain reaction products. Lanes 1, 3 and 5, pre-treatment samples; lanes 2, 4 and 6, post-treatments samples; lanes 1 and 2, patient 1; lanes 3 and 4, patient 2; lanes 5 and 6, patient 3.
Figure 2.
Agilent 2100 Bioanalyzer system analyzed data from samples of one patient (prior and subsequent to treatment). (A) Blank control. Size distribution was measured and polymerase chain reaction product quality was tested with Agilent 2100 Bioanalyzer analysis (B) prior to and (C) following treatment.
Figure 3.
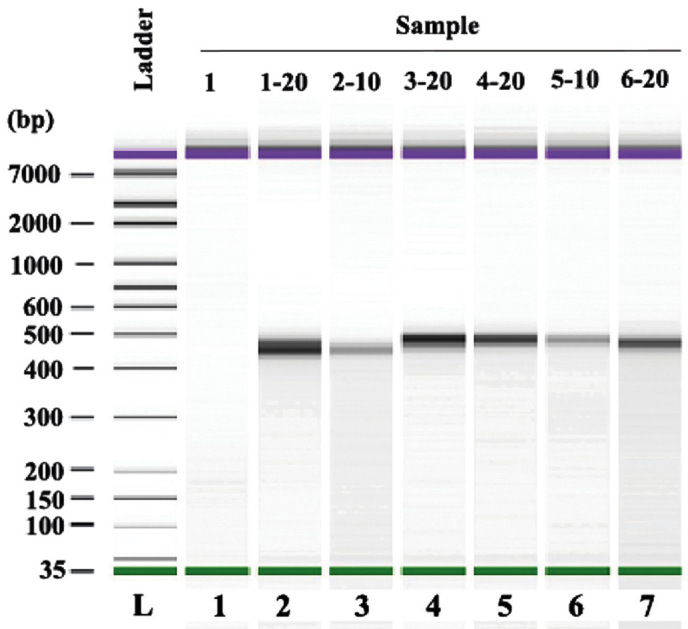
Mimic diagram of size distribution of polymerase chain reaction products with Agilent 2100 Bioanalyzer system analysis.
Sequence analysis of PCR products
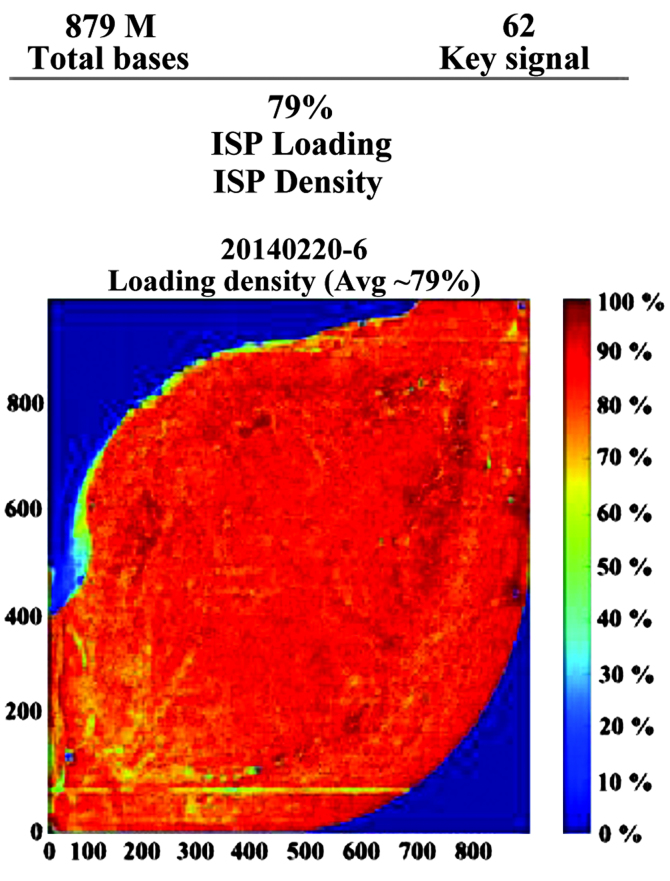
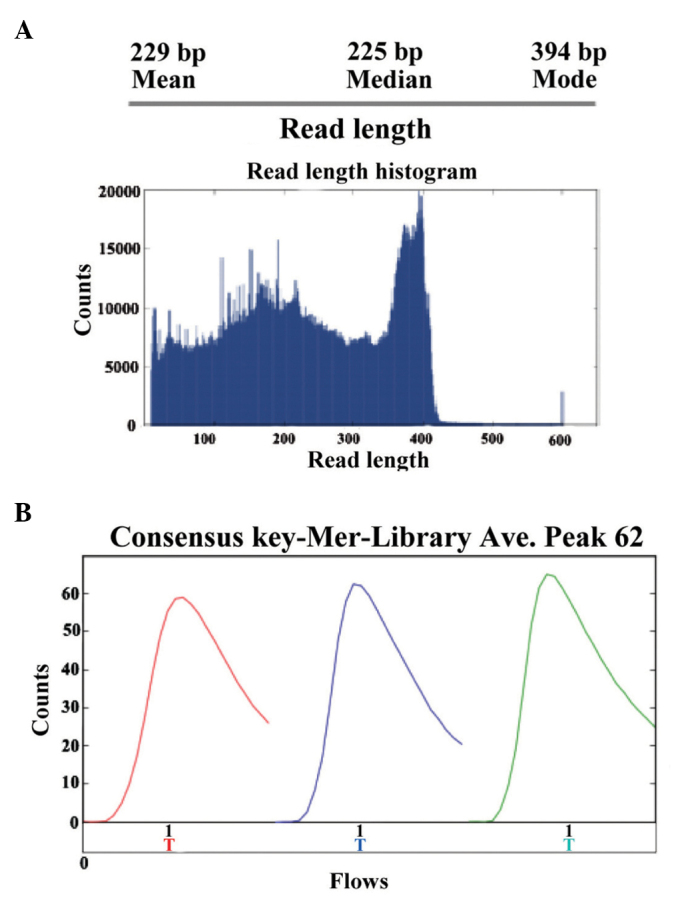
The present study performed high-throughput sequencing to analyze the genomic expression patterns of samples in patients prior and subsequent to treatment for HBV. Ion sphere particle (ISP) identification summaries of representative samples are presented in Fig. 4 and Table I. In total, 3,829,994 reads were identified and a relatively stronger red color suggested the relative stable sequencing process. In a further library summary, the average size of all reads was 225 bp (Fig. 5 and Table II). The differential genomic expression of TCR β chains is presented in Table III. By comparing the expression profile in the samples prior and subsequent to treatment, the results of the present study demonstrated there to be markedly differential expression of the following TCR recombinations: TRBV10_TRBJ2.1; TRBV10_TRBJ2.2; TRBV10_TRBJ2.7; TRBV12_TRBJ1.1; TRBV27_TRBJ2.2; TRBV28_TRBJ1.5; and TRBV6_TRBJ2. Among them, TRBV28_TRBJ1.5 and TRBV6_TRBJ2.1 were markedly different.
Figure 4.
High-throughput sequencing of polymerase chain reaction products. (A) Representative summaries of ISP identification of ceratin samples. (B) Representative picture of ISP density. ISP, ion sphere particle.
Table I.
ISP identification summaries of representative samples.
| A, Addressable wells (n= 11,304,141) |
Count | Percentage |
|---|---|---|
| With ISPs | 8,917,942 | 78.9% |
| Live | 8,867,906 | 99.4% |
| Test fragment | 20,441 | 9.2% |
| Library | 8,847,465 | 99.8% |
|
| ||
| B, Library ISPs (n= 8,847,465) |
Count | Percentage |
|
| ||
| Filtered: Polyclonal | 2,634,948 | 29.8% |
| Filtered: Low quality | 2,380,081 | 26.9% |
| Filtered: Primer dimer | 2,442 | 00.0% |
| Final Library ISPs | 3,829,994 | 43.3% |
ISP, ion sphere particle.
Figure 5.
Library summary the sequencing of polymerase chain reaction products.
Table II.
Barcode of loading samples from patients.
| Barcode | Sample | Bases (bp) | ≥Q20 | Reads | Mean read length |
|---|---|---|---|---|---|
| No barcode | None | 12,567,420 | 9,050,676 | 90,123 | 139 |
| IonXpress.017 | None | 135,103,823 | 113,524,381 | 526,527 | 256 |
| IonXpress.019 | None | 127,371,212 | 109,752,867 | 568,263 | 224 |
| IonXpress.021 | None | 159,903,935 | 133,142,164 | 685,596 | 233 |
| IonXpress.023 | None | 166,661,460 | 141,148,845 | 727,848 | 228 |
| IonXpress.025 | None | 133,847,320 | 113,599,121 | 618,022 | 216 |
| IonXpress.027 | None | 143,665,632 | 122,754,662 | 607,994 | 236 |
Table III.
Representative upregulated genes in TCR β chain (V and J area) after routine treatment.
| TRBJ | TRBV
|
|||||||||||
|---|---|---|---|---|---|---|---|---|---|---|---|---|
| 10-1-01 | 10-3-01 | 12-4-01 | 19-01 | 27-01 | 28-01 | 6-3-01 | 6-4-01 | 6-5-01 | 6-6-01 | 7-2-01 | 7-8-01 | |
| 1-1 | 14.0562 | 63.6778 | 164.0466 | 70.7131 | 73.7088 | 41.2304 | 40.7399 | −0.2857 | 10.4917 | 27.2504 | 47.9113 | 1.0774 |
| 1-2 | 0.0923 | 35.6464 | 164.7710 | 84.8584 | 37.2387 | 120.0921 | 21.6486 | 3.9117 | 13.5238 | 21.6501 | 39.5857 | 0.0654 |
| 1-3 | −0.0032 | 7.7549 | 14.4925 | −4.6894 | 1.6685 | 4.2581 | 4.2526 | 0.3093 | −0.0709 | 7.1806 | 13.8860 | 0.1899 |
| 1-4 | 0.6782 | −6.8893 | 29.5795 | 6.0467 | 10.4934 | −1.8589 | 0.6628 | 0.4673 | 14.6283 | 6.6969 | 11.8412 | 0.3314 |
| 1-5 | −24.7328 | 26.0093 | 30.1689 | −112.0634 | 52.4666 | 90.3730 | −67.7313 | 7.4276 | 5.2049 | 23.2271 | 160.5450 | 1.3626 |
| 1-6 | 0.6701 | −2.6944 | 22.4786 | 29.6578 | −3.7970 | −72.7041 | 4.4369 | −17.3607 | 15.0942 | 14.3288 | 25.8857 | 2.9350 |
| 2-1 | 16.7451 | 73.6994 | 172.5381 | 395.2790 | −32.2191 | 61.0448 | 90.3862 | 53.8860 | 11.8641 | 59.1640 | 152.8131 | 0.6849 |
| 2-2 | −7.2258 | 40.9557 | 93.3107 | −190.8478 | 38.6384 | −53.9616 | 34.6702 | −28.1767 | 16.8347 | 23.5272 | 38.9658 | 0.4695 |
| 2-2P | 0.0000 | 0.0000 | 0.0000 | 0.0000 | 0.0000 | 0.0000 | 0.0000 | 0.0000 | 0.0000 | 0.0000 | 0.0000 | 0.0000 |
| 2-3 | 7.9254 | 124.7426 | 210.6778 | −146.9102 | −580.9940 | 201.5457 | 48.9872 | −19.2801 | 9.9758 | 32.9447 | 139.6743 | −0.4528 |
| 2-4 | 6.2481 | −1.7408 | 14.5234 | 20.8885 | −13.7698 | −19.9982 | 3.1636 | −1.9191 | 3.3963 | 1.5966 | −12.1429 | −0.0665 |
| 2-5 | 4.0523 | 26.6260 | 63.1694 | 28.1325 | −0.3912 | 81.8239 | 38.3662 | 17.3466 | 6.8584 | 20.2083 | 49.4611 | −0.2882 |
| 2-6 | 0.0000 | 28.3354 | 28.9562 | −104.5056 | 11.1357 | 65.0562 | 13.9030 | −1.3684 | 1.3235 | 9.2550 | 9.5562 | 0.0851 |
TCR, T cell receptor; TRBV, TCR β chain variable area; TRBJ, TCR β chain joining area.
Discussion
Chronic HBV infections are highly prevalent and create a substantial burden to healthcare systems (20). HBV infection is a major cause of morbidity and mortality worldwide, particularly in developing countries (21).
The natural process of HBV infection is determined by the interaction between virus replication and the host immune response. Host immune responses are important for the successful elimination of viruses (22). T cell immune responses are central for determining the clinical outcome of infection (19). It is well-established that there is a significant correlation between the strength of the T cell response and virus clearance (23). A previous study also suggested that investigating variable gene expression patterns of TCR may provide important information regarding the host immune response against invading HBV (24). However, little is understood regarding whether genomic rearrangement of TCR occurs in response to treatment of the host infected with HBV. As T cell dysfunction may be an important cause of the chronic deterioration in HBV patients, the present study hypothesized that effective routine treatment may regulate the TCR expression profiles by regulating genomic rearrangement. High-throughput sequencing technology is widely used in biology and medicine to investigate important biological questions in rare diseases. Single-cell sequencing is also used in cancer research (25). With the advent of next-generation-sequencing technologies, it has now become feasible to directly sequence a numerous TCR β chains in parallel. The current study used Ion Torrent high-throughput sequencing technology to investigate the effect of treatment for chronic hepatitis B on the TCR β chain V region genomic recombination pattern. The present study aimed to provide evidence to further understand the host immune mechanisms in patients infected with HBV and how treatment influences the outcome of HBV infection. In total, 3,829,994 reads were sequenced and analyzed. The sizes of the majority of the sequence PCR products were 100–400 bp. Furthermore, the results of the current study demonstrated that the ratio for library reads is 43.3%. These results are consistent with the recognized advantages of high-throughput and higher quality next-generation-sequencing technology. By comparing the expression profile in TCR β chains of patients prior and subsequent to treatment, to the best of our knowledge, the present study is the first to demonstrate alterations to several genes at the V and J regions following treatment for HBV. Only TRBV28_TRBJ1.5 and TRBV6_TRBJ2.1 were significantly different following treatment compared with the samples from the same patient prior to treatment. TRBV families, including TRBV28 and TRBV6, have been previously demonstrated to be important in abnormal immune responses of T cells in certain diseases, including psoriasis (26) and myasthenia gravis (27). The observations of the current study provide useful evidence demonstrating that these genes are closely involved in the response of TCR to HBV in patients.
In summary, the present study demonstrated rapid, high-throughput analysis of the expression TCR-β chain genomic recombinants. The results of the current study may support future research into the T cell response in patients with HBV.
Acknowledgments
The current study was partially supported by the National Natural Science Foundation of China (grant no. 81400901).
References
- 1.Hollinger FB, Liang TJ. Hepatitis B Virus. In: Knipe DM, Howley PM, Griffin DE, et al., editors. Fields Virology. 4th edition. Lippincott Williams & Wilkins; Philadelphia: 2001. pp. 2971–3036. [Google Scholar]
- 2.Chisari FV, Ferrari C. Viral Hepatitis. In: Nathanson N, Ahmed R, Gonzales-Scarano F, Griffin DE, Holmes KV, Murphy FA, Robinson HL, editors. Viral Pathogenesis. Lippincott - Raven; Philadelphia: 1997. pp. 745–778. [Google Scholar]
- 3.World Health Organization . Introduction of hepatitis B vaccine into childhood immunization services. WHO; Geneva: 2001. [Google Scholar]
- 4.Liang X, Bi S, Yang W, Wang L, Cui G, Cui F, Zhang Y, Liu J, Gong X, Chen Y, et al. Epidemiological serosurvey of hepatitis B in China - declining HBV prevalence due to hepatitis B vaccination. Vaccine. 2009;27:6550–6557. doi: 10.1016/j.vaccine.2009.08.048. [DOI] [PubMed] [Google Scholar]
- 5.Stoop JN, van der Laan LJ, Kuipers EJ, Kusters JG, Janssen HL. Regulatory s contribute to the impaired immune response in patients with chronic hepatitis B virus infection. Hepatology. 2005;41:771–778. doi: 10.1002/hep.20649. [DOI] [PubMed] [Google Scholar]
- 6.Boni C, Fisicaro P, Valdatta C, Amadei B, Di Vincenzo P, Giuberti T, Laccabue D, Zerbini A, Cavalli A, Missale G, et al. Characterization of hepatitis B virus (HBV)-specific T-cell dysfunction in chronic HBV infection. J Virol. 2007;81:4215–4225. doi: 10.1128/JVI.02844-06. [DOI] [PMC free article] [PubMed] [Google Scholar]
- 7.Sobao Y, Tomiyama H, Sugi K, Tokunaga M, Ueno T, Saito S, Fujiyama S, Morimoto M, Tanaka K, Takiguchi M. The role of hepatitis B virus-specific memory CD8 T cells in the control of viral replication. J Hepatol. 2002;36:105–115. doi: 10.1016/S0168-8278(01)00264-1. [DOI] [PubMed] [Google Scholar]
- 8.Busca A, Kumar A. Innate immune responses in hepatitis B virus (HBV) infection. Virol J. 2014;11:22. doi: 10.1186/1743-422X-11-22. [DOI] [PMC free article] [PubMed] [Google Scholar]
- 9.Kimura N, Toyonaga B, Yoshikai Y, Du RP, Mak TW. Sequences and repertoire of the human T cell receptor alpha and beta chain variable region genes in thymocytes. Eur J Immunol. 1987;17:375–383. doi: 10.1002/eji.1830170312. [DOI] [PubMed] [Google Scholar]
- 10.Janeway CA, Jr, Travers P, Walport M, Shlomchik MJ. Immunobiology: The Immune System In Health and Disease. 5th edition. Garland Science; New York, NY: 2001. [Google Scholar]
- 11.Marrack P, Scott-Browne JP, Dai S, Gapin L, Kappler JW. Evolutionarily conserved amino acids that control TCR-MHC interaction. Annu Rev Immunol. 2008;26:171–203. doi: 10.1146/annurev.immunol.26.021607.090421. [DOI] [PMC free article] [PubMed] [Google Scholar]
- 12.Xiong Y, Tan Y, Song YG. Analysis of T cell receptor Vβ diversity in peripheral CD4+ and CD8+ T lymphocytes obtained from patients with chronic severe hepatitis B. Hepat Mon. 2014;14:e15900. doi: 10.5812/hepatmon.15900. [DOI] [PMC free article] [PubMed] [Google Scholar]
- 13.Yang J, Chen J, He J, Xie Y, Zhu Y, Cao H, Li L. Profiling the repertoire of T-cell receptor beta-chain variable genes in peripheral blood lymphocytes from subjects who have recovered from acute hepatitis B virus infection. Cell Mol Immunol. 2014;11:332–342. doi: 10.1038/cmi.2014.22. [DOI] [PMC free article] [PubMed] [Google Scholar]
- 14.Davis MM, Boniface JJ, Reich Z, Lyons D, Hampl J, Arden B, Chien Y. Ligand recognition by alpha beta T cell receptors. Annu Rev Immunol. 1998;16:523–544. doi: 10.1146/annurev.immunol.16.1.523. [DOI] [PubMed] [Google Scholar]
- 15.Welsh RM, Selin LK, Szomolanyi-Tsuda E. Immunological memory to viral infections. Annu Rev Immunol. 2004;22:711–743. doi: 10.1146/annurev.immunol.22.012703.104527. [DOI] [PubMed] [Google Scholar]
- 16.Lanzavecchia A, Sallusto F. Antigen decoding by T lymphocytes: From synapses to fate determination. Nat Immunol. 2001;2:487–492. doi: 10.1038/88678. [DOI] [PubMed] [Google Scholar]
- 17.Mylona EE, Mouktaroudi M, Crisan TO, Mylona EE, Mouk-taroudi M, Crisan TO, Makri S, Pistiki A, Georgitsi M, Savva A, Netea MG, van der Meer JW, Giamarellos-Bourboulis EJ, Joosten LA. Enhanced interleukin-1β production of PBMCs from patients with gout after stimulation with Toll-like receptor-2 ligands and urate crystals. Arthritis Res Ther. 2012;14:R158. doi: 10.1186/ar3898. [DOI] [PMC free article] [PubMed] [Google Scholar]
- 18.Krell PF, Reuther S, Fischer U, Keller T, Weber S, Gombert M, Schuster FR, Asang C, Stepensky P, Strahm B, et al. Next-generation-sequencing-spectratyping reveals public T-cell receptor repertoires in pediatric very severe aplastic anemia and identifies a β chain CDR3 sequence associated with hepatitis-induced pathogenesis. Haematologica. 2013;98:1388–1396. doi: 10.3324/haematol.2012.069708. [DOI] [PMC free article] [PubMed] [Google Scholar]
- 19.Zhou D, Srivastava R, Grummel V, Cepok S, Hartung HP, Hemmer B. High throughput analysis of TCR-beta rearrangement and gene expression in single T cells. Lab Invest. 2006;86:314–321. doi: 10.1038/labinvest.3700381. [DOI] [PubMed] [Google Scholar]
- 20.El-Shabrawi M, Hassanin F. Treatment of hepatitis B and C in children. Minerva Pediatr. 2014;66:473–489. [PubMed] [Google Scholar]
- 21.Chatterjee R, Mitra A. An overview of effective therapies and recent advances in biomarkers for chronic liver diseases and associated liver cancer. Int Immunopharmacol. 2015;24:335–345. doi: 10.1016/j.intimp.2014.12.024. [DOI] [PubMed] [Google Scholar]
- 22.Freeman AJ, Marinos G, Ffrench RA, Lloyd AR. Immunopathogenesis of hepatitis C virus infection. Immunol Cell Biol. 2001;79:515–536. doi: 10.1046/j.1440-1711.2001.01036.x. [DOI] [PubMed] [Google Scholar]
- 23.Bauer T, Sprinzl M, Protzer U. Immune control of hepatitis B virus. Dig Dis. 2011;29:423–433. doi: 10.1159/000329809. [DOI] [PubMed] [Google Scholar]
- 24.Soroosh P, Shokri F, Azizi M, Jeddi-Tehrani M. Analysis of T-cell receptor beta chain variable gene segment usage in healthy adult responders and nonresponders to recombinant hepatitis B vaccine. Scand J Immunol. 2003;57:423–431. doi: 10.1046/j.1365-3083.2003.01256.x. [DOI] [PubMed] [Google Scholar]
- 25.Soon WW, Hariharan M, Snyder MP. High-throughput sequencing for biology and medicine. Mol Syst Biol. 2013;9:640. doi: 10.1038/msb.2012.61. [DOI] [PMC free article] [PubMed] [Google Scholar]
- 26.Yin G, Li X, Li J, Cui H, Hou R, Zhang J, Dong F, Liang H, Zhang K. Screening of differentially expressed genes and predominant expression of β variable region of T cell receptor in peripheral T cells of psoriatic patients. Eur J Dermatol. 2011;21:938–944. doi: 10.1684/ejd.2011.1551. [DOI] [PubMed] [Google Scholar]
- 27.Marino M, Maiuri MT, Di Sante G, Scuderi F, La Carpia F, Trakas N, Provenzano C, Zisimopoulou P, Ria F, Tzartos SJ, et al. T cell repertoire in DQ5-positive MuSK-positive myasthenia gravis patients. J Autoimmun. 2014;52:113–121. doi: 10.1016/j.jaut.2013.12.007. [DOI] [PubMed] [Google Scholar]


