Abstract
Background
Current blood banking procedures may not fully preserve red blood cell (RBC) function during storage, contributing to the decrease of RBC oxygen release ability. This study was undertaken to evaluate the impact of routine cold storage on RBC oxygen release ability.
Materials and methods
RBC units were collected from healthy donors and each unit was split into two parts (whole blood and suspended RBC) to exclude possible donor variability. Oxygen dissociation measurements were performed on blood units stored at 4 °C during a 5-week period. 2,3-diphosphoglycerate levels and fluorescent micrographs of erythrocyte band 3 were also analysed.
Results
P50 and oxygen release capacity decreased rapidly during the first 3 weeks, and then did not change significantly. In contrast, the kinetic properties (PO2-t curve and T*50) of oxygen release changed slowly during the first 3 weeks of storage, but then decreased significantly in the last 2 weeks. 2,3-diphosphoglycerate decreased quickly during the first 3 weeks of storage to almost undetectable levels. Band 3 aggregated significantly during the last 2 weeks of storage.
Discussion
RBC oxygen release ability appears to be sensitive to routine cold storage. The thermodynamic characteristics of RBC oxygen release ability changed mainly in the first 3 weeks of storage, due to the decrease of 2,3-diphosphoglycerate, whereas the kinetic characteristics of RBC oxygen release ability decreased significantly at the end of storage, probably affected by alterations of band 3.
Keywords: blood storage, red blood cells, oxygen release ability, kinetics
Introduction
Red blood cells (RBC) are considered ideal vehicles for delivering oxygen to tissues, but their properties and functions change during routine cold storage. Several studies suggest that RBC transfusions are associated with higher risks of morbidity and mortality and that the storage time of transfused blood is an independent risk factor for post-injury multiple organ failure1,2. RBC undergo a series of functional and structural changes during routine cold storage, which affect the quality of the blood and outcomes of clinical transfusion. Alterations in the rheological properties of RBC affect oxygen delivery in vivo. Reduced deformability results in impaired perfusion and oxygen delivery in peripheral tissues, and particularly rigid RBC might block capillaries directly3–5.
The main purpose of RBC transfusion is to improve oxygenation. It is, therefore, very important to determine the oxygen release ability of stored RBC in vitro and to evaluate the impact of routine cold storage on RBC oxygen release ability. Typically, the oxygen release ability of stored RBC is characterised by oxygen affinity (P50), which can be determined by an oxygen dissociation curve in a thermodynamic equilibrium process6–9. It has long been known that the haemoglobin (Hb) oxygen affinity of banked RBC increases during liquid storage at 4 °C, which may be an explanation for the decreased ability of stored RBC to release oxygen10.
Since 2,3-diphosphoglycerate (2,3-DPG) has been reported to bind with Hb specifically and reduce its oxygen affinity11,12, studies regarding the decrease in oxygen release ability of stored RBC have been focused mostly on intracellular 2,3-DPG levels13. In fact, 2,3-DPG decreases quickly during the first 3 weeks of storage to almost undetectable levels, as common additive solutions for RBC do not maintain constant 2,3-DPG levels. Following in vivo transfusion, 2,3-DPG levels start to recover within several hours, but may take up to 72 hours to become almost normal14. For this reason, preventing or reversing the decrease of 2,3-DPG during storage was identified as an important point for maintaining oxygen release function of stored RBC. Various attempts have been made to maintain high 2,3-DPG levels during storage15–19. In the 1990s, Meryman and Hornblower20 described “chloride shift” as a method to keep 2,3-DPG levels high by replacing extracellular chloride with an anion unable to permeate the RBC. Recently, Burger et al.21 reported an improved additive solution, phosphate-adenine-glucose-guanosine-gluconate-mannitol (PAGGGM), which maintains 2,3-DPG levels by an enhancing effect on phosphofructokinase activity during cold storage.
Almost all in vitro data indicated that 2,3-DPG levels of stored RBC were very important for the oxygen release function of the cells. However, this concept was not supported by the clinical consequences of transfusing RBC units completely depleted of 2,3-DPG22. An experimental study23 showed that when RBC were stored for 2–3 weeks and were completely devoid of 2,3-DPG, their oxygen release capacity to the intestinal microcirculation in an oxygen-supply-dependent isovolaemic exchange model did not differ from that of “fresh” RBC (2–6 days old). The oxygen release capacity of RBC stored for 5–6 weeks was reduced compared to that of fresh blood cells and RBC stored for an intermediate period. These studies suggest that RBC oxygen release ability is not comprehensively evaluated by only Hb oxygen affinity and 2,3-DPG levels. We, therefore, also used a kinetic analysis method to determine the oxygen release ability of stored RBC.
In this study, RBC units from ten healthy blood donors were investigated. Each unit was split into two parts (whole blood and suspended RBC) to exclude possible donor variability. Thermodynamic parameters, such as Hb oxygen affinity (P50) and oxygen release capacity of whole blood and suspended RBC, were determined at various intervals in RBC units stored at 4 °C for a 5-week period, to investigate the alteration of RBC oxygen release ability with storage time and the effect of banking procedures on RBC oxygen release ability. A parallel kinetic analysis was carried out and provided new information, from another perspective, on the oxygen release ability of RBC during storage. Other relevant characteristics, such as 2,3-DPG levels and erythrocyte band 3 (EB3) fluorescent micrographs, were also analysed.
Materials and methods
Preparation and sampling of red blood cell units
Standard units of blood (400±40 mL) were drawn from ten healthy volunteer donors (Chongqing Blood Centre, Chongqing, China), and collected into standard sterile bags containing 56 mL CPDA-1 solution (sodium citrate dihydrate, 26.30 g/L; citric acid monohydrate, 3.27 g/L; sodium dihydrogen phosphate dihydrate, 2.22 g/L; adenine, 0.275 g/L; glucose, 31.9 g/L). After collection, the blood was split into two aliquots. One aliquot was used as whole blood and the other was used to prepare suspended RBC as follows: after a cooling period of 2 hours at room temperature, the buffy coat was extracted by filtration. RBC were isolated by centrifugation for 5 minutes followed by removal of the plasma, and addition of 50 mL MAP solution (sodium citrate dihydrate, 1.5 g/L; citric acid monohydrate, 0.2 g/L; sodium dihydrogen phosphate dihydrate, 0.94 g/L; sodium chloride, 4.97 g/L; adenine, 0.14 g/L; glucose, 7.93 g/L; mannitol, 14.57 g/L; which is similar to SAGM and widely used in China) to the resting RBC. After preparation both the whole blood and the suspended RBC were stored under standard blood bank conditions at 2~6 °C for 5 weeks.
Samples (5 mL) were aseptically withdrawn weekly from the RBC units for analysis. The plasma (red cell suspension liquid) of testing samples was separated for biochemical analysis by centrifugation at 3,500 rpm (650 g) for 10 minutes. Isolated RBC were washed twice in phosphate-buffered saline (PBS, pH 7.4). After washing, RBC were re-suspended in PBS solution containing 1 g/L glucose and 0.25 g/L bovine albumin at a haematocrit of 10% and incubated at room temperature (20 °C) for 60 minutes to overcome the pH effect in the subsequent measurements of oxygen release ability.
Thermodynamic analysis of red blood cell oxygen release ability
The oxygen dissociation process and oxygen affinity were determined with a Hemox-Analyzer (TCS Scientific Corp, New Hope, PA, USA). After the measurements, RBC haemolysis was measured and the extent of RBC haemolysis controlled as <2% to demonstrate the reliability of the results.
In order to quantify RBC oxygen release ability, oxygen release capacity was calculated in this study and defined as the amount of oxygen delivered to tissues by 1g of Hb in a single circulation under normal physiological conditions and standard atmospheric pressure. Hamasaki et al.24 used a similar method to evaluate RBC oxygen release ability although they set the low point of Hb releasing oxygen as tissue oxygen tension (30 mmHg), whereas we chose the partial oxygen pressure in venous blood (40 mmHg) to get the average capacity of RBC to deliver oxygen to tissues by 1 g of Hb in a single circulation.
In order to determine oxygen releasing capacity in experimental conditions, RBC were re-suspended in PBS solution at 37 °C, giving a final haematocrit of 1%. Then high-oxygen mixed gas (78% nitrogen, 21% oxygen, 1% carbon dioxide) was introduced into the RBC suspension. Simultaneously, the partial oxygen pressure in the suspension was monitored by a Clark electrode. When the partial oxygen pressure reached 100 mmHg (the partial oxygen pressure in alveolar arterial blood), the Hb oxygen saturation was recorded as S1. Similarly, another oxygen saturation was recorded as S2 when the partial oxygen pressure in the RBC suspension was lowered to 40 mmHg (the partial oxygen pressure in venous blood) by introducing low-oxygen mixed gas (95% nitrogen, 5% carbon dioxide). The oxygen release capacity of blood units could then be calculated using the following equation:
where Q is the oxygen release capacity expressed as mL O2/gHb24.
Kinetic analysis of red blood cell oxygen release ability
In this study, the oxygen partial pressure changes of the RBC suspension (at a final haematocrit of 1%) over time were determined under conditions of constant ventilation speed (standard atmospheric pressure, 37 °C, gas flow rate 13 mL/min) and a PO2-t curve was drawn to evaluate RBC oxygen release ability. In order to draw the PO2-t curve the RBC suspension was saturated by aeration with high-oxygen mixed gas (78% nitrogen, 21% oxygen, 1% carbon dioxide) until the partial oxygen pressure reached 150.2 mmHg. Then low-oxygen mixed gas (95% nitrogen, 5% carbon dioxide) was introduced into the RBC suspension continuously until the partial oxygen pressure was <3 mmHg. The partial oxygen pressure and time were recorded during this process. After the measurements, RBC haemolysis was measured and the extent of RBC haemolysis was controlled at <2% to demonstrate the reliability of the results.
To get a deeper understanding of alterations in oxygen release ability of banked RBC, a parameter named T*50 was determined in this study. T*50 was defined as the time needed for RBC oxygen saturation to decrease from 100 to 50% under standard conditions. T*50 is associated with the total amount of RBC in solution, the properties of the RBC and the ventilation rate of experiments. If the amount of RBC, the ventilation rate, and the other conditions are fixed, the value of T*50 is suggested to be a property of the cells themselves.
Measurements of 2, 3-DPG levels
The concentration of 2,3-DPG was measured using a 2,3-DPG kit from Roche (Mannheim, Germany), as described elsewhere19. In brief, 600 μL RBC were diluted with 900 μL PBS (pH 7.4) and then acidified with 60 μL perchloric acid (70% wt/vol). After 20 minutes on ice, the extracts were centrifuged at 4 °C for 5 minutes at 6,000 g, and 56 μL K2CO3 (5 mol/L) were added to 1,000 μL protein-free supernatant for neutralisation.
Immunofluorescence and image analyses
Immunofluorescence and image analyses of EB3 were performed according to our previous report25. Briefly, RBC were permeabilised by 0.05% Triton X-100 and fixed with 4% paraformaldehyde and 0.05% glutaraldehyde in PBS. After being blocked with 3% bovine serum albumin and 0.1% Tween 20, cells were treated with primary antibodies (rabbit polyclonal to EB3; Abcam, Cambridge, UK) and secondary antibodies (anti-rabbit IgG; Santa Cruz Biotechnology, Santa Cruz, CA, USA), then washed three times in PBS. Fluorescence was imaged using an Olympus IX71 microscope (Olympus, Tokyo, Japan).
Statistical analysis
Data are presented as means±standard deviation (SD) and tested for statistical significance with the t-test. Differences are considered to be statistically significant when the P value is less than 0.05 (SPSS ver. 16.0; SPSS Inc., Chicago, IL, USA).
Results
Alteration of haemoglobin oxygen affinity (P50)
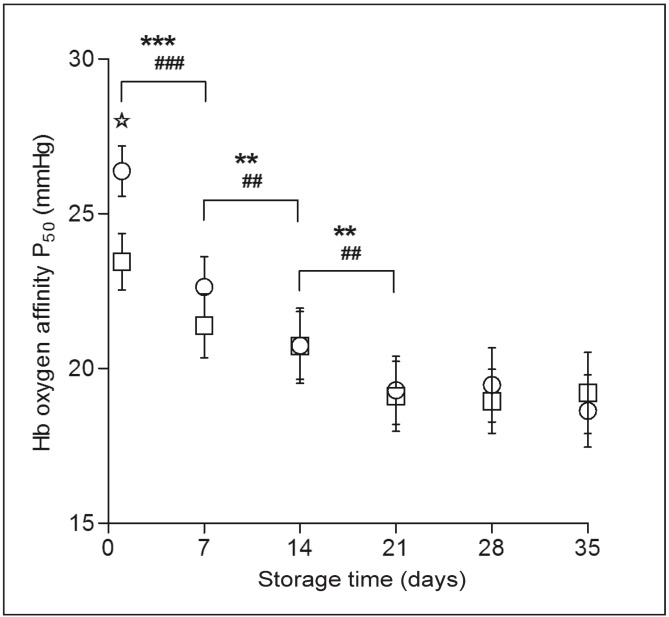
P50, as an indicator of Hb oxygen affinity, describes RBC oxygen release ability from the thermodynamic perspective. Figure 1 depicts the Hb oxygen affinity as represented by P50 at different periods of storage. Blood storage induced an increase in Hb oxygen affinity. P50 of whole blood and suspended RBC both decreased significantly (p<0.01) during the early period of storage (the first 3 weeks); thereafter, the reduction of P50 was not statistically significant. The P50 of suspended RBC was lower than that of whole blood in the first week of storage (p<0.01).
Figure 1.
Alteration of P50 during storage.
P50 of both whole blood (○) and suspended RBC (□) decreased significantly during the first 3 weeks, after which the reduction was not significant. The P50 of suspended RBC was lower than that of whole blood in the first week of storage. Results shown are the mean±SD of 10 units. Whole blood: **p<0.01; ***p<0.001. Suspended RBC: ##p<0.01; ###p<0.001. Whole blood vs suspended RBC: ✯ p<0.01.
Hb: haemoglobin; RBC: red blood cell.
Alteration of red blood cell oxygen release capacity during storage
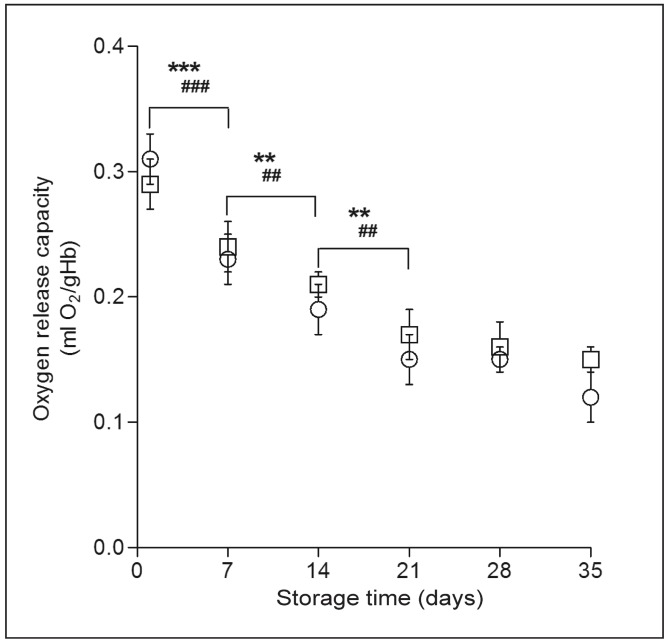
Intuitively, oxygen release capacity can reflect the quantitative changes of RBC oxygen release ability during the storage process. Figure 2 depicts RBC oxygen release capacity decreasing regularly with time. This parameter of whole blood was significantly reduced in the first 3 weeks of storage (p<0.01). In the following weeks RBC oxygen release capacity decreased slowly. At the end of cold storage (week 5), oxygen release capacity was reduced to 39% that of “fresh” whole blood. Similarly, the oxygen release capacity of suspended RBC decreased 42% in the first 3 weeks, and then the reduction over time was not significant. After 35 days of storage the suspended RBC retained 51% of their oxygen release capacity.
Figure 2.
Alteration of oxygen release capacity.
Oxygen release capacity of both whole blood (○) and suspended red blood cell (RBC) (□) decreased significantly during the first 3 weeks. Results shown are mean±SD of 10 units. Whole blood: **p<0.01; ***p<0.001. Suspended RBC: ##p<0.01; ###p<0.001.
Hb: haemoglobin; RBC: red blood cell; SD: standard deviation.
Alteration of the PO2-t curve during storage
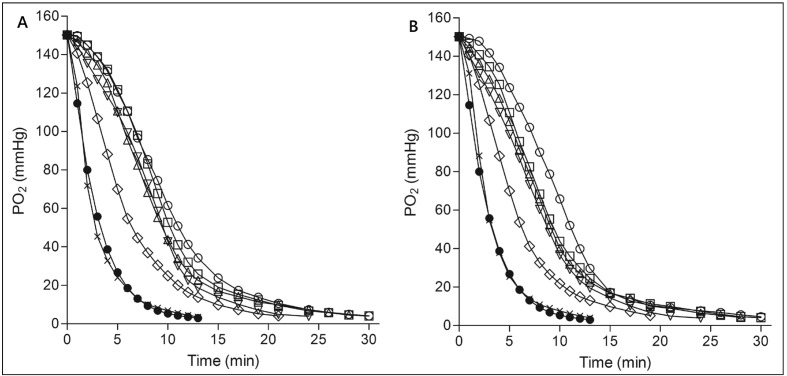
An alteration of the PO2-t curve provided direct data regarding the change of RBC oxygen release ability during cold storage from a kinetic perspective. Figure 3 depicts PO2-t curves for whole blood (Figure 3A) and suspended RBC (Figure 3B) at different times of storage. The PO2-t curves of both groups shift to the left as storage time increases. At the end of storage, the curves approached the PO2-t curve of PBS buffer. Unlike the alterations of RBC oxygen release capacity and Hb oxygen affinity, the PO2-t curve altered little in the first 3 weeks of storage, but changed significantly in the last 2 weeks.
Figure 3.
PO2-t curve of whole blood (A) and suspended RBC (B) at different storage times.
(●) PBS solution; (○) RBC at day 0 before storage; (□) RBC stored for 7 days; (△) RBC stored for 14 days; (▽) RBC stored for 21 days; (⋄) RBC stored for 28 days; (×) RBC stored for 35 days. Error bars are not shown to eliminate figure clutter.
Alteration of T*50
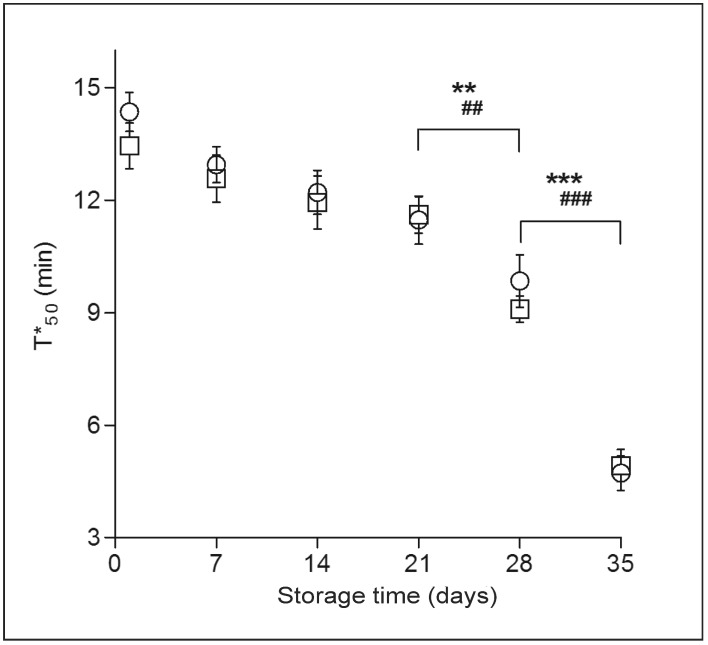
As a kinetic parameter, T*50 was determined by the properties of the RBC themselves in our experimental conditions (standard atmospheric pressure, 37 °C, gas flow rate 13 mL/min). During routine cold storage, the T*50 of whole blood group and suspended RBC decreased (Figure 4). T*50 decreased slowly during the first 3 weeks of storage and then more sharply in the last 2 weeks of storage (p<0.01, p<0.001). The T*50 value of normal human RBC was about 14.36 min in our standard experimental conditions.
Figure 4.
Alteration of the kinetic parameter T*50.
T*50 of whole blood (○) and suspended RBC (□) decreased slowly during the first 3 weeks, and then decreased sharply in the last 2 weeks of storage. Results are mean ± SD of 10 units. Whole blood: **p<0.01; ***p<0.001. Suspended RBC: ##p<0.01; ###p<0.001.
RBC: red blood cell; SD: standard deviation.
Alteration of 2,3-DPG
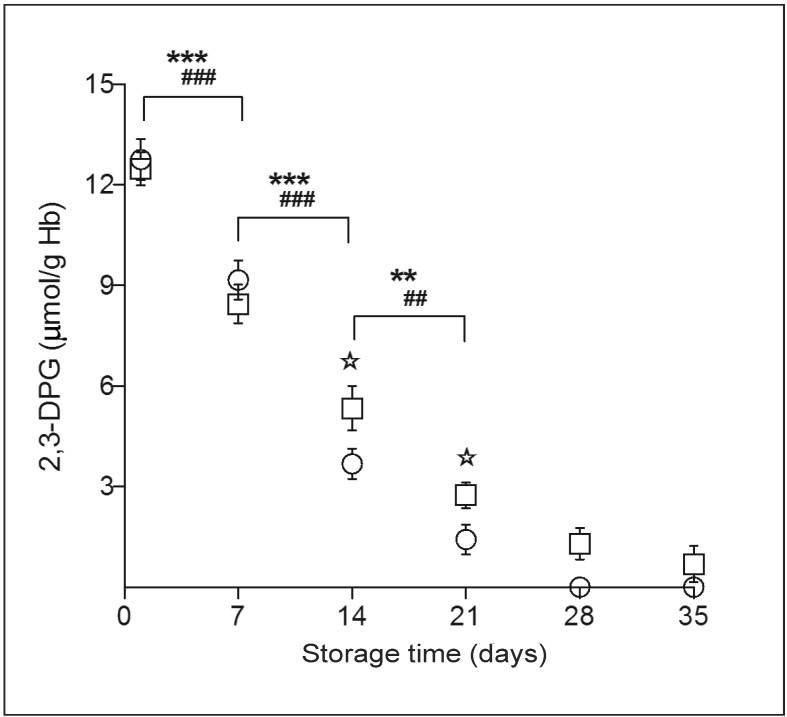
Routine cold storage has a large effect on intracellular 2,3-DPG concentration. During storage of whole blood and suspended RBC, 2,3-DPG levels decreased rapidly (p<0.001) in the first 3 weeks of storage to almost undetectable levels (Figure 5). The 2,3-DPG levels in suspended RBC were higher than those in whole blood units after 2 weeks of storage (p<0.01), but not significantly different in the first week.
Figure 5.
2,3-DPG concentration.
2,3-DPG decreased rapidly, and 2,3-DPG levels in suspended RBC became higher than those in whole blood units after 2 weeks of storage; they were not significant different between the two groups in the first 2 weeks. (○) whole blood group; (□) suspended RBCs group. Results shown are mean ± SD of 10 units. Whole blood: **p<0.01; ***p<0.001. Suspended RBC: ##p<0.01; ###p<0.001. Whole blood vs suspended RBC: ✯ p<0.01.
2,3-DPG: 2,3-diphosphoglycerate; Hb: haemoglobin; RBC: red blood cell; SD: standard deviation.
Alteration of EB3 fluorescent micrographs
Immunofluorescence and image analyses of EB3 in fresh blood and banked RBC are presented in Figure 6. Fluorescent micrographs show that band 3 proteins distributed evenly in the RBC membrane and there were no observable changes during the first 3 weeks. However, band 3 aggregated after 28 days of storage and the presence of band-3 aggregates further increased in the last week, which suggested that the structure and function of band 3 altered significantly during the last 2 weeks of storage.
Figure 6.
Fluorescent micrographs of fresh blood and stored RBC after immunostaining with monoclonal antibodies to EB3. The arrows indicate protein clusters after cold storage. RBC: red blood cell; EB3: erythrocyte band 3.
Discussion
It is known that RBC oxygen affinity increases during routine cold storage and 2,3-DPG regulates RBC oxygen release capacity by changing the Hb oxygen affinity10,12. These phenomena were supported by the clear alterations of thermodynamic parameters, particularly in the early period of storage (the first 3 weeks). The P50 value and oxygen release capacity in whole blood and suspended RBC both decreased rapidly during the first 3 weeks of storage, together with the drop in 2,3-DPG levels. After 3 weeks of storage, the P50 values of whole blood and suspended RBC did not change significantly as 2,3-DPG had decreased to almost undetectable levels. The oxygen release capacity decreased in a similar manner: after 3 weeks the oxygen release capacity in whole blood group was reduced about 51%, while that of suspended RBC decreased about 42% compared to “fresh blood”.
2,3-DPG, an intermediate metabolite in the Embden-Meyerhof glycolytic pathway, plays an important role in RBC oxygen release11. Our results showed that intracellular 2,3-DPG levels of whole blood and suspended RBC decreased rapidly during storage, especially in the first 3 weeks. This confirms that the decrease in oxygen release capacity and P50 of stored RBC in the early storage period is primarily due to the decrease of 2,3-DPG levels. However, the oxygen affinity of stored RBC could not be regulated when 2,3-DPG was completely depleted. This is a limitation of thermodynamic analysis, which describes the impact of 2,3-DPG levels on RBC oxygen affinity during the storage but is not consistent with the clinical outcomes of 2,3-DPG-depleted blood transfusion.
In this study, a kinetic analysis was carried out to determine RBC oxygen release ability as oxygen transfer is a dynamic process in vivo and thermodynamic analysis was not able to comprehensively evaluate oxygen release function of stored RBC. The PO2-t curve is a direct way to describe the oxygen release function of an oxygen-carrying solution. The RBC can be seen as an “oxygen storage pool”, holding more oxygen in solution. The Hb-binding oxygen dissociated into the solution, adding the physical dissolved oxygen and delaying the decrease of oxygen partial pressure when hypoxic gases pass through continuously. The content of Hb-binding oxygen and its dissociation determined the decay time and the downward trend of the curve under the same conditions. The results showed that, compared with PBS buffer, the RBC suspension PO2-t curve decay rate was slow with hypoxic gas passing through, and the PO2-t curve had a slightly S-shaped characteristic. The PO2-t curve shifted to the left with increasing storage time, continuously approaching the curve of the PBS buffer. However, unlike the alterations of the thermodynamic parameters, the PO2-t curves of whole blood and suspended RBC both changed slowly during the first 3 weeks of storage, and then altered significantly in the last 2 weeks.
Like the PO2-t curve, the kinetic parameter T*50 also changed sharply in the last 2 weeks of storage. In contrast to the thermodynamic analysis, kinetic data indicated that the sharp decrease in oxygen release ability of stored RBC appeared primarily at the end of storage. This suggests that kinetic analysis describes another alteration in oxygen release function of stored RBC during storage which is not due to the decrease of 2,3-DPG. The changes in kinetic parameters were more consistent with the clinical consequences of oxygen release ability of stored RBC than were the alterations of thermodynamic parameters and 2,3-DPG levels22,23,26.
It is important to note that the mechanisms of blood banking-induced alterations of RBC oxygen release kinetic properties are not clear. One possible explanation is that oxygen release kinetic parameters of stored RBC are regulated by the “Bohr effect”, which works efficaciously depending on RBC membrane protein band 3 (anion exchanger)27,28. During routine cold storage, band 3-associated modifications were observed after 2–3 weeks of storage29 and band 3 oligomers were detected after the 24th day of storage30. Our results also verified that critical alterations of band 3 protein occurred during the last 2 weeks of storage. These changes of band 3 may disrupt the regulation of RBC oxygen release function by the “Bohr effect”. In fact, blood oxygen affinity changes dynamically in vivo under the influence of the Bohr effect. In the lung capillaries the efflux of carbon dioxide increases Hb oxygen affinity, while in the tissue capillaries entry of carbon dioxide promotes the release of oxygen by decreasing Hb oxygen affinity31,32.
Conclusions
In summary, routine cold storage has a major impact on RBC oxygen release and the properties of banked blood. Thermodynamic analysis indicated that RBC oxygen release ability decreased rapidly in the first 3 weeks of storage, which was due to the decrease of 2,3-DPG levels. However, thermodynamic analysis could not give an explanation for the clinical consequences of completely 2,3-DPG-depleted RBC units, which do not seem to be that significant. Kinetic analysis offered a more consistent result with in vivo studies in that RBC oxygen release ability changed slowly for the first 3 weeks, then decreased significantly during the last 2 weeks of storage. Though the specific mechanism was not clear, changes to band 3 may play an important role in banking-induced alterations of RBC oxygen release kinetic properties through the Bohr effect.
Footnotes
Funding and resources
This work was supported by grants from the National Natural Science Foundation of China, N. 31271229 and 11072275. The authors acknowledge the Chongqing Blood Centre for the provision of blood products.
Sources of support
This work was supported by grants from the National Natural Science Foundation of China, N. 31271229 and 11072275.
Authorship contributions
YL and XW made substantial contributions to the design of the study; YL and YX led the acquisition of data and their initial analysis; RW and FT performed the statistical analysis. YL drafted the paper.
The Authors declare no conflict of interest.
References
- 1.Tinmouth A, Fergusson D, Yee IC, et al. Clinical consequences of red cell storage in the critically ill. Transfusion. 2006;46:2014–27. doi: 10.1111/j.1537-2995.2006.01026.x. [DOI] [PubMed] [Google Scholar]
- 2.Fabron A, Jr, Lopes LB, Bordin JO. Transfusion-related acute lung injury. J Bras Pneumol. 2007;33:206–12. doi: 10.1590/s1806-37132007000200016. [DOI] [PubMed] [Google Scholar]
- 3.Relevy H, Koshkaryev A, Manny N, et al. Blood banking-induced alteration of red blood cell flow properties. Transfusion. 2008;48:136–46. doi: 10.1111/j.1537-2995.2007.01491.x. [DOI] [PubMed] [Google Scholar]
- 4.Berezina TL, Zaets SB, Morgan C, et al. Influence of storage on red blood cell rheological properties. J Surg Res. 2002;102:6–12. doi: 10.1006/jsre.2001.6306. [DOI] [PubMed] [Google Scholar]
- 5.Raat NJ, Ince C. Oxygenating the microcirculation: the perspective from blood transfusion and blood storage. Vox Sang. 2007;93:12–8. doi: 10.1111/j.1423-0410.2007.00909.x. [DOI] [PubMed] [Google Scholar]
- 6.Ho J, Sibbald WJ, Chin-Yee IH. Effects of storage on efficacy of red cell transfusion: when is it not safe? Crit Care Med. 2003;31:S687–97. doi: 10.1097/01.CCM.0000099349.17094.A3. [DOI] [PubMed] [Google Scholar]
- 7.Bennett-Guerrero E, Veldman TH, Doctor A, et al. Evolution of adverse changes in stored RBCs. Proc Natl Acad Sci USA. 2007;104:17063–8. doi: 10.1073/pnas.0708160104. [DOI] [PMC free article] [PubMed] [Google Scholar]
- 8.Cabrales P, Intaglietta M, Tsai A. Transfusion restores blood viscosity and reinstates microvascular conditions from hemorrhagic shock independent of oxygen carrying capacity. Resuscitation. 2007;75:124–34. doi: 10.1016/j.resuscitation.2007.03.010. [DOI] [PMC free article] [PubMed] [Google Scholar]
- 9.Villela NR, Cabrales P, Tsai AG, et al. Microcirculatory effects of changing blood hemoglobin oxygen affinity during hemorrhagic shock resuscitation in an experimental model. Shock. 2009;31:645–52. doi: 10.1097/SHK.0b013e31818bb98a. [DOI] [PubMed] [Google Scholar]
- 10.Valtis DJ, Kennedy AC. Defective gas-transport function of stored red blood cells. Lancet. 1954;266:119–24. doi: 10.1016/s0140-6736(54)90978-2. [DOI] [PubMed] [Google Scholar]
- 11.Benesch R, Benesch RE, Yu CI. Reciprocal binding of oxygen and diphospho-glycerate by human hemoglobin. Proc Natl Acad Sci USA. 1968;59:526–32. doi: 10.1073/pnas.59.2.526. [DOI] [PMC free article] [PubMed] [Google Scholar]
- 12.Hamasaki N, Rose ZB. The binding of phosphorylated red cell metabolites to human hemoglobin. A J Biol Chem. 1974;249:7896–901. [PubMed] [Google Scholar]
- 13.Almac E, Ince C. The impact of storage on red cell function in blood transfusion. Best Pract Res Clin Anaesthesiol. 2007;21:195–208. doi: 10.1016/j.bpa.2007.01.004. [DOI] [PubMed] [Google Scholar]
- 14.Heaton A, Keegan T, Holme S. In vivo regeneration of red cell 2,3-diphosphoglycerate following transfusion of DPG-depleted AS-1, AS-3 and CPDA-1 red cells. Br J Haematol. 1989;71:131–6. doi: 10.1111/j.1365-2141.1989.tb06286.x. [DOI] [PubMed] [Google Scholar]
- 15.Hess JR, Hill HR, Oliver CK, et al. Alkaline CPD and the preservation of RBC 2,3-DPG. Transfusion. 2002;42:747–52. doi: 10.1046/j.1537-2995.2002.00115.x. [DOI] [PubMed] [Google Scholar]
- 16.Hogman CF, Knutson F, Loof H, Payrat JM. Improved maintenance of 2,3 DPG and ATP in RBCs stored in a modified additive solution. Transfusion. 2002;42:824–9. doi: 10.1046/j.1537-2995.2002.00148.x. [DOI] [PubMed] [Google Scholar]
- 17.Hogman CF, Lof H, Meryman HT. Storage of red blood cells with improved maintenance of 2,3-bisphosphoglycerate. Transfusion. 2006;46:1543–52. doi: 10.1111/j.1537-2995.2006.00893.x. [DOI] [PubMed] [Google Scholar]
- 18.Yoshida T, AuBuchon JP, Dumont LJ, et al. The effects of additive solution pH and metabolic rejuvenation on anaerobic storage of red cells. Transfusion. 2008;48:2096–105. doi: 10.1111/j.1537-2995.2008.01812.x. [DOI] [PubMed] [Google Scholar]
- 19.De Korte D, Kleine M, Korsten HG, et al. Prolonged maintenance of 2,3-diphosphoglycerate acid and adenosine triphosphate in red blood cells during storage. Transfusion. 2008;48:1081–9. doi: 10.1111/j.1537-2995.2008.01689.x. [DOI] [PubMed] [Google Scholar]
- 20.Meryman HT, Hornblower M. Manipulating red cell intra- and extracellular pH by washing. Vox Sang. 1991;60:99–104. doi: 10.1111/j.1423-0410.1991.tb00881.x. [DOI] [PubMed] [Google Scholar]
- 21.Burger P, Korsten H, De Korte D, et al. An improved red blood cell additive solution maintains 2,3-diphosphoglycerate and adenosine triphosphate levels by an enhancing effect on phosphofructokinase activity during cold storage. Transfusion. 2010;50:2386–92. doi: 10.1111/j.1537-2995.2010.02700.x. [DOI] [PubMed] [Google Scholar]
- 22.D’Almeida MS, Gray D, Martin C, et al. Effect of prophylactic transfusion of stored red blood cells on oxygen reserve in response to acute isovolemic hemorrhage in a rodent model. Transfusion. 2001;41:950–6. doi: 10.1046/j.1537-2995.2001.41070950.x. [DOI] [PubMed] [Google Scholar]
- 23.Raat NJ, Verhoeven AJ, Mik EG, et al. The effect of storage time of human red cells on intestinal microcirculatory oxygenation in a rat isovolemic exchange model. Crit Care Med. 2005;33:39–45. doi: 10.1097/01.ccm.0000150655.75519.02. [discussion 238–9] [DOI] [PubMed] [Google Scholar]
- 24.Hamasakia N, Yamamotob M. Red blood cell function and blood storage. Vox Sang. 2000;79:191–7. doi: 10.1159/000056729. [DOI] [PubMed] [Google Scholar]
- 25.Xiong Y, Li Y, Xiong Y, et al. Exhaustive running exercise induce tyrosine phosphorylation of band 3 in rat erythrocytes. Cell Physiol Biochem. 2013;32:1060–71. doi: 10.1159/000354506. [DOI] [PubMed] [Google Scholar]
- 26.Lacroix J, Tucci M. Clinical impact of length of storage before red blood cell transfusion. Transfus Clin Biol. 2011;18:97–105. doi: 10.1016/j.tracli.2011.02.020. [In French.] [DOI] [PubMed] [Google Scholar]
- 27.Bohr C, Hasselbalch K, Krogh A. Concerning a Biologically Important Relationship - The Influence of the Carbon Dioxide Content of Blood on its Oxygen Binding. Skand Arch Physiol. 1904;16:402–12. [In German.] [Google Scholar]
- 28.Jensen FB. Red blood cell pH, the Bohr effect, and other oxygenation-linked phenomena in blood O2 and CO2 transport. Acta Physiol Scand. 2004;182:215–2. doi: 10.1111/j.1365-201X.2004.01361.x. [DOI] [PubMed] [Google Scholar]
- 29.Antonelou MH, Kriebardis AG, Stamoulis KE, et al. Red blood cell aging markers during storage in citrate-phosphate-dextrose-saline-adenine- glucose-mannitol. Transfusion. 2010;50:376–89. doi: 10.1111/j.1537-2995.2009.02449.x. [DOI] [PubMed] [Google Scholar]
- 30.Kriebardis AG, Antonelou MH, Stamoulis KE, et al. Storage-dependent remodeling of the red blood cell membrane is associated with increased immunoglobulin G binding, lipid raft rearrangement, and caspase activation. Transfusion. 2007;47:1212–20. doi: 10.1111/j.1537-2995.2007.01254.x. [DOI] [PubMed] [Google Scholar]
- 31.Christiansen J, Douglas CG, Haldane JS. The absorption and dissociation of carbon dioxide by human blood. J Physiol. 1912;48:244–71. doi: 10.1113/jphysiol.1914.sp001659. [DOI] [PMC free article] [PubMed] [Google Scholar]
- 32.Edsall JT. Understanding blood and hemoglobin: an example of international relations in science. Persp Biol Med. 1986;29:S107–23. doi: 10.1353/pbm.1986.0052. [DOI] [PubMed] [Google Scholar]


