Abstract
We proposed and developed a photoacoustic (PA) dermoscope equipped with an integrated PA probe to achieve quantification and high-resolution, high-contrast deep imaging of human skin. The PA probe, with light-sound confocal excitation and reception, is specially designed, and integrated with an objective lens, an ultrasound transducer, and an inverted-triangle coupling cup to facilitate convenient implementation in a clinical setting. The PA dermoscope was utilized for noninvasive and high-resolution imaging of epidermal and dermal structure in volunteers. The imaging results demonstrated that the characteristic parameters of skin disease, including pigment distribution and thickness, vascular diameter, and depth, can be obtained by the PA dermoscope, confirming that PA dermoscopy can serve as a potential tool for the diagnosis and curative effect evaluation of human skin disease.
OCIS codes: (170.3880) Medical and biological imaging, (170.5120) Photoacoustic imaging, (170.0180) Microscopy
1. Introduction
Currently, there are several techniques used for imaging human skin in vivo [1]. In usual practice, biopsy and optical dermoscopy are used to evaluate and analyze skin diseases. However, biopsy is inherently invasive, and can only provide information within a very limited portion of a lesion [2,3 Find: Replace: ]. Whereas optical dermoscopy assessment serves for a rough classification of a skin lesion, it cannot faciliate accurate diagnosis of pathological types since skin thickness varies between patients, and the distribution of skin thickness varies within a single lesion. Consequently, errors can arise in assigning a single treatment scheme to a heterogenous pathology. Optical coherence tomography (OCT) can produce high-resolution images of skin structure and roughly map microvascular malformations [4,5 Find: Replace: ], but pure optical imaging of human skin still suffers from limitations arising from biological light scattering [6,7 Find: Replace: ]. Moreover, due to its contrast principle, optical coherence images of hair follicles, sweat glands and sebaceous glands may be misjudged as lesion vessels within the dermis. Though ultrasonography can image up to several centimeters beneath the skin, the small differences in acoustic impedance between skin components lead to low imaging contrast, such that blood vessels of diameters less than several hundred microns are difficult to distinguish [8]. Owing to these factors, over-treatment and under-treatment frequently occur in clinical skin treatment (such as port wine stains, pigmentation, tumors etc.), which can result either in serious skin injury and aggravation of illness, or insufficient response, necessitating repeated treatments [9,10 Find: Replace: ]. Therefore, it is critical to develop a noninvasive, high-resolution technique with enough imaging depth for revealing skin structure as well as lesion parameters to aid in making accurate classifications, optimizing treatment plans, and evaluating therapies.
A hybrid technique—photoacoustic imaging (PAI)—has been proposed as a potentially superior medical imaging modality [11–13], that combines the strong points of ultrasonic and optical imaging, thus affording images with high resolution and high optical-absorption contrast extending into deep tissue. In PAI, an externally applied laser light with nanosecond pulses is used to illuminate biological tissues. Deeply penetrating laser energy is absorbed by chromophores within tissues, which subsequently undergo rapid thermoelastic expansion and consequently generate an ultrasonic signal. PAI can provide a volumetric image of tissues by reconstructing a source map of the detected ultrasonic signal. The image resolution and imaging depth limit is scalable with the ultrasonic frequency and the range of diffuse photons in tissue. With these attributes, PAI has come to be widely applied in bio-medical imaging [14–18] and molecular imaging studies [19–21]. Most PAI applications have hitherto targeted hemoglobin in blood, notably in photoacoustic measurement of blood vessels [22], photoacoustic early tumor detection [23] and label-free photoacoustic angiography [24]. However, quantitative and spatial characterization of lesion structure and statistics of vessel parameters have not yet been achieved for photoacoustic mapping of the full profile of human skin with high contrast and high resolution.
Our previous researches have demonstrated that photoacoustic (PA) microscopy allowed spatial visualization and quantification of cells, microvascular structures and tissues subcutaneously in animal models in vivo [24–28]. Thus, in this paper, we propose the use of photoacoustic dermoscopy for high-resolution imaging of human skin. With the absorption-sensitive image contrast from skin chromophores, PA dermoscopy has the potential to obtain noninvasive biopsy information on skin, which enables a meticulous understanding and diagnosis of pigmented lesions and vascular malformations in clinical skin disease detection.
2. Methods and materials
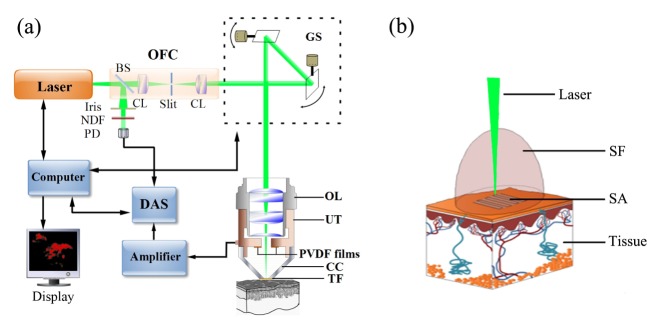
The schematic of the photoacoustic dermoscope is shown in Fig. 1(a). A small-sized laser (Model HLX -I-F005, Horus Laser, France), operating at a wavelength of 532 nm with a pulse width of 1 ns and a repetition rate up to 5 KHz, is used as the excitation light source. The peak output pulse energy of the laser is 10 µJ. The laser is divided into two beams by a beam splitter. One beam passes through a continuously variable iris and a neutral density filter, and is used to normalize the energy of each pulse measured with a photodiode. Another beam is first collimated with an optical filtering and collimating system, and then reflected into an integrative photoacoustic probe by a two-dimensional (2D) galvanometer scanner (Model 6231H, Cambridge Technology). The photoacoustic signals generated in the tissue are recorded by a data-acquisition system (sampling rate 200 M samples/s) after amplification. Finally, photoacoustic maps can be reconstructed by using MATLAB 7.0 software with a modified back-projection algorithm.
Fig. 1.
Schematic of the photoacoustic dermoscopy system. (a) Instrument layout showing the optical paths and electrical connections. DAS, data-acquisition system; OFC, optical filter and collimator; NDF, neutral density filter; PD, photodiode; BS, beam splitter; CL, convex lens; GS, galvanometer scanner; OL, objective lens; UT, ultrasound transducer; PVDF films: polyvinylidene fluoride films; CC, coupling cup; TF, transparency films. (b) Schematic of photoacoustic scanning acquisition. SF, sound field; SA, scanning area.
The integrative PA probe is specially designed for in vivo human skin imaging. The structure of the integrative photoacoustic detector is shown in the bottom right-hand corner of Fig. 1(a), which includes three parts: an objective lens, an ultrasound transducer and an inverted-triangle coupling cup. The laser beam is focused by the objective lens (a field- flattening lens with 4 × magnification), and passed through the ring ultrasound transducer and the coupling cup onto the skin surface. The home-made ring ultrasound element, with a center frequency of 18 MHz, a −6 dB bandwidth of 50%, a focal length of 15.8 mm and a −6 dB beam diameter of 0.53 mm, has a 2 mm inner diameter and 2.6 mm outer diameter. The coupling cup is filled with deionized water that serves as the ultrasonic coupling medium. A transparent plastic film is fixed on the head of the coupling cup for penetration of light and sound. All three parts are mechanically connected and adjusted to allow the focus of the laser beam and sound field to just be over the surface of the transparent film. The schematic of photoacoustic scanning acquisition is shown in Fig. 1(b). The focal spot is scanned point by point within the focused sound field, which improves the detection sensitivity. In the photoacoustic examination, the 2D scanning galvanometer is controlled by a computer synchronized with the pump laser (2 KHz). The light is scanned in raster mode along the x axis with a 2.5 μm step and a total of 200 steps for each cross-sectional image. Imaging size of one cross-sectional map is 0.5 × 1.5 mm2. At each sampling position, the photoacoustic signal is averaged for 10 traces; hence a frame transverse image requires 1 s. The energy density of the pulse laser on the skin surface is calculated to be ~15.9 mJ/cm2.
When undergoing photoacoustic detection, patients need to remain still when the transparent part of the probe is placed adjacent to the skin. Studies and test procedures were approved by the Ethics Committee of South China Normal University. Informed consent was obtained from all patients or their legal guardian, and there were no reports of discomfort or painful heating during the procedure.
3. Results
3.1 Resolution of the PA dermoscopy system
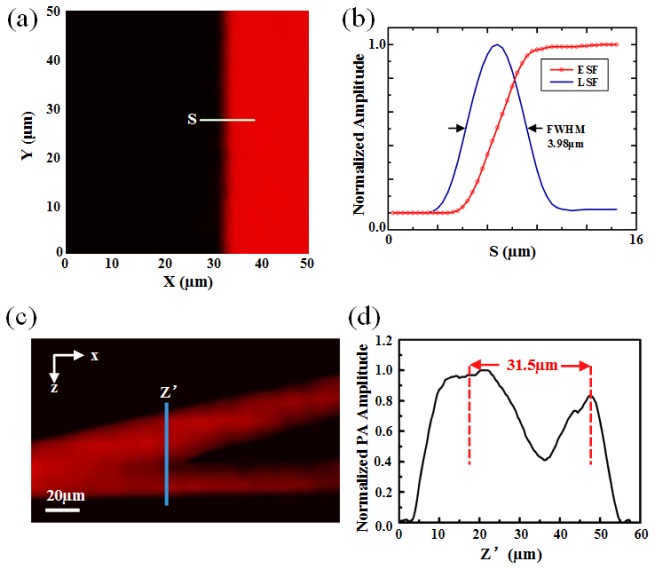
Lateral and axial resolution experiments were performed to verify the imaging capability of the PA dermoscopy system. Figure 2(a) shows a maximum amplitude projection (MAP) PA image of the sharp edge of a bar. The edge-spread function (ESF) was calculated by taking the distribution of PA normalized function values along the white line in Fig. 2(a). Taking the derivative of the ESF yielded the line-spread function (LSF), which is shown by a blue line in Fig. 2(b). Hence, the lateral resolution of the PA dermoscopy system as defined by the full-width at half-maximum (FWHM) of the LSF was 3.98 µm, which was closed to the theoretical value. Actually, the lateral resolution will be decreased along with the increase of imaging depth. In order to measure the actual axial resolution, a sample consisted of two layers of red ink was imaged as Fig. 2(c). The two layers of the sample were fixed in a small angle for a continuously variable distance, and consisted of polystyrene plastic and polyethylene film respectively. Figure 2(d) was reconstructed by the distribution of PA normalized function values along the blue line of Fig. 2(c), where the two layers could be just distinguished. Thus, the axial resolution was estimated to be 31.5 µm.
Fig. 2.
Resolution of the photoacoustic dermoscope. (a) MAP image of the sharp edge of a bar using the PA dermoscopy system. (b) Edge-spread function (ESF) and line-spread function (LSF) of the PA dermoscopy system. (c) PA signal profile through a point source. (d) Fourier spectrum of (c).
3.2 PA mapping of epidermal structure
The photoacoustic dermoscopy system was first tested for mapping of an epidermal structure. The same area of normal skin treated with gentian violet and exfoliating gel in turn, which was used to validate that PA dermoscopy can distinguish epidermal structures. The epidermis includes the stratum corneum (SC) and melanin layers (M). Gentian violet can stain the upper surface of skin and exfoliating gel can remove the stratum corneum. Figure 3(a) shows the PA map of the skin without treatment with gentian violet and exfoliating gel. Based on our knowledge of the epidermal structure, we presume that the PA map reveals the epidermal structure with its SC and M layers due to the different optical-absorption characteristics of those layers. Figure 3(b) shows the PA map of the gentian violet marking of the skin. After cleaning off the gentian violet, the same skin was treated with exfoliating gel, and then the PA map was obtained [see Fig. 3(c)]. As can be seen, when the skin is smeared with gentian violet, the PA signal and thickness of the stratum corneum increased, while when exfoliating gel was applied the epidermal thickness decreased compared to that of untreated skin. Furthermore, the intensity of the melanin layer was enhanced after the stratum corneum was exfoliated because more light energy was absorbed by the melanin layer and converted to PA signal. This was further confirmed by the statistics, i.e., epidermal thickness and the intensity ratio of the melanin layer to the stratum corneum, as shown in Fig. 3(d). The thickness was estimated by the distance between the two yellow dotted lines. The results demonstrate that the photoacoustic dermoscopy system was able to reveal the epidermal structures of human skin.
Fig. 3.
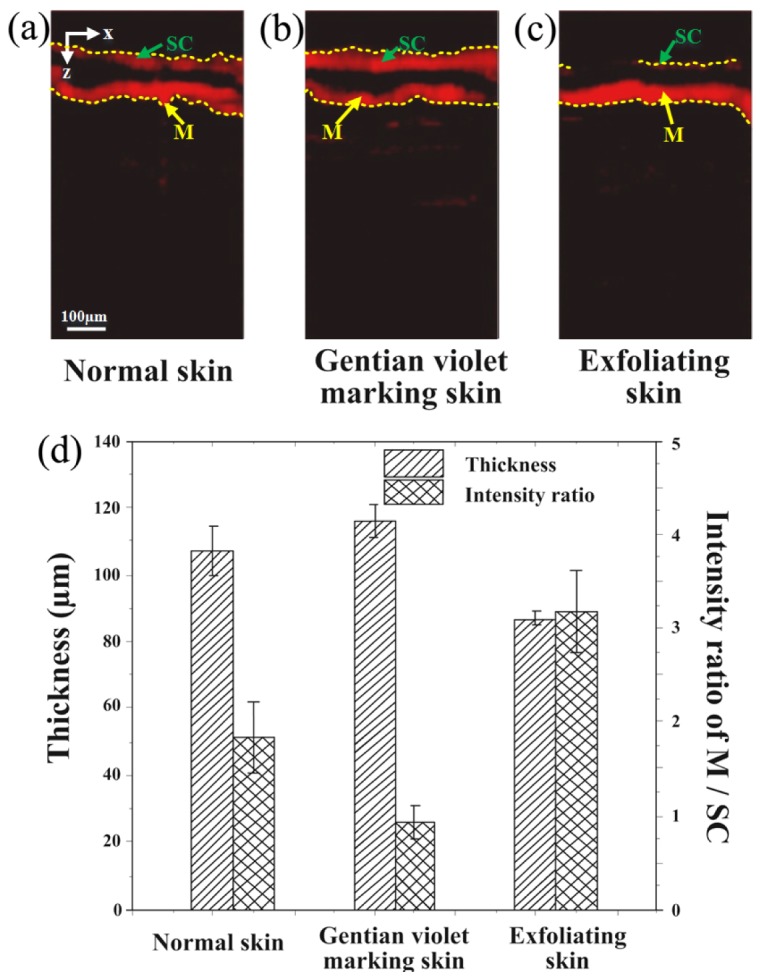
Photoacoustic mapping of epidermal structure. PA maps of the human skin (a) without any treatment, (b) with gentian violet marking, and (c) with gentian violet treatment. (d) Statistics, i.e., epidermal thickness and intensity ratio of melanin (M) layer to stratum corneum (SC), from the PA maps.
3.3 PA mapping of skin with pigmentation and depigmentation
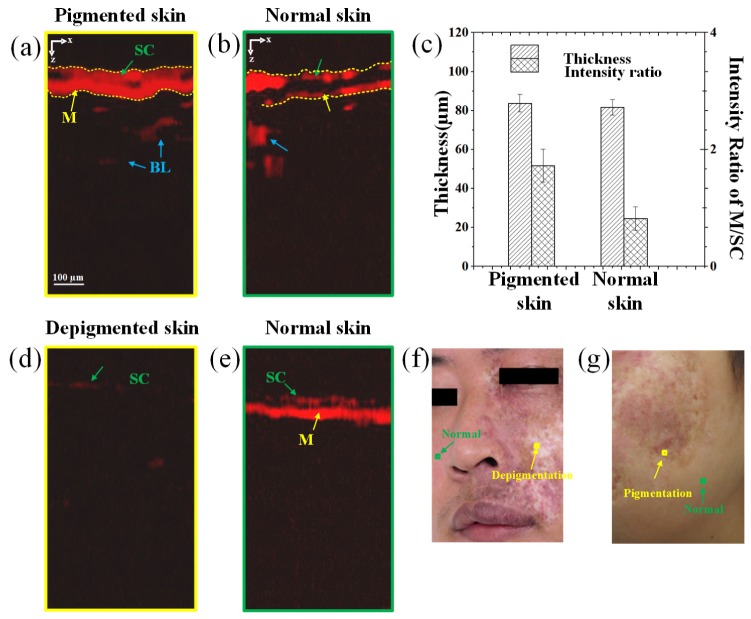
To further demonstrate the potential clinical applications of the photoacoustic dermoscopy system, we used it to investigate pigmentation and depigmentation in human skin. Figures 4(a) and 4(b) show PA images of pigmented skin and the surrounding normal skin from a facial pigmentation patient. The locations examined are shown in Fig. 4(g). Compared to normal skin, PA imaging of pigmented skin revealed a significantly thick layer of melanin, which extended up to the skin surface, the intensity ratio of the melanin layer to the stratum corneum was doubled, as shown in Fig. 3(c). However, the opposite situation was found from the PA images of depigmented skin and the surrounding normal skin, as shown in Figs. 4(d) and 4(e). The PA signals of the epidermis and melanin almost could not found in the depigmented area [Fig. 4(f)] of the patient’s face. These results demonstrate that PA dermoscopy can clearly distinguish the degree of pigment deposition in the epidermis. Therefore, by measuring the thickness of the epidermis and quantifying the amount of melanin, PA dermoscopy can provide spatial characterization and quantitative parameters (melanin layer thickness, pigment concentration) for analyzing pigmented skin lesions.
Fig. 4.
Photoacoustic mapping of the skin with pigmentation and depigmentation epidermal structures. (a) and (b) are the PA images of the pigmented skin and the surrounding normal skin, while (c) Statistics, i.e., epidermal thickness and intensity ratio of melanin (M) layer to stratum corneum (SC), from the PA maps of (a) and (b). (d) and (e) are the PA images of the depigmented skin and the surrounding normal skin. The detection areas of the patient are shown in (f) and (g). SC, stratum corneum; M, melanin; BL, blood vessel.
3.4 PA mapping of port wine stain skin and normal skin
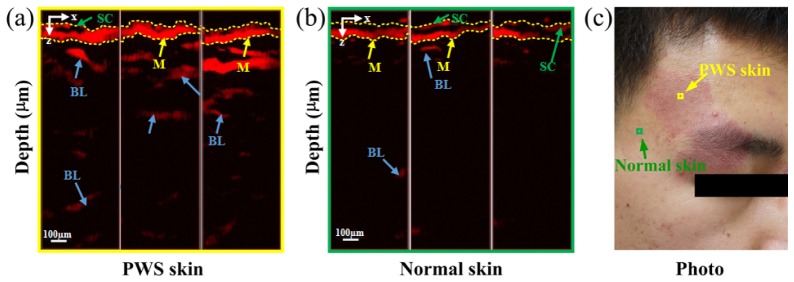
Finally, a comparison of normal and port wine stain (PWS) skin of one scarlet-lesion-type patient was investigated by PA dermoscopy. The detection area of the normal skin was adjacent to the lesion skin, as shown in Fig. 5(c). Consecutive cross-sectional PA maps along the x axis of the PWS and normal skin regions are presented in Figs. 5(a) and 5(b). The epidermis is indicated by the dotted lines at the top of the maps. As shown in the PA maps, the skin has a well-described layered structure. The main light absorbers of the epidermis are the \stratum corneum and pigment layers, which were clearly discerned with PA dermoscopy (see Fig. 3). Below the epidermis, blood (hemoglobin) is the most important component for PA detection. The blood vessels within PWS lesion skin presented an intricate irregular pattern, which was much more pronounced than in normal skin. Moreover, the diameter and depth of the lesion blood vessels were several times greater than in normal skin. Most importantly, the thickness, diameter, and depth of the lesion vessels can be measured directly by using an in-house programmed software tool, with the results shown in Figs. 5(a) and 5(b). All of these characteristics of the observed blood vasculature in the present PA maps were consistent with previous PWS histological results [7,8 Find: Replace: ]. Abundant clinical evidence demonstrates that the cure rate of pulsed dye laser (PDL) and photodynamic therapy (PDT) for treating PWS depends on prior knowledge of the depth, size, and density of the lesion vessels, which guides selection of the appropriate treatment scheme. Consequently, a method that can vividly visualize the full lesion profile and simultaneously quantify the vessel parameters will be a useful tool for assessing the progression and extent of PWS development and effects of treatment.
Fig. 5.
Photoacoustic mapping of PWS skin and normal skin. (a) Photoacoustic images of a PWS lesion in the forehead. (b) Photoacoustic images of the normal skin near the PWS lesion in the forehead. The images show three consecutive cross-section PA maps along the x axis, in which the epidermis is marked with dotted lines. (c) Photograph of the PWS patient’s face. The yellow and green arrows indicate the detection areas of the normal and PWS skin, respectively.
4. Discussion and conclusions
A microscopic imaging strategy is implemented in our PA systemem, and in this modality, imaging depth and imaging resolution are in conflict. Therefore, a low-magnification (4 × ) microscope objective lens is applied for laser excitation with a focus beam of ~5 µm, which ensures sufficient resolution to resolve the dilated lesion vessels from several tens of microns to a few hundred microns; meanwhile, the lens allows the relatively large number of photons scatter into the deeper tissues. The photoacoustic maps of PWS skin achieve about 1.5-mm-deep skin-tissue imaging with high contrast and high resolution, the range of which covers the vast majority of lesion areas for PWS patients. To the best of our knowledge, this is the first report that a noninvasive imaging technique provides enough imaging depth to resolve lesion vessels from epidermis to dermis with quantitative indexes. In addition, it is certain that enhancing the frequency of the ultrasonic transducer and improving the ultrasonic coupling efficiency would enable the discovery of finer structures and provide more comprehensive information.
In summary, a PA microscopy system was designed for noninvasive imaging of human skin. The PA dermoscopy modality has the requisite depth-imaging capability and is able to create volumetric vascular images with high contrast and high resolution that are label-free. Such an ability is useful in supplying more detailed information about skin structure and microcirculation. The promising results reported in this study show the potential application of PA dermoscopy in the diagnosis and therapy assessment of human skin diseases, including not only pigmentation but also other diseases such as PWS and skin cancers. In addition, PA dermoscopy may have a useful role in imaging the abnormal plexus of the dilated blood vessel layer located in the upper dermis, providing an ability to quantify the diameter, depth, and density of blood vessels, helping clinicians not only to quantitatively evaluate the pathological types and to determine appropriate treatment protocol; but also to monitor a treatment in real time and to quantitatively access the treatment outcome.
Acknowledgments
This research is supported by the National High Technology Research and Development Program of China (2015AA020901), the National Natural Science Foundation of China (91539127; 61331001; 61361160414), the Science and Technology Planning Project of Guangdong Province, China (2015B020233016; 2014B020215003; 2014A020215031).
References and links
- 1.Sharif S. A., Taydas E., Mazhar A., Rahimian R., Kelly K. M., Choi B., Durkin A. J., “Noninvasive clinical assessment of port-wine stain birthmarks using current and future optical imaging technology: a review,” Br. J. Dermatol. 167(6), 1215–1223 (2012). 10.1111/j.1365-2133.2012.11139.x [DOI] [PMC free article] [PubMed] [Google Scholar]
- 2.Smithies D. J., van Gemert M. J., Hansen M. K., Milner T. E., Nelson J. S., “Three-dimensional reconstruction of port wine stain vascular anatomy from serial histological sections,” Phys. Med. Biol. 42(9), 1843–1847 (1997). 10.1088/0031-9155/42/9/014 [DOI] [PubMed] [Google Scholar]
- 3.Zhou G. Y., Zhang Z. Y., Li J., “Computed assessment of pathological images on 52 case biopsies of port wine stain,” Chinese Journal of Oral and Maxillofacial Surgery 9(2), 112–115 (1999). [Google Scholar]
- 4.Pircher M., Goetzinger E., Leitgeb R., Hitzenberger C., “Three dimensional polarization sensitive OCT of human skin in vivo,” Opt. Express 12(14), 3236–3244 (2004). 10.1364/OPEX.12.003236 [DOI] [PubMed] [Google Scholar]
- 5.Mogensen M., Thrane L., Jørgensen T. M., Andersen P. E., Jemec G. B. E., “OCT imaging of skin cancer and other dermatological diseases,” J. Biophotonics 2(6-7), 442–451 (2009). 10.1002/jbio.200910020 [DOI] [PubMed] [Google Scholar]
- 6.Zhao S., Gu Y., Xue P., Guo J., Shen T., Wang T., Huang N., Zhang L., Qiu H., Yu X., Wei X., “Imaging port wine stains by fiber optical coherence tomography,” J. Biomed. Opt. 15(3), 036020 (2010). 10.1117/1.3445712 [DOI] [PubMed] [Google Scholar]
- 7.Liu G., Jia W., Nelson J. S., Chen Z., “In vivo, high-resolution, three-dimensional imaging of port wine stain microvasculature in human skin,” Lasers Surg. Med. 45(10), 628–632 (2013). 10.1002/lsm.22194 [DOI] [PMC free article] [PubMed] [Google Scholar]
- 8.Jasaitiene D., Valiukeviciene S., Linkeviciute G., Raisutis R., Jasiuniene E., Kazys R., “Principles of high-frequency ultrasonography for investigation of skin pathology,” J. Eur. Acad. Dermatol. Venereol. 25(4), 375–382 (2011). 10.1111/j.1468-3083.2010.03837.x [DOI] [PubMed] [Google Scholar]
- 9.Huikeshoven M., Koster P. H. L., de Borgie C. A. J. M., Beek J. F., van Gemert M. J. C., van der Horst C. M. A. M., “Redarkening of port-wine stains 10 years after pulsed-dye-laser treatment,” N. Engl. J. Med. 356(12), 1235–1240 (2007). 10.1056/NEJMoa064329 [DOI] [PubMed] [Google Scholar]
- 10.Gao K., Huang Z., Yuan K. H., Zhang B., Hu Z. Q., “Side-by-side comparison of photodynamic therapy and pulsed-dye laser treatment of port-wine stain birthmarks,” Br. J. Dermatol. 168(5), 1040–1046 (2013). 10.1111/bjd.12130 [DOI] [PubMed] [Google Scholar]
- 11.Wang L. V., Hu S., “Photoacoustic tomography: in vivo imaging from organelles to organs,” Science 335(6075), 1458–1462 (2012). 10.1126/science.1216210 [DOI] [PMC free article] [PubMed] [Google Scholar]
- 12.Razansky D., Distel M., Vinegoni C., Ma R., Perrimon N., Köster R. W., Ntziachristos V., “Multispectral opto-acoustic tomography of deep-seated fluorescent proteins in vivo,” Nat. Photonics 3(7), 412–417 (2009). 10.1038/nphoton.2009.98 [DOI] [Google Scholar]
- 13.Emelianov S. Y., Li P. C., O’Donnell M., “Photoacoustics for molecular imaging and therapy,” Phys. Today 62(5), 34–39 (2009). 10.1063/1.3141939 [DOI] [PMC free article] [PubMed] [Google Scholar]
- 14.Galanzha E. I., Shashkov E. V., Kelly T., Kim J. W., Yang L., Zharov V. P., “In vivo magnetic enrichment and multiplex photoacoustic detection of circulating tumour cells,” Nat. Nanotechnol. 4(12), 855–860 (2009). 10.1038/nnano.2009.333 [DOI] [PMC free article] [PubMed] [Google Scholar]
- 15.Zhang J., Yang S., Ji X., Zhou Q., Xing D., “Characterization of lipid-rich aortic plaques by intravascular photoacoustic tomography: ex vivo and in vivo validation in a rabbit atherosclerosis model with histologic correlation,” J. Am. Coll. Cardiol. 64(4), 385–390 (2014). 10.1016/j.jacc.2014.04.053 [DOI] [PubMed] [Google Scholar]
- 16.Kolkman R. G. M., Mulder M. J., Glade C. P., Steenbergen W., van Leeuwen T. G., “Photoacoustic imaging of port-wine stains,” Lasers Surg. Med. 40(3), 178–182 (2008). 10.1002/lsm.20612 [DOI] [PubMed] [Google Scholar]
- 17.Shu X., Liu W., Zhang H. F., “A Monte Carlo investigation on quantifying the retinal pigment epithelium melanin concentration by photoacoustic ophthalmoscopy,” J. Biomed. Opt. 20(10), 106005 (2015). 10.1117/1.JBO.20.10.106005 [DOI] [PMC free article] [PubMed] [Google Scholar]
- 18.Xi L., Jiang H., “High resolution three-dimensional photoacoustic imaging of human finger joints in vivo,” Appl. Phys. Lett. 107(6), 063701 (2015). 10.1063/1.4926859 [DOI] [Google Scholar]
- 19.Qin H., Zhou T., Yang S., Xing D., “Fluorescence quenching nanoprobes dedicated to in vivo photoacoustic imaging and high-efficient tumor therapy in deep-seated tissue,” Small 11(22), 2675–2686 (2015). 10.1002/smll.201403395 [DOI] [PubMed] [Google Scholar]
- 20.Nie L., Wang S., Wang X., Rong P., Ma Y., Liu G., Huang P., Lu G., Chen X., “In vivo volumetric photoacoustic molecular angiography and therapeutic monitoring with targeted plasmonic nanostars,” Small 10(8), 1585–1593 (2014). 10.1002/smll.201302924 [DOI] [PubMed] [Google Scholar]
- 21.Wang H., Liu C., Gong X., Hu D., Lin R., Sheng Z., Zheng C., Yan M., Chen J., Cai L., Song L., “In vivo photoacoustic molecular imaging of breast carcinoma with folate receptor-targeted indocyanine green nanoprobes,” Nanoscale 6(23), 14270–14279 (2014). 10.1039/C4NR03949A [DOI] [PubMed] [Google Scholar]
- 22.Viator J. A., Au G., Paltauf G., Jacques S. L., Prahl S. A., Ren H., Chen Z., Nelson J. S., “Clinical testing of a photoacoustic probe for port wine stain depth determination,” Lasers Surg. Med. 30(2), 141–148 (2002). 10.1002/lsm.10015 [DOI] [PubMed] [Google Scholar]
- 23.Li X., Heldermon C. D., Yao L., Xi L., Jiang H., “High resolution functional photoacoustic tomography of breast cancer,” Med. Phys. 42(9), 5321–5328 (2015). 10.1118/1.4928598 [DOI] [PubMed] [Google Scholar]
- 24.Zeng L., Piao Z., Huang S., Jia W., Chen Z., “Label-free optical-resolution photoacoustic microscopy of superficial microvasculature using a compact visible laser diode excitation,” Opt. Express 23(24), 31026–31033 (2015). 10.1364/OE.23.031026 [DOI] [PMC free article] [PubMed] [Google Scholar]
- 25.Wang Y., Xu D., Yang S., Xing D., “Toward in vivo biopsy of melanoma based on photoacoustic and ultrasound dual imaging with an integrated detector,” Biomed. Opt. Express 7(2), 279–286 (2016). 10.1364/BOE.7.000279 [DOI] [PMC free article] [PubMed] [Google Scholar]
- 26.He G., Xu D., Qin H., Yang S., Xing D., “In vivo cell characteristic extraction and identification by photoacoustic flow cytography,” Biomed. Opt. Express 6(10), 3748–3756 (2015). 10.1364/BOE.6.003748 [DOI] [PMC free article] [PubMed] [Google Scholar]
- 27.Chen Z., Yang S., Wang Y., Xing D., “All-optically integrated photo-acoustic microscopy and optical coherence tomography based on a single Michelson detector,” Opt. Lett. 40(12), 2838–2841 (2015). 10.1364/OL.40.002838 [DOI] [PubMed] [Google Scholar]
- 28.Li B., Qin H., Yang S., Xing D., “In vivo fast variable focus photoacoustic microscopy using an electrically tunable lens,” Opt. Express 22(17), 20130–20137 (2014). 10.1364/OE.22.020130 [DOI] [PubMed] [Google Scholar]


