Abstract
We investigated and validated a novel method to develop ultrathin lensed fiber-optic (LFO) probes for optical coherence tomography (OCT) imaging. We made the LFO probe by attaching a segment of no core fiber (NCF) to the distal end of a single mode fiber (SMF) and generating a curved surface at the tip of the NCF using the electric arc of a fusion splicer. The novel fabrication approach enabled us to control the length of the NCF and the radius of the fiber lens independently. By strategically choosing these two parameters, the LFO probe could achieve a broad range of working distance and depth of focus for different OCT applications. A probe with 125μm diameter and lateral resolution up to 10μm was demonstrated. The low-cost, disposable and robust LFO probe is expected to have great potential for interstitial OCT imaging.
OCIS codes: (110.4500) Optical coherence tomography, (060.2350) Fiber optics imaging, (170.2150) Endoscopic imaging
1. Introduction
Optical coherence tomography (OCT) is a high-resolution cross-sectional image technique with various biomedical applications [1]. OCT can potentially improve the diagnostic accuracy and treatment outcome for breast cancer [2,3]. Previous studies suggested that OCT signals could differentiate normal and cancerous breast tissues with high accuracy [4,5]. However, OCT imaging has small penetration depth (several millimeters) while cancerous lesions often are located in deep breast (>10mm). To acquire OCT signal from deep biological tissues including suspicious breast lesions for cancer diagnosis, it is desirable to have a low cost, disposable probe with ultrasmall form factor, appropriate working distance and depth of focus.
Imaging probes with millimeter or sub-millimeter diameter were developed using micro-compound lens or micro ball lens [6–9]. Further reducing the dimension of OCT instrument (125μm diameter) was achieved by splicing short segments of graded-index (GRIN) fiber and no core fiber (NCF) to a single mode fiber (SMF) [10–13]. Using an ultrathin probe, OCT imaging capability could be integrated with a 23-Gauge or 25-Gauge medical instrument such as hypodermic needle or fine tissue aspiration needle for OCT image guided biopsy.
In this manuscript, we describe a novel approach to fabricate ultrathin lensed fiber-optic (LFO) probes for forward viewing OCT imaging. The LFO probe was made by attaching a segment of NCF to the distal end of a SMF and generating a dome at the tip of the probe using the electric arc of a fusion fiber splicer. The curved surface of the dome (radius R) functioned as a micro fiber-optic lens and focused the exiting light beam. The NCF with length dNCF served as a spacer between the SMF tip and the focusing element. While OCT probe with similar configuration was described in literature, our approach is unique because we strategically chose and independently controlled two designing parameters, no core fiber length (dNCF) and fiber lens curvature (R), to achieve a broad range of imaging characteristics [20]. According to our results, dNCF played a more critical role than the curvature of fiber lens in determining the imaging performance of LFO, while the previous study did not consider the impact of dNCF. The LFO probe fabricated with our technique was extremely inexpensive, because it did not require delicate micro optical components and precise assembly. We expect the low-cost, disposable and robust LFO probe to have great potential in interstitial imaging for OCT guided breast biopsy and other surgical guidance applications.
2. Principle
The configuration of the LFO probe is illustrated in Fig. 1(a). Focusing elements is fabricated to a SMF that delivers light beam from the broadband light source to the sample and collects photons from the sample for interferometric detection. The probe has a piece of NCF attached to the SMF. In addition, a dome is generated at the tip of the NCF. The curved surface at the NCF tip provides the lens effect to focus the light beam for OCT imaging. Compared to a macroscopic imaging system, the NCF functions as a spacer before the lens. To fabricate a LFO probe as shown in Fig. 1(a), a segment of NCF is first spliced to the SMF using a fusion splicer and is then cut to desired length using a precise fiber cleaver. Afterwards, a curved surface is generated by applying heat to the probe tip using the electric arc provided by the fusion splicer. The radius (R) of the integrated lens can be controlled by using different electric arc discharge power.
Fig. 1.
(a) Illustration of LFO probe; (b) a photo of LFO probe fabricated in our lab.
To demonstrate the principle of the LFO probe, we perform ray tracing analysis using ABCD matrices, assuming a paraxial Gaussian beam [14]. We use a matrix MLFO to relate the rays output from the SMF and the LFO probe, where rLFO and rSMF are the positions of the rays measured from the optical axis, and rLFO’ and rSMF’ are the slopes of the rays relative to the optical axis.
| (1) |
MLFO can be obtained by multiplying ABCD matrices that model light propagation in the NCF (MNCF), fiber-optic lens (Mlens) and free space (Mfree): MLFO = MfreeMlensMNCF. MNCF, Mlens and Mfree are expressed in Eq. (2), where n, dNCF, R and d indicate the refractive index of the fiber, the length of NCF, the radius of the integrated fiber optic lens, and the distance of propagation in free space, respectively. Here we assume the sample is placed in air where the refractive index is 1.
| (2) |
Using Eqs. (1) and (2), we can find the working distance of the probe (dwork in Fig. 1) analytically. dwork is defined as the distance between the output beam waist and the tip of the LFO probe. The analytical solution of dwork is found when the radius of curvature for the output beam is infinitely large, as shown in Eq. (3) where ω0 is the waist size of the beam output from the SMF and λ is the operating wavelength.
| (3) |
Using MLFO and dwork, we are able to determine the waist size of the beam (ωf) output from the LFO (Eq. (4)). ωf is directly related to the lateral resolution of the probe. In addition, we can obtain the Rayleigh length (zR) of the output beam that determines the depth of focus for OCT imaging (Eq. (5)).
| (4) |
| (5) |
Equations (3), (4) and (5) suggest the imaging performance of the LFO probe can be adjusted by selecting different values of dNCF and R. Using Eqs. (3)–(5), we performed numeric simulation to study how the working distance, depth of focus, and the size of beam waist of a LFO probe varied as dNCF and R. Our results are shown in Fig. 2. Clearly, our fabrication technique offers greater freedom to achieve a large range of working distance, depth of focus, and size of beam waist, because dNCF and R can be adjusted individually. Figure 2 also shows the trade-off between the working distance and the beam waist size. In other words, a larger working distance generally implies a larger beam waist size, or lower lateral resolution. Similar trade-off exists between the depth of focus and waist size. On the other hand, when the length of NCF increases, the actual spot size of light beam at the focal plane becomes significantly larger than the value predicted by paraxial Gaussian beam propagation model, because the beam exiting the SMF diverges more within the longer NCF and experiences more significant abbreviation at the non-parabolic surface of the fiber lens. Therefore, we selected 500μm as the upper limit for the NCF length in simulation and in subsequent probe fabrication.
Fig. 2.
The working distance (a), the depth of focus (b), and the beam waist size of the LFO probe depend on the length of NCF and the radius of the fiber-optic lens.
3. Probe fabrication
To fabricate a LFO probe, we securely attached a SMF to a fiber clamp, cleaved the SMF tip and spliced a small segment of NCF to the distal end of the SMF. A fiber-optic fusion splicer (S178, Furukawa Electric Co., LTD.) was used for splicing. The fiber probe was held in the same clamp for cleaving and splicing. We then released the fiber clamp, recessed the fiber using a high-precision translation stage, clamped the probe again with the fiber clamp, and cleaved the fiber tip so that a segment of NCF with desired length (dNCF) was attached to the tip of SMF. Afterwards, we placed the fiber probe in the fusion splicer and generated a lens at the tip of the NCF probe using the arc check function of the splicer. In standard splicing program that connects two fibers together, the splicer discharges an arc between two electrodes and melts the ends of two fibers for butting. During arc check, the fiber end is melted by the arc while the fiber feeding motors remains idle. Therefore, a curved surface is formed immediately at the melted NCF tip due to surface tension after arc check. By adjusting the arc discharge power, we were able control the amount of silica that was melt during arc check to control the radius of the fiber optic lens fabricated. The fusion splicer we used in this study allows the fiber tip to be placed at the same position with high repeatability and accuracy. Therefore, the arc discharging power was the only parameter we used to control the curvature of the fiber lens.
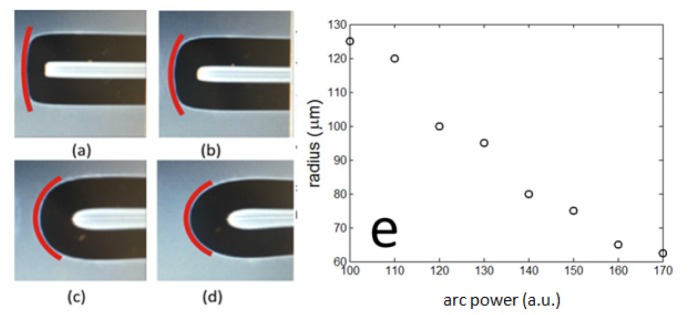
To demonstrate that we could effectively control the radius of the dome lens (R), we formed domes at the tip of NCF with different electric arc discharge power levels (Parc = 100, 120, 140 and 170), as shown in Fig. 3(a)–3(d). Notably, Parc is a unitless programmable parameter in the fusion splicer. Clearly, a larger arc power could result in a fiber-optic lens with a smaller curvature. As shown in Fig. 3(e), lens curvature decreases as the increase of the arc-check power until a semi-sphere with the same radius as the SMF was formed. To characterize the front tip curvature of the LFO, we analysed high quality images of the LFO tip directly captured by the fusion splicer (Fig. 3(a)–3(d)). As the diameter of the NCF is known (125μm), the scaling ratio between the image and the physical dimension of the LFO probe can be easily determined. Therefore, we were able to quantify the radius of LFO probe tip by tracking its contour (red curves in Fig. 3(a)–3(d)) using digital images acquired.
Fig. 3.
(a)-(d) photos of the integrated fiber-optic lens obtained at different arc power of the splicer (Parc = 100, 120, 140 and 170); (e) the radius of the integrated fiber-optic lens decays with the increase of the arc power.
4. Results
To validate the imaging performance of the LFO probe, we performed experiments using a 1300nm spectral domain OCT system. Details about the system can be found in our previous publications [15]. The system used a superluminescent diode as light source (SLD1325 Thorlabs, 100 nm bandwidth, corresponding to a 7.4 μm axial resolution) and a CMOS InGaAs camera (SUI1024LDH2, Goodrich). A frame grabber (PCIe-1433, National Instrument) took the interferometric signal from the camera. The system had a 2.5mm depth imaging range. Signals acquired were processed in real-time using graphic processing units (GPU). In this study, we adopted a common path configuration, to achieve robust and chromatic mismatch free OCT imaging [16]. Briefly, the broadband output from the SLD was routed through a fiber-optic coupler to the LFO probe. Sample light was collected by the probe and directed to the linescan camera for detection. In addition, Fresnel refection at probe tip served as reference light to generate interferometric OCT signal and shared the same probe path as the sample light.
To demonstrate that we could obtain LFO probes with different imaging characteristics by controlling the radius of the dome lens and the length of NCF, we fabricated four LFO probes (P1, P2, P3 and P4) with different NCF lengths (dNCF = 300μm or 500μm) and lens curvatures (R = 69μm and 74μm), as listed in Table 1. To evaluate the imaging performance of these LFO probes, we attached the probe to a high-precision translation stage (Newport, ILS100CC DC) and acquired OCT signals from a diffusive surface at different positions equally distributed along axial direction. Incident light was backscattered by the sample surface into a broad range of directions, which was critical to minimize the impact of beam incident angle in the measurement. Nevertheless, we placed the probe perpendicular to the surface of the sample to precisely control the distance between the probe and the phantom. We acquired OCT signals with the sample located at different axial positions and averaged the magnitude of OCT signals. The results are shown Fig. 4 (dashed curves) for different probes. We fitted the experimental data using a Gaussian model: S(z) = S0exp[-(z-dwork)2/DOF2] shown as solid curves in Fig. 4 to assess the working distance (dwork) and depth of focus (DOF). The values of working distance and depth of focus are summarized in Table 1. As shown in Fig. 4 and Table 1, for LFO probes with the same NCF length, P1 has a dome lens with a smaller radius compared to P2, and thus has a smaller working distance compared to P2. Similarly, P3 has a dome lens with a smaller radius compared to P4, and thus has a smaller working distance compared to P4. This is because a partially spherical dome with smaller radius has a stronger focusing power or shorter effective focal length. On the other hand, for LFO probe with the same fiber optic lens, P1 has a smaller segment of NCF compared to P3, and therefore has a larger working distance and depth of focus compared to P3. The same phenomenon can be seen for P2 and P4. This is because a longer NCF segment allows the beam to diverge sufficiently to output a tightly focused beam. Results in Fig. 3 and Table 1 are consistent with simulation results shown in Fig. 2.
Table 1. Working distance and depth of focus for probes we fabricated.
| Parameters | Working distance (μm) | Depth of focus (μm) | |||
|---|---|---|---|---|---|
| P1: dNCF = 300μm; R = 69 μm | 498 | 264 | |||
| P2: dNCF = 300μm; R = 74μm | 534 | 453 | |||
| P3: dNCF = 500μm; R = 69 μm | 234 | 98 | |||
| P4: dNCF = 500μm; R = 74μm | 277 | 229 | |||
Fig. 4.
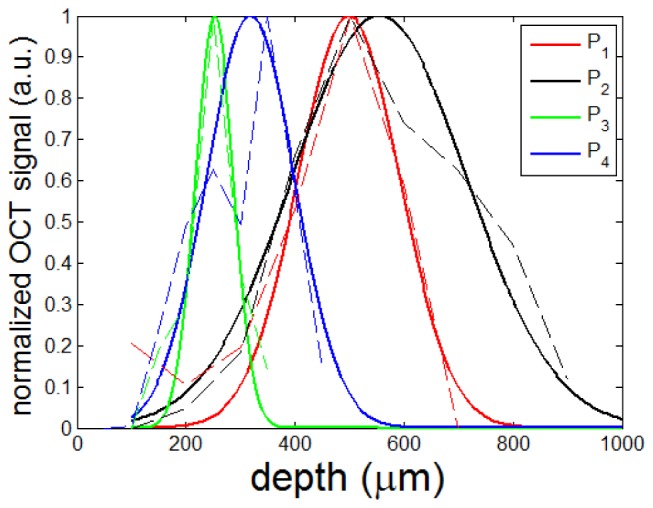
The magnitude of OCT signal obtained from different probes (dashed line: experimental data; solid line: fitted curve): P1: dNCF = 300μm and R = 69μm (red); P2: dNCF = 300μm and R = 74μm (black); P3: dNCF = 500μm and R = 69μm (green); P4: dNCF = 500μm and R = 74 μm (blue).
As shown in Fig. 2 and Fig. 4, the LFO probe collects photons with high efficiency from the waist of the output beam. The efficiency between different probes was not compared in Fig. 4. In addition, the LFO probe can resolve fine structure in the vicinity of the focal plane due to small beam size. To demonstrate this, we used a LFO probe (P3: dNCF = 500μm; R = 69μm) to image a variable line grating target (Thorlabs R1L3S6P). The probe was attached to a precise linear motor (Newport, ILS100CC DC) for transverse scanning. We acquired B-scan images from the same region of the resolution target when the resolution target was located at different depths, as shown in Fig. 5. When the resolution target was placed approximately at the focal plane (~234μm) of the output beam, the line grating (10 μm per line pair) can be clearly resolved (Fig. 5(b)), indicating the LFO achieves a lateral resolution as high as 10 μm at its focal plane. In comparison, compromised lateral resolution was observed at when the resolution target was out of focus.
Fig. 5.
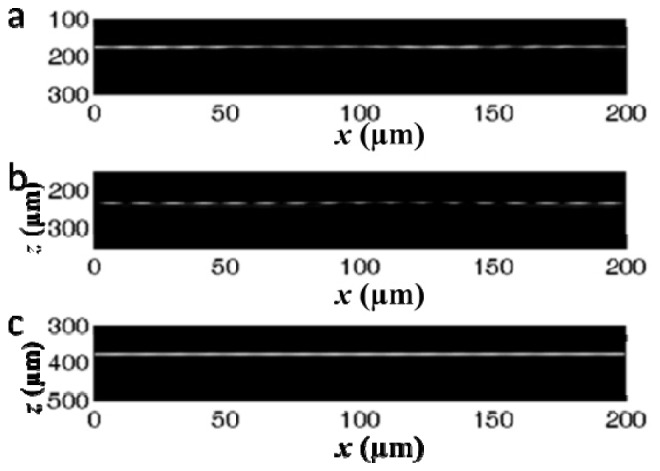
B-scan image of variable line grating target at different depths. (a) and (c) were obtained when the surface of the resolution target was out of focus; (b) was obtained when the surface of the resolution target was in focus.
To demonstrate the advantage of LFO in OCT imaging of turbid medium, we imaged the same region of a scattering phantom using the LFO probe (P3) and a bare fiber probe. The scattering phantom was fabricated by mixing silicone with titanium dioxide. We adjusted the distance between the probe tip and the sample surface, so that the sample surface approximately overlapped with the waist of the beam exiting the LFO probe. The axial position of the sample surface remained the same for imaging experiment based on bare fiber probe. Images obtained from the LFO probe and the bare fiber probe are shown in Fig. 6(a) and 6(b). We normalized linear scale Bscan OCT data with its maximum value, took the logarithm of the linear data, and display both images with the same dynamic range (Fig. 6(a): LFO; Fig. 6(b): SMF). Figure 6(a) shows a larger penetration depth of OCT signal compared to Fig. 6(b), because of more efficient collection of photons from the sample. Moreover, Fig. 6(a) clearly shows the interface between air and the scattering medium. In comparison, such a sharp interface cannot be observed in Fig. 6(b). In addition, Fig. 6(a) shows a finer speckle pattern compared to Fig. 6(b), suggesting a higher lateral resolution. To further illustrate different signal characteristics of the LFO probe and the SMF probe, we averaged OCT Ascans (linear signals without normalization) in Fig. 6(a) and 6(b). Averaged OCT signals are shown in Fig. 6(c). The black curve (obtained from LFO) in Fig. 6(c) shows a sharp peak corresponding to the air/sample interface, which is consistent with Fig. 6(a). In Fig. 6(c), it is clear that the OCT signal obtained from the LFO probe (black) has significantly larger magnitude compared to the signal obtained from the SMF probe (red), throughout the entire imaging range. To further illustrate the difference in lateral resolution between signals obtained from the LFO probe and the SMF probe, we performed speckle decorrelation analysis using Ascan segments at different lateral positions. Previous studies including our work suggested Pearson cross correlation coefficients (XCC) between A-scans is explicitly related the lateral resolution in OCT imaging [17,18]. A-scan segments (25μm in length) immediately blow the sample surface were used for XCC calculation. The resultant decorrelation curves are shown in Fig. 6(d). In Fig. 6(d), the FWHM of the black curve is approximately 10μm that is consistent with results in Fig. 5(b). Moreover, the FWHM of the black curve is smaller than the red curve, suggesting the LFO probe achieved a higher lateral resolution compared to the SMF probe. The difference in lateral resolution can also be directly observed in the lateral dimension of speckle pattern, as shown in the insets of Fig. 6(d). These regions of interests are zoomed-in versions of image enclosed by the rectangular region in Fig. 6(a). Although Fig. 6 suggests the LFO probe outperforms the bare fiber probe throughout the entire imaging range with reasonable signal to noise ratio, the beam from a LFO probe is expected to diverge more significantly at a larger depth beyond its Rayleigh range and thus introduce larger degradation in lateral resolution. However, this cannot be observed in Fig. 6 because of depth dependent OCT signal attenuation.
Fig. 6.
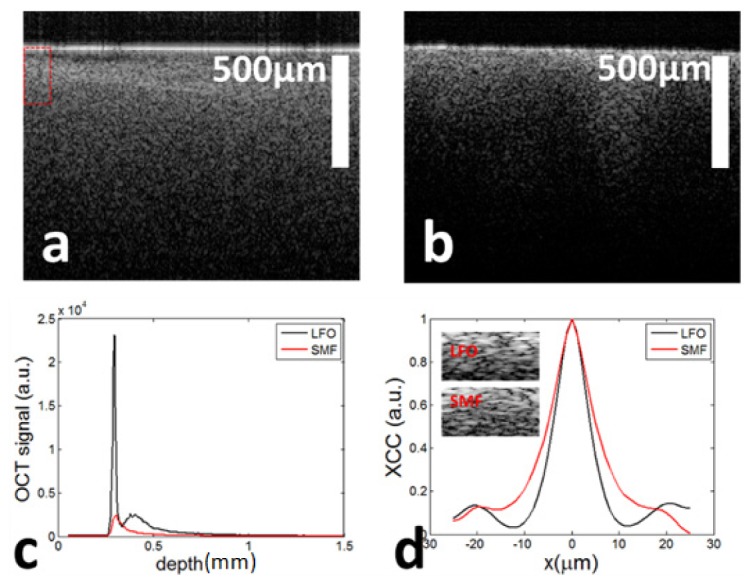
OCT image of phantom obtained from LFO probe (a) and bare fiber probe (b); (c) averaged A-scans obtained from LFO probe (black curve) and bare fiber probe (red curve); (d) ensemble average of Pearson cross correlation coefficients (XCC) for LFO probe (black curve) and bare fiber probe (red curve).
We further validated our LFO probe (P3) in onion cell imaging. Images obtained from the same region of the sample using the LFO probe and SMF probe are compared in Fig. 7(a) and 7(b), respectively. Clearly, the LFO probe can resolve small structure of the onion cell especially for the high-lighted part while the bare fiber cannot resolve the feature clearly. Moreover, the OCT image obtained with the LFO probe clearly shows onion cell walls along axial direction. In comparison, such features cannot be found in Fig. 7(b). If image features at larger depth are of interest, we can strategically engineer the working distance of the LFO probe to achieve desired imaging performance for different applications.
Fig. 7.
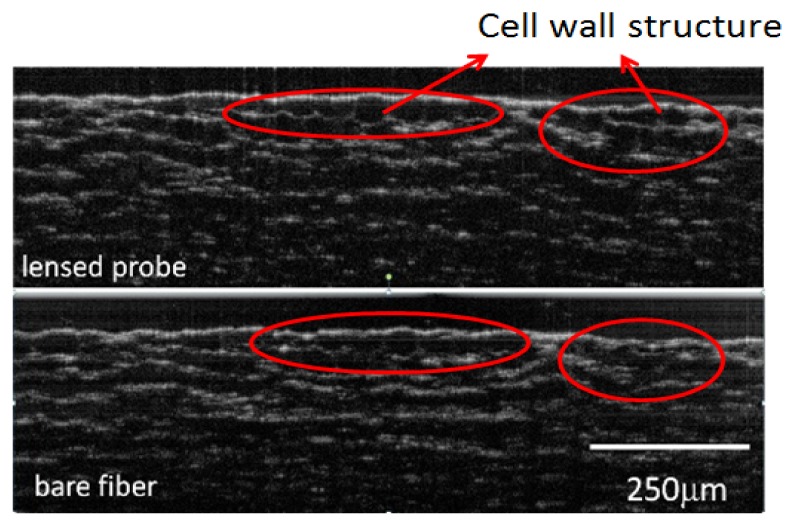
OCT image of onion cells obtained from LFO probe (a) and SMF probe (b).
5. Conclusion and discussion
We describe a novel technology to fabricate ultrathin lensed fiber-optic (LFO) probes for OCT imaging. We demonstrated in simulation and experiment that we could achieve a broad range of imaging performance by independently controlling the length of NCF and radius of the lens. We demonstrated a 10μm lateral resolution in LFO probe based OCT imaging, using a resolution target and turbid medium. Finally, we perform onion cell imaging to demonstrate the LFO probe can resolve small structure such as cell wall of the onion cell while the bare fiber can’t resolve the feature clearly.
The LFO probe developed in this study is expected to have great potential in minimally invasive deep tissue imaging, reducing the dimension of OCT imaging device and improving imaging quality. An OCT imaging device based on a LFO probe has to be appropriately encapsulated. Otherwise, the fragile probe can be easily damaged during tissue imaging. With an air gap between the probe tip and tissue of interest, the LFO probe can be used to collect photons effectively from the tissue by strategically choosing designing parameters (NCF length and dome lens curvature).
The focus of this study was to optimize the imaging performance of a fiber optic probe in terms of working distance, depth of focus and lateral resolution. The quality of OCT image also depends on various other factors such as reference power. The reference light in the common path OCT imaging system derived from the Fresnel reflection at the dome lens surface. As light reflected from the dome lens surface was coupled back for detection with reduced efficiency, reference power generated from the LFO probe had smaller magnitude compared to a flat tip single mode fiber probe. However, the level of detected reference signal can be optimized by using a larger camera integration time. Although the overall signal to noise ratio of OCT image is affected due to the alternation in reference light power, the signal characteristics at different depth is mainly determined by the configuration of the LFO.
We noticed that our paraxial Gaussian beam analysis could effectively predict the working distance of the LFO probe, while it overestimated the lateral resolution and underestimated the depth of focus. The paraxial Gaussian beam propagation model has limited effectiveness particularly when the NCF length is large, because it does not consider light beam abbreviation. In fact, the micro fiber optic lens generated at the LFO tip results in considerable amount of abbreviation [19]. To validate this, we performed ray tracing using Zemax software and obtained the spot size at the waist of output beam from P3. The resultant root mean square (RMS) radius of the light spot was approximately 10 μm, consistent with the measured lateral resolution. In comparison, the paraxial Gaussian model predicted a 2.3 μm beam waist size. In addition, the characteristics of OCT signal depend on the beam profile from the LFO probe, as well as optical property of the sample under OCT imaging. Nevertheless, our simulation and experimental results are consistent in the trend of working distance and depth of focus.
Acknowledgment
The research reported in this manuscript is supported by internal funding from New Jersey Institute of Technology.
References and links
- 1.Huang D., Swanson E. A., Lin C. P., Schuman J. S., Stinson W. G., Chang W., Hee M. R., Flotte T., Gregory K., Puliafito C. A., Fujimoto J. G., “Optical coherence tomography,” Science 254(5035), 1178–1181 (1991). 10.1126/science.1957169 [DOI] [PMC free article] [PubMed] [Google Scholar]
- 2.Boppart S. A., Luo W., Marks D. L., Singletary K. W., “Optical coherence tomography: feasibility for basic research and image-guided surgery of breast cancer,” Breast Cancer Res. Treat. 84(2), 85–97 (2004). 10.1023/B:BREA.0000018401.13609.54 [DOI] [PubMed] [Google Scholar]
- 3.McLaughlin R. A., Quirk B. C., Curatolo A., Kirk R. W., Scolaro L., Lorenser D., Robbins P. D., Wood B. A., Saunders C. M., Sampson D. D., “Imaging of breast cancer with optical coherence tomography needle probes: feasibility and initial results,” IEEE J. Sel. Top. Quantum Electron. 18(3), 1184–1191 (2012). 10.1109/JSTQE.2011.2166757 [DOI] [Google Scholar]
- 4.Goldberg B. D., Iftimia N. V., Bressner J. E., Pitman M. B., Halpern E., Bouma B. E., Tearney G. J., “Automated algorithm for differentiation of human breast tissue using low coherence interferometry for fine needle aspiration biopsy guidance,” J. Biomed. Opt. 13(1), 014014 (2008). 10.1117/1.2837433 [DOI] [PubMed] [Google Scholar]
- 5.Nguyen F. T., Zysk A. M., Chaney E. J., Kotynek J. G., Oliphant U. J., Bellafiore F. J., Rowland K. M., Johnson P. A., Boppart S. A., “Intraoperative evaluation of breast tumor margins with optical coherence tomography,” Cancer Res. 69(22), 8790–8796 (2009). 10.1158/0008-5472.CAN-08-4340 [DOI] [PMC free article] [PubMed] [Google Scholar]
- 6.Fujimoto J. G., Brezinski M. E., Tearney G. J., Boppart S. A., Bouma B., Hee M. R., Southern J. F., Swanson E. A., “Optical biopsy and imaging using optical coherence tomography,” Nat. Med. 1(9), 970–972 (1995). 10.1038/nm0995-970 [DOI] [PubMed] [Google Scholar]
- 7.Li X., Chudoba C., Ko T., Pitris C., Fujimoto J. G., “Imaging needle for optical coherence tomography,” Opt. Lett. 25(20), 1520–1522 (2000). 10.1364/OL.25.001520 [DOI] [PubMed] [Google Scholar]
- 8.Li X., Ko T. H., Fujimoto J. G., “Intraluminal fiber-optic Doppler imaging catheter for structural and functional optical coherence tomography,” Opt. Lett. 26(23), 1906–1908 (2001). 10.1364/OL.26.001906 [DOI] [PubMed] [Google Scholar]
- 9.Zhao M., Huang Y., Kang J. U., “Sapphire ball lens-based fiber probe for common-path optical coherence tomography and its applications in corneal and retinal imaging,” Opt. Lett. 37(23), 4835–4837 (2012). 10.1364/OL.37.004835 [DOI] [PMC free article] [PubMed] [Google Scholar]
- 10.Mao Y., Chang S., Sherif S., Flueraru C., “Graded-index fiber lens proposed for ultrasmall probes used in biomedical imaging,” Appl. Opt. 46(23), 5887–5894 (2007). 10.1364/AO.46.005887 [DOI] [PubMed] [Google Scholar]
- 11.Lorenser D., Yang X., Sampson D. D., “Ultrathin fiber probes with extended depth of focus for optical coherence tomography,” Opt. Lett. 37(10), 1616–1618 (2012). 10.1364/OL.37.001616 [DOI] [PubMed] [Google Scholar]
- 12.Liu X., Kang J. U., “Optimization of an angled fiber probe for common-path optical coherence tomography,” Opt. Lett. 38(15), 2660–2662 (2013). 10.1364/OL.38.002660 [DOI] [PMC free article] [PubMed] [Google Scholar]
- 13.Lorenser D., Yang X., Kirk R. W., Quirk B. C., McLaughlin R. A., Sampson D. D., “Ultrathin side-viewing needle probe for optical coherence tomography,” Opt. Lett. 36(19), 3894–3896 (2011). 10.1364/OL.36.003894 [DOI] [PubMed] [Google Scholar]
- 14.Yariv A., Yeh P., Photonics: Optical Electronics in Modern Communications The Oxford Series in Electrical and Computer Engineering (Oxford University Press, Inc., 2006). [Google Scholar]
- 15.Wang Y., Wang Y., Akansu A., Belfield K. D., Hubbi B., Liu X., “Robust motion tracking based on adaptive speckle decorrelation analysis of OCT signal,” Biomed. Opt. Express 6(11), 4302–4316 (2015). 10.1364/BOE.6.004302 [DOI] [PMC free article] [PubMed] [Google Scholar]
- 16.Kang J. U., Han J. H., Liu X., Zhang K., Song C. G., Gehlbach P., “Endoscopic Functional Fourier Domain Common Path Optical Coherence Tomography for Microsurgery,” IEEE J. Sel. Top. Quantum Electron. 16(4), 781–792 (2010). 10.1109/JSTQE.2009.2031597 [DOI] [PMC free article] [PubMed] [Google Scholar]
- 17.Liu X., Huang Y., Kang J. U., “Distortion-free freehand-scanning OCT implemented with real-time scanning speed variance correction,” Opt. Express 20(15), 16567–16583 (2012). 10.1364/OE.20.016567 [DOI] [Google Scholar]
- 18.Kurokawa K., Makita S., Hong Y. J., Yasuno Y., “Two-dimensional micro-displacement measurement for laser coagulation using optical coherence tomography,” Biomed. Opt. Express 6(1), 170–190 (2015). 10.1364/BOE.6.000170 [DOI] [PMC free article] [PubMed] [Google Scholar]
- 19.Mertz J., Introduction to Optical Microscopy (Roberts, 2010). [Google Scholar]
- 20.Ryu S. Y., Choi H. Y., Na J., Choi W. J., Lee B. H., “Lensed fiber probes designed as an alternative to bulk probes in optical coherence tomography,” Appl. Opt. 47(10), 1510–1516 (2008). 10.1364/AO.47.001510 [DOI] [PubMed] [Google Scholar]


