Abstract
Several chemo-drugs act as the biocompatible fluorophores. Here, the laser induced fluorescence (LIF) properties of doxorubicin, paclitaxel and bleomycin are investigated. The absorption lines mostly lie over UV range according to the UV-VIS spectra. Therefore, a single XeCl laser provokes the desired transitions of the chemo-drugs of interest at 308 nm. It is shown that LIF spectra are strongly dependent on the fluorophore concentration giving rise to the sensible red shift. This happens when large overlapping area appears between absorption and emission spectra accordingly. The red shift is taken into account as a characteristic parameter of a certain chemo-drug. The fluorescence extinction (α) and self-quenching (k) coefficients are determined based on the best fitting of the adopted Lambert-Beer equation over experimental data. The quantum yield of each chemo-drug is also measured using the linearity of the absorption and emission rates.
OCIS codes: (000.1430) Biology and medicine; (300.2530) Fluorescence, laser-induced; (300.1030) Absorption; (170.0170) Medical optics and biotechnology; (170.4580) Optical diagnostics for medicine; (300.2140) Emission
1. Introduction
Cancer is a generic term for a large group of diseases that arises from the metastases of the abnormal cells to the other organs [1,2]. In addition, the current diagnostic methods are mainly based on the biopsy that resembles to be painful and sluggish in the current cancer protocols. As a consequence, several non-invasive diagnostic techniques have been recently developed to identify the carcinoma in early stages [3,4]. Currently, the concept of optical biopsy meets a large medical demands seeking for the minimally invasive alternatives in the diagnostic oncology [5]. As a consequence, the optical spectroscopic instruments are exploited to modify the traditional pathology toward real time spectroscopy accompanying biomedical materials. Despite, the poor auto-fluorescence signals limit clinical applications of the endogenous fluorophores, however LIF has shown the competence for the efficient fluorescence spectroscopy/ imaging in oncology by virtue of exogenous agents [6]. The fluorophores such as rohdamine6G and coumarin [7] fairly give out high sensitivity, however those are not considered as the biocompatible dyes. Furthermore, the bio-fluorescence cyanine (Cy) group is efficiently used to identify the cancerous tumors during the selective drug delivery and chemotherapy [8]. It is worth noting some chemo-drugs resemble to act as the biocompatible fluorophores too. Doxorubicin (DOX) is a potent anti-tumoral agent. That is widely employed for the purpose of the cancer therapy with good fluorescence characteristics [9,10]. The spectra are studied by using the femto second time-resolved mode-locked laser at 800 nm. The dimerization induces a dramatic reduction of the quantum yield associated with a large spectral red shift of ~25 nm [11]. The absorption and fluorescence of the complex of DNA-DOX were analyzed using an ion argon laser at 457.9 nm too. The fluorescence spectra alteration in the interaction of DOX with DNA accounts as an evidence of the formation of the binding between the drug and nucleic acid [9]. Paclitaxel binding with DOX and human serum albumin was studied by means of UV-visible and fluorescence spectroscopy [12]. Chien et.al have employed the LIF spectroscopy at 300nm to examine the bleomycin interaction with the hydrolysis products of DNA [13]. Despite the fluorescence of DOX was previously reported, however no attempt has been seriously made to investigate the LIF of the other efficient chemo-drugs, whose transition lines lie over UV range and the absorption bands benefit large cross-sections. A XeCl excimer laser is used to realize fluorescence emissions of the drugs at 308 nm. Those chemo-drugs may act as the diagnostic probe to characterize the interactions with biological media, as well as the fluorescence imaging of tumors associated with LIF spectroscopy during the cancer therapy.
2. Materials and methods
The high grade chemo-drugs are supplied by Cell Pharm GmbH and ODS Pharm GmbH. Ethanol (C2H5OH) from Merck is the solvent for paclitaxel with molecular weight of 46.07 g∕mol. The deionized water is used as the solvent for DOX and bleomycin as well. Furthermore, Rd6G (C28H31N2O3Cl) is supplied by Across Organics having MW = 479.01 g/mol.
The UV-VIS spectra, ranging 190-900 nm, are taken by a typical spectro-photometer equipped with plane holographic grating having 0.04 nm resolution.
Whole LIF measurements are carried out by the XeCl laser at 308 nm, 160 mJ/pulse, 10 Hz and 18 ns duration. Moreover, the Ava Spec spectrometer is exploited with 2048 pixels CCD array over 200-1100 nm with 0.4 nm resolution to record the fluorescence emissions. A cubic quartz cuvette (1 cm × 1 cm × 2 cm) is selected as the irradiation cell. The schematic arrangement for LIF data acquisition is similar to that of [14], where the detection angle is set perpendicular to the laser beam direction. The experiments were frequently repeated by taking the average over the spectral data after the successive laser shots to assess the statistical significance. Here, it was shown that the chemo-drugs of interest act as the fluorophore biomaterials.
3. Result and discussion
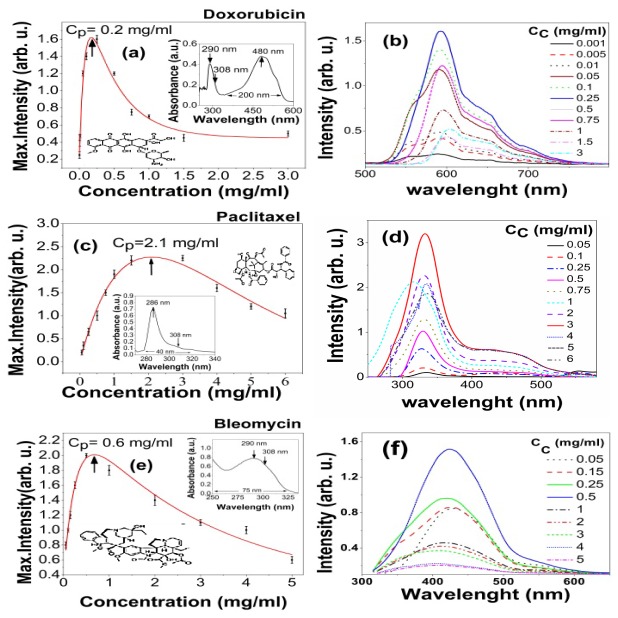
The UV-VIS absorption spectra determine the transition bands. The insets in the Figs. 1(a), 1(c) and 1(e) illustrate the spectral bands of DOX characterizing a couple of peaks at 480 and 296 nm as well as those of paclitaxel and bleomycin centered at 286 and 290 nm respectively.
Fig. 1.
The peak intensity in terms of concentration for (a) DOX, (c) Paclitaxel and (e) Bleomycin and corresponding UV-VIS spectra of the chemo-drugs as an inset. Laser induced fluorescence emission spectra due to various concentrations (0.001-3 mg/ml) for (b) DOX, (d) Paclitaxel and (f) Bleomycin. Whole data are obtained using the excitation by XeCl laser at 308 nm. In fact, Cp as a lucid characteristic parameter of chemo-drugs is inversely correlated with the extinction coefficient.
The UV absorption bandwidth of DOX is ~200 nm in visible range, whereas paclitaxel and beleomycin show ~40 nm and ~75 nm spectral widths over UV range respectively. Figures 1(b), 1(d) and 1(f) depict the fluorescence emission spectra in terms of the photosensitive concentrations ranging 0.001-6 mg/ml. Figures 1(a), 1(c) and 1(e) display the signal intensity as a function of the fluorophore concentration. This usually experiences a sharp rise and then follows a smooth decay surpassing concentration peak Cp. The latter is defined as a certain concentration at which max signal intensity occurs. It takes values of 0.2, 2.1 and 0.6 mg/ml attributing DOX, paclitaxel and bleomycin respectively. The elevated fluorescence signal arises from the larger population of the molecular transitions whereas the decrease of amplitude is mainly due to static / dynamic quenching including self-quenching, collisional effects, as well as the aggregation of monomers to dimmers, particularly at dense solutions. It is somehow expressed by Stern-Volmer equation:
| (1) |
where F0(F), K and [Q] ascertain the fluorescence intensity in the absence (presence) of quencher, quenching constant and the quencher density respectively [15]. In addition, the mean separation of the fluorophore molecules becomes relatively shorter at higher concentrations to allow a larger Forster resonance energy transfer leading to further self-quenching [15].
Table 1 tabulates the spectral properties due to the absorption and fluorescence of the chemo-drugs of interest including the peak absorption line λa, absorption bandwidth δλa, and selective excitation line at λex, emissive wavelength λf at peak of fluorescence and emissive bandwidth δλf, as well as the spectral shifts.
Table 1. Spectral properties of several chemo-drugs and Rd6G as the reference dye.
| Chemo-Drugs | λabs(nm) | δλabs(nm) | λex(nm) | λfl (nm) | δλfl (nm) | Spectral shift (nm) |
|---|---|---|---|---|---|---|
| Rd6G (reference) | 525 | 100 | 308 | 580 | 40 | 31 |
| Doxorubicin | 292 | 50 | 308 | 591.48 | 150 | 12 |
| Paclitaxel | 286 | 40 | 308 | 551.86 | 35 | 7 |
| Bleomycin | 304 | 75 | 308 | 445.03 | 250 | 0 |
Furthermore, not only we have excited DOX at 308 nm, but also at 532 nm using a SHG-Nd:YAG laser having the same fluences. The similar fluorescent spectra are given out nearly with the same peak intensity, mainly due to similar absorbance at both lines according to the inset of Fig. 1(a). On the other hand, the absorption peak of DOX lies around 488 nm of Ar + laser. Therefore, it is supposed to obtain the same characteristics LIF spectra, most likely with higher peak intensity. Consequently, paclitaxel and bleomycin do not show any sensible fluorescence emission because of their faint absorption rates at 488 nm regarding Fig. 1(c) and Fig. 1(e) respectively.
Neglecting the reabsorption effects and the fluorescence due to dimers, the fluorescence signal is proportional to the absorbed intensity Ia, quantum yield ηf and the ratio of the averaged frequency of fluorescence emission and at peak of excitation frequency , i.e.
| (2) |
The Stokes shift Δ, is defined as the certain difference between the absorption and emission lines such that:
| (3) |
Then, the fluorescence intensity is rewritten in the form of the below equation:
| (4) |
This attests the inverse relation of fluorescence signal with the Stokes shift [16]. The deviation from linearity mainly realizes in dense solutions.
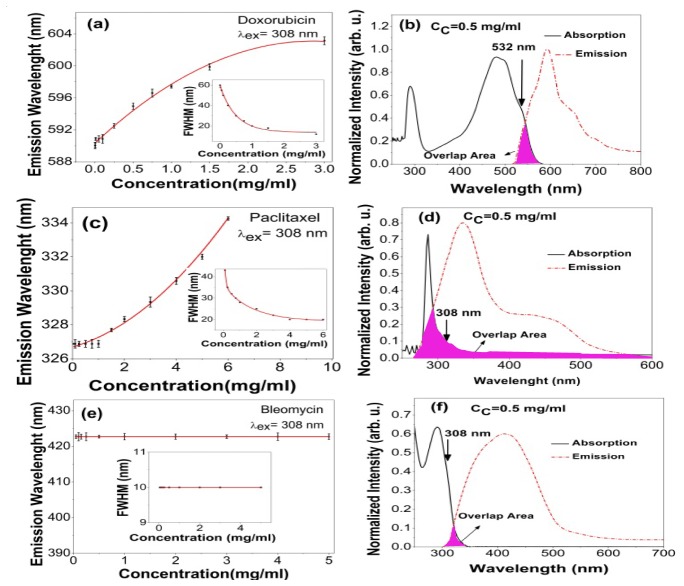
Figures 2(b), 2(d) and 2(f) display the absorption-emission spectra and the corresponding overlapping area for DOX, paclitaxel and bleomycin respectively. Moreover, the insets in the Fig. 2(a), 2(c) and 2(e) include the relative FWHM of spectral overlapping area as a function of dye concentration. In this way, the interplay between the Stokes shift and overlapping area are exhibited in a definitive way. Figures 2(a), 2(c) and 2(e) illustrate the emissive wavelengths in terms of concentrations where the red shift usually realizes as a function of fluorescence concentration [17]. Similarly, the emissive wavelengths follow an initial rise due to the reabsorption events and then exhibit a plateau at higher fluorophore concentrations. Consequently, DOX and paclitaxel delineate a sensible red shift of ~12 nm and ~7 nm respectively mainly due to their large overlapping area. The corresponding Stokes shift (emission bandwidth) denotes to be 111 nm (200 nm) and 48 nm (40 nm) respectively. Conversely, that of bleomycin demonstrates a negligible red shift mainly due to the larger Stokes shift 155 nm associated with a narrow emission bandwidth of 75 nm, leading to a negligible overlap-area, according to Fig. 2(e).
Fig. 2.
Overlapping area between absorption-emission spectra for (b) DOX (d) Paclitaxel and (f) Bleomycin after XeCl laser shots at 308 nm. Spectral shift versus drug concentration for (a) DOX (c) Paclitaxel and (e) Bleomycin and corresponding FWHM of spectral overlap area as a function of concentration as an inset. The spectral shifts attest that the reabsorption events accompany the agglomeration of fluorophore molecules at higher concentration. Stern-Volmer equation is usually used to determine the thresholds of agglomeration from monomer to dimmer, while it fails to explain the quenching effects when both reabsorption and agglomeration are available. Please note that Cc indicates the concentration of chemo-drugs.
On the other hand, the small Huang-Rhys S-parameter induces the larger red shift in DOX [18]. The plateau is a consequence of the competitive mechanisms, namely a couple of the reabsorption and agglomeration events, which usually occurs at denser solutions. At the higher DOX concentrations, the shrinkage of overlapping area refrains from further spectral shift by charging over into the plateau region according to the insets of the Fig. 2(a). Conversely, Paclitaxel undergoes an ever increasing red shift versus concentration according to Fig. 2(c). It is mainly due to the nature of broad overlapping area, stretching from 200 to 1100 nm, as shown in Fig. 2(d).
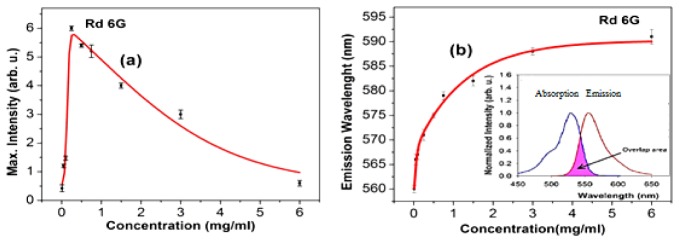
Furthermore, Fig. 3(a) plots the LIF signal versus concentration, while the inset displays the fluorescence spectra of the reference Rd6G emissions. Figure 3(b) depicts the emissive wavelength in terms of concentration and the inset shows the large overlapping area between absorption and emission spectra corresponding a small Stokes shift of 32 nm, as well.
Fig. 3.
(a) Corresponding peak intensity of Rd6G as a function of concentration, inset: Laser induced fluorescence spectra at various concentration, (b) Spectral shift in terms of Rd6G concentration, inset: overlapping area of the normalized absorption-emission spectra. The FWHM of absorption spectra is invariant while that of emission spectra gradually decreases as a function of the concentration emphasizing the commonalities between of DOX and Rd6G.
It is worth noting that the adopted Lambert- Beer equation holds the variation of the fluorescence intensity in terms of the concentration for three chemo-drugs of interest, where and ascertain the fluorescence intensity, proportionality factor, concentration, extinction coefficient, self-quenching parameters and the cuvette length of the biomaterial respectively [19]. The best fitting is performed over the scattered experimental data based on the least square method as shown in Figs. 1(a),1(c) and 1(e) in order to obtain α and k. Those values are determined to be 2.9, 0.2 and 1.8 ml/mg cm-1 as well as 0.87, 0.48 and 0.25 ml/mg cm-1 for DOX, paclitaxel and bleomycin respectively. Table 2 summarizes the experimental values given for the chemo-drugs of interest as well as reference Rd6G. In fact, four significant parameters i.e. Cp, k, α and the corresponding red shifts are taken into account to characterize the fluorescence properties.
Table 2. Fluorescence properties of chemo-drugs and Rd6G.
| Dye |
Mean Refractive index |
k (ml/mg cm−1) |
α (ml/mg cm−1) |
Cp (ml/mg) |
η |
|---|---|---|---|---|---|
| Rd6G(reference) | 1.36 | 0.34 | 2.45 | 0.25 | 95% |
| Doxorubicin | 1.33 | 0.87 | 2.90 | 0.2 | 9% |
| Paclitaxel | 1.38 | 0.48 | 0.20 | 2.1 | 1% |
| Bleomycin | 1.32 | 0.25 | 1.80 | 0.6 | 4% |
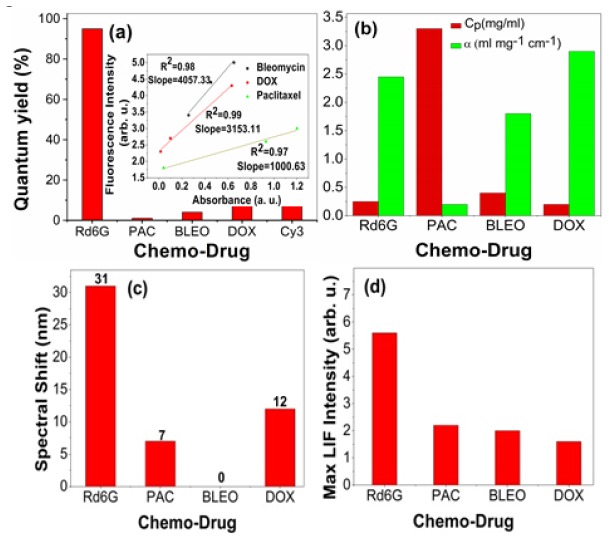
Moreover, the quantum yields are determined, similar to [20] based on the linearity of the fluorescence and absorption rates at a certain excitation line. Note that Rd6G, Cy3, DOX, bleomycin and paclitaxel take the values of 95%, 9%, 9%, 4% and 1% respectively as shown in Fig. 4(a). Typically, Cy3 is known as a biocompatible fluorophore whose value is comparable with that of DOX.
Fig. 4.
(a) quantum yields of chemo-Drugs of interest as well as those of a standard dye(Rd6G) and a typical biomaterial fluorophore Cy3, (b) Cp and α, (c) spectral shift and (d) Relative LIF intensity at Cp . Inset of Fig. 4(a): The linearity of fluorescence/ absorption rate such that the slopes lead to assess the quantum yields accordingly. Note: PAC: Paclitaxel and BLEO: Bleomycin and DOX: doxorubicin.
Similarly, Fig. 4(b) shows Cp and α for various chemo-drugs. In fact, paclitaxel gains the largest Cp attributing the smallest extinction cross-section, whereas DOX possesses the smallest Cp with highest excitation coefficient. This attests that the excited molecules of paclitaxel are populated at higher concentrations in a accordance with their smaller extinction rates [21].
Furthermore, Cp follows a descending order in the terms of paclitaxel>bleomycin>Rd6G>DOX equivalent to 2.1, 0.6, 0.25 and 0.2 mg/ml respectively. The largest Cp corresponds to low extinction coefficient α according to Table 2 and Fig. 4(b). The high quenching rate indicates for DOX (k = 0.87) respect to paclitaxel (k = 0.40) and bleomycin (k = 0.25) in accordance with Fig. 1, while that of Rd6G is closer to bleomycin. Regarding Fig. 4(c), the largest red shift appears to be ~31 nm for Rd6G solution, while DOX and paclitaxel show smaller spectral shifts of ~12 nm and 7 nm respectively. Figure 4(d) depicts the fluorescence intensities of Rd6G, Paclitaxel, bleomycin and DOX at Cp in the form of a descending order. In fact, Rd6G exhibits the strongest emission, whereas DOX demonstrates the relatively weakest signals at Cp.
4. Conclusion
Eventually, a novel optical database is presented regarding the LIF spectra of the chemo-drugs of interest to act as the notable biocompatible fluorophores. These findings may be helpful to investigate the dynamics of carcinoma treatment. The optical characteristics may realize the simultaneous cancer diagnosis and treatment including the fluorescence imaging/spectroscopy during the chemotherapy, identifying the interactions of chemo-drugs with the remnant of cancerous tissues.
References and links
- 1.Cobley C. M., Au L., Chen J., Xia Y., “Targeting gold nanocages to cancer cells for photothermal destruction and drug delivery,” Expert Opin. Drug Deliv. 7(5), 577–587 (2010). 10.1517/17425240903571614 [DOI] [PMC free article] [PubMed] [Google Scholar]
- 2.Anwar S., Firdous S., Rehman A., Nawaz M., “Optical diagnostic of breast cancer using Raman, polarimetric and fluorescence spectroscopy,” Laser Phys. Lett. 12(4), 045601 (2015). 10.1088/1612-2011/12/4/045601 [DOI] [Google Scholar]
- 3.Cordero J., Tomashefsky P., “Native cancerous and normal tissue,” J. Quantum. Electron. 20(12), 1507–1511 (1984). 10.1109/JQE.1984.1072322 [DOI] [Google Scholar]
- 4.Hayat M. A., Methods of Cancer Diagnosis, Therapy, and Prognosis (Springer, 2008). [Google Scholar]
- 5.Bigio I. J., Bown S. G., “Spectroscopic sensing of cancer and cancer therapy: current status of translational research,” Cancer Biol. Ther. 3(3), 259–267 (2004). 10.4161/cbt.3.3.694 [DOI] [PubMed] [Google Scholar]
- 6.Olivo M., Ho C. J. H., Fu C. Y., “Advances in fluorescence diagnosis to track footprints of cancer progression in vivo,” Laser Photonics Rev. 7(5), 646–662 (2013). 10.1002/lpor.201200059 [DOI] [Google Scholar]
- 7.Valeur B., Molecular Fluorescence Principles and Application (Wiley-VCH Verlag Gmbh, 2001). [Google Scholar]
- 8.Medarova Z., Pham W., Farrar C., Petkova V., Moore A., “In vivo imaging of siRNA delivery and silencing in tumors,” Nat. Med. 13(3), 372–377 (2007). 10.1038/nm1486 [DOI] [PubMed] [Google Scholar]
- 9.Angeloni L., Smulevich G., Marzocchi M. P., “Absorption, fluorescence and resonance Raman spectra of adriamycin and its complex with DNA,” Spectrochim. Acta 38A(2), 127–213 (1982). [Google Scholar]
- 10.Weber P., Wagner M., Schneckenburger H., “Cholesterol dependent uptake and interaction of doxorubicin in mcf-7 breast cancer cells,” Int. J. Mol. Sci. 14(4), 8358–8366 (2013). 10.3390/ijms14048358 [DOI] [PMC free article] [PubMed] [Google Scholar]
- 11.Changenet-Barret P., Gustavsson T., Markovitsi D., Manet I., Monti S., “Unravelling molecular mechanisms in the fluorescence spectra of doxorubicin in aqueous solution by femtosecond fluorescence spectroscopy,” Phys. Chem. Chem. Phys. 15(8), 2937–2944 (2013). 10.1039/c2cp44056c [DOI] [PubMed] [Google Scholar]
- 12.Trynda-Lemiesz L., Luczkowski M., “Human serum albumin: spectroscopic studies of the paclitaxel binding and proximity relationships with cisplatin and adriamycin,” J. Inorg. Biochem. 98(11), 1851–1856 (2004). 10.1016/j.jinorgbio.2004.08.015 [DOI] [PubMed] [Google Scholar]
- 13.Chien M., Grollman A. P., Horwitz S. B., “Bleomycin-DNA interactions: fluorescence and proton magnetic resonance studies,” Biochemistry 16(16), 2641–2647 (1977). 10.1021/bi00635a021 [DOI] [PubMed] [Google Scholar]
- 14.Bavali A., Parvin P., Mortazavi S. Z., Mohammadian M., Mousavi Pour M. R., “Red/blue spectral shifts of laser-induced fluorescence emission due to different nanoparticle suspensions in various dye solutions,” Appl. Opt. 53(24), 5398–5409 (2014). 10.1364/AO.53.005398 [DOI] [PubMed] [Google Scholar]
- 15.Lakowicz J. R., Principles of Fluorescence Spectroscopy (Springer, 2006). [Google Scholar]
- 16.Georges J., “Deviations from Beer’s law due to dimerization equilibria: theoretical comparison of absorbance, fluorescence and thermal lens measurements,” Spectrochim. Acta Part A Mol. Spectrosc. 51(6), 985–994 (1995). [Google Scholar]
- 17.Bavali A., Parvin P., Mortazavi S. Z., Nourazar S. S., “Laser induced fluorescence spectroscopy of various carbon nanostructures (GO, G and nanodiamond) in Rd6G solution,” Biomed. Opt. Express 6(5), 1679–1693 (2015). 10.1364/BOE.6.001679 [DOI] [PMC free article] [PubMed] [Google Scholar]
- 18.Huang K., Rhys A., “Theory of light absorption and non-radiative transitions in F-centres,” Proc. R. Soc. London. Ser. A. 204(1078), 406–423 (1950). [Google Scholar]
- 19.Memoli A., Palermiti L. G., Travagli V., Alhaique F., “Effects of surfactants on the spectral behaviour of calcein (II): a method of evaluation,” J. Pharm. Biomed. Anal. 19(3-4), 627–632 (1999). 10.1016/S0731-7085(98)00229-5 [DOI] [PubMed] [Google Scholar]
- 20.M. W. Allen, “Measurement of fluorescence quantum yields,” Thermo Sci. 1–4 (2010).
- 21.Penzkofer A., Leupacher W., “Fluorescence behaviour of highly concentrated rhodamine 6G solutions,” J. Lumin. 37(2), 61–72 (1987). 10.1016/0022-2313(87)90167-0 [DOI] [Google Scholar]


