Abstract
Since 1972, the World Health Organization (WHO) has declared noise as a pollutant. Over the last decades, the quality of the urban environment has attracted the interest of researchers due to the growing urban sprawl, especially in developing countries. The objective of this study was to evaluate the effects of noise exposure in six urban soundscapes: Areas with high and low levels of noise in scenarios of leisure, work, and home. Cross-sectional study. The study was conducted in two steps: Evaluation of noise levels, with the development of noise maps, and health related inquiries. 180 individuals were interviewed, being 60 in each scenario, divided into 30 exposed to high level of noise and 30 to low level. Chi-Square test and Ordered Logistic Regression Model (P < 0,005). 70% of the interviewees reported noticing some source of noise in the selected scenarios and it was observed an association between exposure and perception of some source of noise (P < 0.001). 41.7% of the interviewees reported some degree of annoyance, being that this was associated with exposure (P < 0.001). There was also an association between exposure in different scenarios and reports of poor quality of sleep (P < 0.001). In the scenarios of work and home, the chance of reporting annoyance increased when compared with the scenario of leisure. We conclude that the use of this sort of assessment may clarify the relationship between urban noise exposure and health.
Keywords: Annoyance, road traffic, sleep disturbance, urban noise, urban soundscapes
Introduction
Urban noise can be considered one of the main sources of pollution. In 1972, the World Health Organization (WHO) declared noise as a pollutant.[1,2] In that same decade, the World Soundscape Project, developed by Murray Schafer in Canada, asserted the importance of improving the quality of the urban soundscape, due to the negative effects of noise pollution on human health.[3]
Nowadays, acoustical environmental quality in urban areas is threatened. The urban environment is composed of several audible sources: Traffic (road, rail, and air), industrial facilities, civil construction and social activities (parties, fairs and open air markets, and residential noise). These all contribute to the conversion of the soundscape in noise pollution. Road traffic noise is considered the main source of noise transportation in large urban cities and the most worrisome when it comes to annoyance.[4]
Noise pollution can be considered one of the main agents of loss of environmental and life quality in a metropolis and its dissemination pushed the boundaries of industrial facilities, spreading through the streets and also for leisure activities, moments of rest and work. However, its perception is based on the interrelationship between person, place, and activity in space and time.[5]
Schafer introduced the concept of soundscape as a scope to thinking beyond the noise levels, considering human experience in the environment and its cultural dimension. Soundscape research means to focus on the meaning of sounds and its implicit assessments, and understanding perceptual effects. Soundscape approaches evaluate the sound in context, which can influence environmental noise perception, such as during the leisure, at home or at work in different exposures (noise levels).[6]
The effects of exposure to noise on the human organism are subject to the specific characteristics of the noise, such as frequency, intensity, and exposure time, and also individual susceptibility. Taking into account the fact that human beings are continuously exposed to noise in different daily activities, it is important to develop tools for evaluating the annoyance occurring during leisure time, at work and at home.[7]
In 2002, the European Union adopted the Directive 2002/49/CE20[8] regarding the assessment and management of environmental noise, with the goal of controlling and reducing sound pollution using a common approach and avoiding or preventing the harmful effects of noise exposure. The EU established the enforcement of developing strategic noise maps that should estimate the exposure to outside ambient noise, based on assessment methods in agreement to the EU levels. The noise maps constitute important intervention tools, for they allow the identification of overexposed areas and the quantification of the exposed population.
This paper presents an evaluation of soundscape, bearing in mind that sensations and perceptions may differ depending on the activity performed, even considering individual and subjective questions. Thus, we selected three different daily activities: Leisure, work, and rest, under the influence of noise sources. Noise levels were evaluated based on road traffic noise, given that this is the primary source of community noise.
Methods
This study was conducted in two stages: 1) three scenarios (leisure time, work, and at home) were selected in two exposure areas (exposed and non-exposed based on road traffic noise) and 2) health inquiries were conducted in these six urban soundscapes.
Exposed and non-exposed areas
The study was conducted in the city of Porto, which is the second-largest city of Portugal, with an area of 41.66 km2 and a population of 237,000 inhabitants. This city is administratively divided into 15 parishes [Figure 1].
Figure 1.
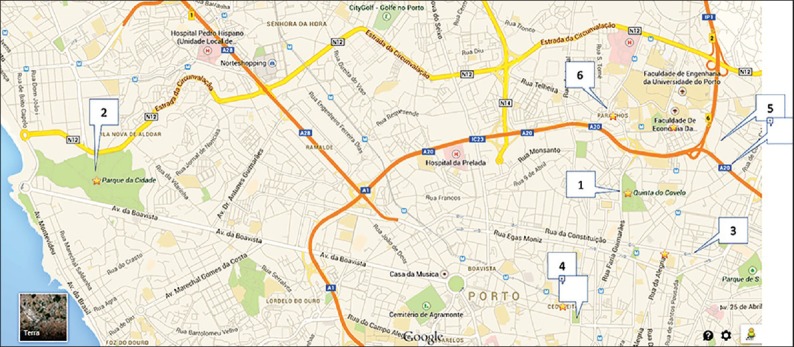
Selected Zones (1 to 6) in the Porto city, Portugal, 2012. Source: Google Maps
Two areas representative of the exposure categories were selected within each scenario. Areas influenced by traffic noise were chosen to represent the exposed areas and areas with little influence from traffic noise were selected for the non-exposed areas. Noise maps were developed to evaluate exposure to road traffic noise in all of these areas.
Noise maps are descriptors of external environmental noise, expressed by means of indicators, which are determined by reference periods and represented by lines that indicate the identical rating levels (isophone lines) and limit the areas to which a specific class of values expressed in decibels (dB[A]) corresponds. The following noise indicators were used: (Lden) for the period of day-evening-night, the noise indicator for overall annoyance, and (Ln) for the nighttime period, the noise indicator for sleep disturbance, both in dB(A).[8]
The development of the noise maps was based on the allocation classification criteria for each area. Areas that are allocated for residential use, as well as schools, hospitals, and public leisure areas were classified as sensitive zones. Areas where other uses are allowed, such as commerce and industry, were classified as mixed zones.[9]
For the scenarios of leisure and work, the noise maps were based on the Lden indicator and for the home scenario the indicator used was Ln. The development of the noise maps was divided in three steps: Preparation, modeling, and calibration. During preparation, the selected areas were approached with fieldwork for the identification of noise sources, measurements, and counting. The soundscape modeling was done based on the calculation methods of indicators Lden and Ln : Road traffic noise prediction (NMPB-Routes-96),[8] during the reference periods with the support of Cadna-A software.[8] The last step was the calibration to validate the simulation performed by the software.
The calibration involved the selection of measurement points, which was done with the support of the Noisemeter Bluesolo 01dB Metravib, properly calibrated. All measurements were performed using the response time weighting S (slow) to allow better reproducibility, respecting weather conditions, and following the rules regarding the placement of 1.20 m relative to the ground, using the tripod and at least 3.5 m from any reflective screen, including walls and façades. The measurements were performed in different weekdays for an approximate period of 20 minutes to avoid measurement bias due to possible changes in traffic flow because of the presence of traffic lights, in each of the three periods: Day, evening, and nighttime, following the NP ISO 1996 Norm, parts 1 and 2.[10]
The noise maps are representative of the acoustic situation in a determined region during the period of 24 h. Due to the specificities of each activity in the urban soundscapes, energetic averages representative of indicators, Lden and Ln, were calculated.
To calculate the energetic average in the leisure scenario, a route with a higher probability of being used by the urban park-goers was designed. This route was based on walking paths, areas to rest and to practice physical activity. Outside this route there were areas with dense vegetation. The exposure levels were calculated for this route. In the work scenario, specific points at the façades of commercial buildings were selected in the streets and in the home scenario the points were at the façade of the selected buildings. The values of these energetic averages were compared with the established limits for the mixed and sensitive zones and the areas were then defined as exposed or non-exposed.
Urban soundscape: Leisure time
The selected urban parks included an exposed park, Quinta do Covelo, and a non-exposed park, Parque da Cidade.
Quinta do Covelo is a green area of about eight hectares located amidst a residential area in the ancient parish of Paranhos and its boundaries are four streets: Faria Guimarães St., Bolama St., Monte de São João St., and Álvaro de Castelões St. The park is also very close to the exit of Via de Cintura Interna (VCI). The VCI is a 21 km long highway of fast circulation, which supports an average daily traffic of 21,000 vehicles and surrounds the central area of Porto. Therefore, this park is under the influence of vehicle traffic and is also close to two subway stations of the Metro do Porto [Area 1 — Figure 1].
The Parque da Cidade, located in the parish of Nevogilde is the largest urban park in Portugal, with an extension of 83 green area hectares and a long network of pathways (around 10 km). Although three streets (Estrada da Circunvalação, Boa Vista Avenue, and Via do Castelo do Queijo) encircle the Parque da Cidade, its broad extension minimizes the influence of these sources [Zone 2 — Figure 1].
Urban soundscape: At work
The selected streets were located in Baixa do Porto, which comprises the central area of the city, where the largest commercial streets are. The exposed streets were: 31 de Janeiro St., Passos Manuel St., and Sá da Bandeira St., for they are located near sources of urban traffic: Both highways and railways [Zone 3 — Figure 1]. The non-exposed street was located in a zone that allows only pedestrian traffic, Santa Catarina St. [Zone 4 — Figure 1].
The selected trade stores were those with open doors facing the highways in order to verify the direct impact of noise from this source in attention and concentration activities. Thus, stores in shopping centers and commercial centers were excluded.
Urban soundscape: At home
The selected residential areas were two low-income housing neighborhoods in the city of Porto. The Outeiro neighborhood, located in the parish of Paranhos is comprised of 13 residential buildings where 418 families live. Five buildings with their façades facing the VCI were selected, each one three-stories tall having two apartments per floor, in a total of eight apartments. Thirty families were interviewed [Zone 5 — Figure 1].
VCI is marked by the existence of buildings that predate the Regulatory Urban Plan (1948), an urban master plan that proposed the construction of this highway as a solution to the traffic demands in the city.
The Carriçal neighborhood, also located in the parish of Paranhos is comprised of 11 residential buildings, each one four-stories tall having two apartments per floor, in a total of ten apartments where 250 families live. For comparison purposes, five buildings located in the internal area of the neighborhood were selected. The number of interviewed families was also thirty [Zone 6 — Figure 1].
Health survey
A cross-sectional study was conducted from March to May 2012 to evaluate the perception and annoyance in the urban soundscapes: During the leisure time, at home, and at work in different exposures (noise levels). The study population consisted of adult individuals older than 20 years old who agreed to answer a questionnaire. They were given instruction pamphlets describing the nature and goal of the study.
In each scenario, three visits were made. In the leisure scenario, the interviews were conducted during the week and on the weekends to ensure the representativeness of the sample. In the work scenario, the visits to commercial establishments were made during the slowest hours (right after opening, in the mid-morning, and in the mid-afternoon). In the home scenario, with the support of the Camera do Porto (Porto City Council), the study was announced by the administrators of the selected housing projects so that the field workers could access the households easily. The interviews were made during the evening and on weekends.
The sampling process showed peculiarities inherent to the characteristics of the urban soundscapes and the type of study, which aimed at comparing the exposure areas. Therefore, in the leisure scenario the sample was selected randomly and included 60 participants. The sample size was relatively small due to the difficulties in getting collaboration from the park-goers, who were performing physical or leisure activities and were not available for answering the questionnaire. In commerce, stores with staff of different nationalities such as Chinese and Indian were excluded, due to difficulty with language comprehension. There was a high rate of refusal, mainly in stores that were part of a large network, where there was camera monitoring and the employees claimed not to be allowed to answer any type of survey. Approximately 90 commercial establishments were visited and 60 interviews were made, leading to approximately 30% of loss. In the home scenario the losses, about 25%, were due to the fact that no family member could be reached after a third visit.
For data collection, three types of questionnaires were developed for each urban soundscape, which were divided in sections:
-
a)
Demographic characteristics, sex, age and marital status;
-
b)
Noise source perception, including road, rail, and air traffic and neighborhood noise;
-
c)
Annoyance in relation to noise sources (yes or no and degrees, little, moderate, or highly);
-
d)
Other effects of noise exposure, including quality of sleep, perception regarding hearing, and the presence of chronic illnesses; and
-
e)
Perception regarding the environmental problems and noise pollution in particular. The researchers themselves conducted the questionnaires.
The demographic profile of the population according to the perception of noise sources and environmental problems, as well as the effects of exposure in the urban soundscape was drawn based on the descriptive analysis. To identify associations between exposure and perception of sources and potential effects of this noise exposure in the urban soundscape, the Chi-square test was used. A multivariate ordered logistic regression model, a regression model of proportional odds, was used to identify independent factors associated with reports of annoyance regarding noise.
Results
Validation of exposed and non-exposed areas
In all points measured, the difference between Leq measured and Leq calculated was lower than 4.6 dB, thus validating the calculated map (WG-AEN, 2002).[11]
Figures 2–6 show the noise maps of each urban soundscape, from which it was possible to validate the exposure areas. In Figures 2 and 3, the chosen route for calculating the energetic averages in the urban parks can be observed, followed by the related noise maps. It was observed that Quinta do Covelo is in an overexposed area and Parque da Cidade in a non-exposed area.
Figure 2.
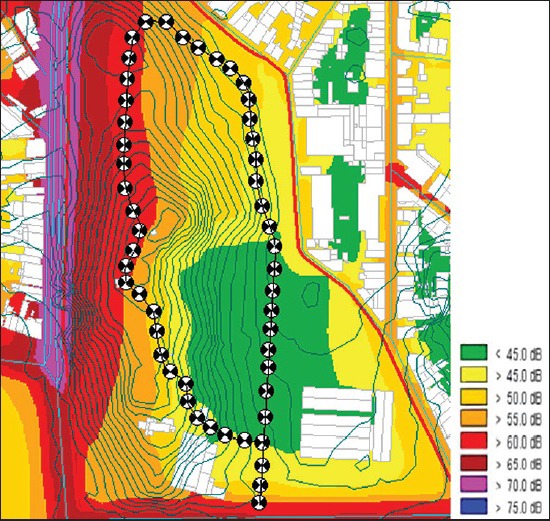
Urban soundscape - Leisure - Selected route and their noise map in exposed area: Quinta do Covelo. Porto, Portugal, 2012
Figure 6.
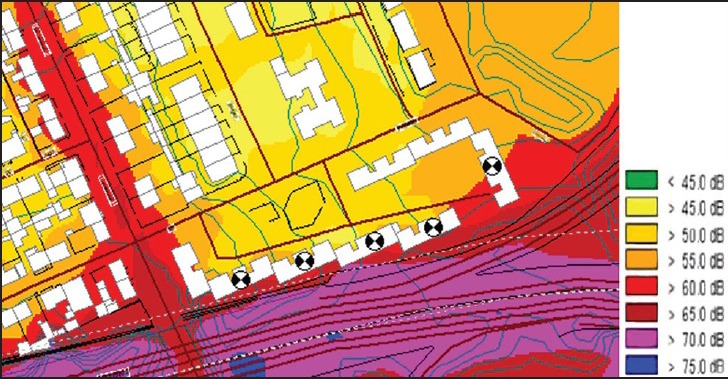
Urban soundscape — Home — Evaluated buildings in the selected housing project in exposed area: Outeiro neighborhood and their noise map. Porto, Portugal, 2012
Figure 3.
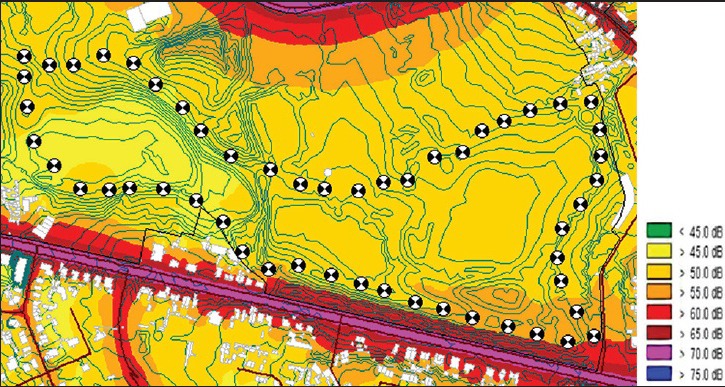
Urban soundscape — Leisure — Selected route and their noise map in non-exposed area: Parque da Cidade. Porto, Portugal, 2012
The façades of the selected commercial buildings as well as the related noise maps are presented in Figures 4 and 5. Judging from them, it is possible to infer that streets 31 de Janeiro, Passos Manuel, and Sá da Bandeira are overexposed and Santa Catarina Street is located in a non-exposed area.
Figure 4.
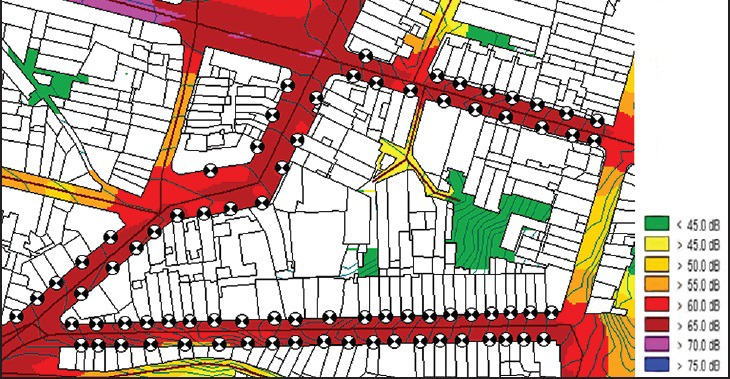
Urban soundscape — Work — Façades of commercial buildings evaluated and their noise map in exposed area, Streets: 31 de janeiro, Sá da Bandeira and Passos Manuel. Porto, Portugal, 2012
Figure 5.
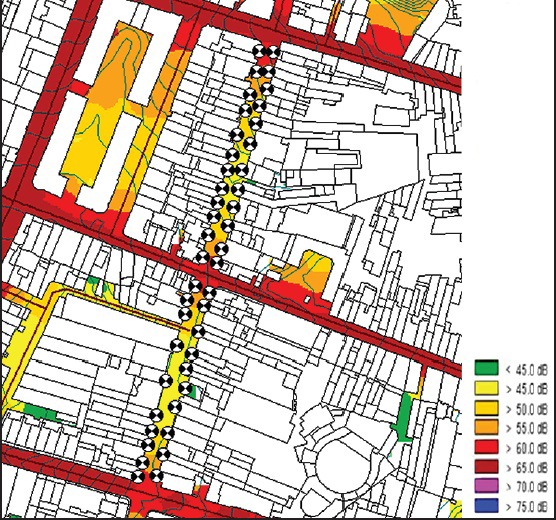
Urban soundscape — Work — Façades of commercial buildings evaluated and their noise map in non-exposed area, Santa Catarina Street. Porto, Portugal, 2012
The selected buildings in the home scenario as well as the noise maps in the selected neighbourhoods are presented in Figures 6 and 7. It is possible to verify that the Outeiro neighborhood is overexposed and the Carriçal neighborhood is in a non-exposed area.
Figure 7.
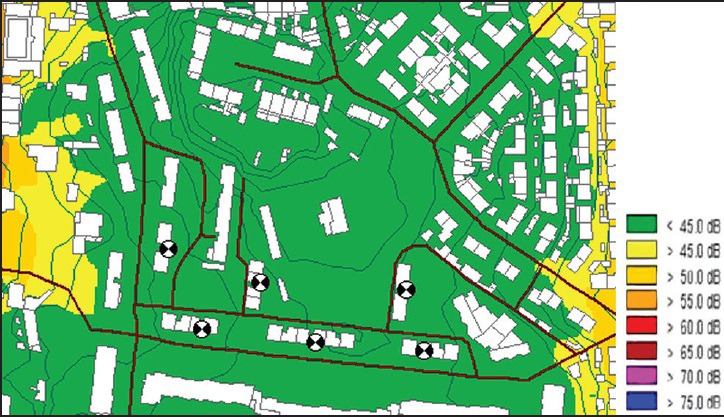
Urban soundscape — Home — Evaluated buildings in the selected housing project in non-exposed area: Carriçal neighborhood and their noise map. Porto, Portugal, 2012
The energetic averages calculated in each scenario also allow the inference that the areas chosen to be representative of the exposed areas have exceeded the legal limits while the non-exposed areas had values below these limits. Therefore, it is possible to conclude that the selection criteria used in this study were good enough to obtain representativeness of the noise exposure areas [Table 1].
Table 1.
Exposure areas and energetic average in urban soundscapes (leisure, work and home). Porto, Portugal, 2012
| US | Zone classification* | Legal limit | Energetic average Lden (dB (A)) | Energetic average Ln (dB (A)) | Areas | |||
|---|---|---|---|---|---|---|---|---|
| E | NE | |||||||
| Mixed | Sensitive | Lden dB (A) | Ln dB (A) | |||||
| Leisure | ||||||||
| Quinta do Covelo | X | 55 | 45 | 63,3 | — | XX | ||
| Parque da Cidade | X | 55 | 45 | 52,6 | — | X | ||
| Work | ||||||||
| Streets: 31 de Janeiro, Passos Manuel and Sá da Bandeira | X | 65 | 55 | 67,5 | — | XX | ||
| Santa catarina street | X | 65 | 55 | 57,8 | — | X | ||
| Home | ||||||||
| Outeiro neighborhood | X | 65 | 55 | 72,8 | X | |||
| Carriçal neighborhood | X | 65 | 55 | 48,5 | X | |||
US = Urban soundscapes, *According to the ABNT, 2000, Key: E = Exposed area, NE = Non-exposed area
Health survey
One hundred and eighty individuals were interviewed, 60 in each of the three defined scenarios. The interviewees’ average age was 52-years-old (IC95%: 49.54-54.49). The majority were female (69.4%), married or in a common-law marriage (60.3%), and reported having a college degree (55%) [Table 2].
Table 2.
Demographic characteristics, perception of noise sources, annoyance and other effects caused by exposure to noise, and perception of environmental problems according to the interviewees in each urban soundscape (leisure, work and home). Porto, Portugal, 2012
| Variables | Leisure (%) | Work (%) | Home (%) | Total population (%) |
|---|---|---|---|---|
| Demographic characteristics | ||||
| Average age (sd) | 55.0 (2.0) | 43.6 (1.6) | 57.5 (2.4) | 52.0 (1.2) |
| Sex | ||||
| Male | 41.7 | 18.0 | 31.7 | 30.6 |
| Female | 58.3 | 82.0 | 68.3 | 69.4 |
| Marital status | ||||
| Single | 16.9 | 23.3 | 20.1 | 20.1 |
| Married | 69.5 | 61.7 | 48.3 | 60.3 |
| Divorced | 6.8 | 13.3 | 8.3 | 9.5 |
| Widowed | 6.8 | 1.7 | 23.3 | 10.1 |
| Education | ||||
| College degree | 76.7 | 41.7 | 45.0 | 55.0 |
| No college degree | 23.3 | 58.3 | 55.0 | 45.0 |
| Perception of noise sources | ||||
| No | 35.0 | 15.0 | 40.0 | 30.0 |
| Yes | 65.0 | 85.0 | 60.0 | 70.0 |
| Quality of sound in the environment | ||||
| Silent | 65.0 | 46.7 | 53.3 | 55.0 |
| Moderately noisy | 31.7 | 33.3 | 15.0 | 26.7 |
| Noisy | 3.3 | 20.0 | 31.7 | 18.3 |
| Annoyance | ||||
| None | 80.0 | 51.6 | 43.3 | 58.3 |
| Little | 20.0 | 26.7 | 8.4 | 18.3 |
| Moderate | — | 10.0 | 10.0 | 6.7 |
| Highly | — | 11.7 | 38.3 | 16.7 |
| Other effects | ||||
| Hearing | ||||
| Excellent | 10.0 | 15.0 | 13.3 | 12.8 |
| Good | 73.3 | 81.7 | 71.7 | 75.6 |
| Bad | 16.7 | 3.3 | 15.0 | 11.7 |
| Chronic Illnesses | ||||
| No | 68.3 | 71.7 | 66.7 | 68.9 |
| Yes | 31.7 | 28.3 | 33.3 | 31.1 |
| Perception of noise as an environmental problem | ||||
| No | 1.7 | 8.3 | 13.3 | 7.8 |
| Yes | 98.3 | 91.7 | 75.0 | 88.3 |
| UM | — | — | 11.7 | 3.9 |
UN = Unknown, sd = Standard deviation
They considered their hearing to be good (75.6%), although 62% had never been subjected to a hearing exam. The presence of chronic illnesses was referred by 31.3% of the interviewees [Table 2].
Considering the perception of noise sources in the different urban soundscapes, including noise by highway, railway, and air transport and neighborhood noise, 70% of the individuals reported noticing some source of noise in the selected scenarios. An association between exposure and noise source perception in the urban soundscapes was observed (P < 0.001).
With regard to the annoyance caused by the urban noise in all urban soundscapes, 41.7% mentioned feeling some degree of annoyance and, among them, 16.7% felt highly annoyed. An association between exposure and report of annoyance was observed (P < 0.001).
The majority of the interviewees considered noise as an environmental problem (88%) and believed that noise exposure can cause or aggravate health conditions [84%, Table 2]. When questioned about their concerns regarding environmental problems, 37.2% reported seeing air pollution as the most serious concern nowadays.
Urban soundscape: Leisure time
The majority (91.7%) of individuals mentioned attending the parks for recreation, although the park has many facilities focused on physical activity. In relation to frequency, 40.7% mentioned a minimum attendance of three times a week.
The majority of interviewees (65%) also mentioned noticing noise sources within the parks, being 31.7% relative to the highway noise and 23.3% the aircraft noise. Despite this perception, 65% reported considering the park environment quiet and 20% reported little annoyance [Table 2]. No statistically significant association between exposure and perception of noise (P = 0.79) and annoyance (P = 0.19) was observed.
When questioned about the degree of importance in choosing a silent environment for leisure activities, 88% classified this as very important.
Urban soundscape: At work
The majority of traders have worked in the same establishment for over six years (65%), used some means of transport (bus, subway, and/or train) to get to the workplace (70%), and took less than 30 minutes in the commute from home to work (60%).
85% of the interviewees reported noticing noise sources in the workplace and, among them, 50% reported railway noise, followed by noise by liberal professionals, as is the case of musicians (25%). Association was observed between this urban soundscape and neighborhood source (P = 0.01).
When questioned about the quality of sound in the work environment, 53.3% considered the environment noisy, among them, 20% found it extremely noisy. The presence of chronic illnesses was referred by 28.3% of interviewees. However, no statistically significant association between exposure and the presence of chronic illness was observed.
Concerning the annoyance caused by noise, 48.3% of traders reported some degree of annoyance caused by the perceived noise, being that 11.7% reported to be highly annoyed by noise. When questioned about the possibility of having adapted themselves to the urban noise, 97% reported believing this hypothesis to be correct [Table 2].
A statistically significant association between exposure and perception of noise sources (P = 0.01) was observed, as well as the report of some degree of annoyance due to the noise (P = 0.07).
UrbanUrban soundscape: At home
Among the interviewees, 78.3% have lived for over six years in the selected neighbourhoods. Regarding their perception of noise sources inside their homes, 60% referred noticing noise sources and 48.3% of these were related to the highway noise. The perception that noise levels became elevated during night-time was reported by 43.3%. An association between exposure and the reports of perceiving elevated noise levels during the night was observed (P < 0.001).
The majority (53.3%) considered the home as a silent location. With regard to the annoyance caused by the perceived sources of noise, 56.7% felt some degree of annoyance, and 38.3% of them felt highly annoyed.
Statistically significant associations between exposure and the following reports were observed: Considering the home a noisy location (P < 0.001), noticing sources of noise inside the home (P < 0.001), and feeling some degree of annoyance due to this noise (P < 0.001).
A third (33.3%) of the interviewees and no statistically significant association between exposure reported chronic illnesses and the presence of chronic illnesses was observed [Table 2].
An ordinal logistic regression was performed to identify factors associated with annoyance, adjusted by the following variables: Gender, age, and education. It was observed that in the work scenario the chance of reporting significant annoyance was tripled when compared with the leisure scenario (OR: 3.51; IC95%: 1.31-9.39), while in the home scenario, this chance was the quadruple of that of the leisure scenario (OR: 8.40; IC95%: 3.04-23.19). These results suggest the importance of considering different urban soundscapes when evaluating the effects of noise exposure [Table 3].
Table 3.
Multivariate ordered logistic regression model for the annoyance regarding noise. Porto, Portugal, 2012
| Annoyance regarding noise | OR* | Std Err | IC 95% | P** |
|---|---|---|---|---|
| US | <0.001 | |||
| Leisure | 1.00 | — | — | |
| Work | 3.51 | 2.50 | 1.31-9.39 | |
| Home | 8.40 | 4.11 | 3.04-23.19 | |
| Exposure | 0.022 | |||
| Non-exposed | 1.00 | — | — | |
| Exposed | 4.54 | 3.86 | 2.11-9.79 | |
| Qualityof sound | <0.001 | |||
| Silent | 1.00 | — | — | |
| Noisy | 12.87 | 4.84 | 4.57-36.22 |
US = Urban soundscapes, *Adjusted for the variables = Gender, age, and education, **Obtained from the Wald test
Other factors associated with reports of highly annoyance by noise were being exposed to noise and considering the quality of sound in the urban soundscape poor. It was observed that individuals who were in the urban soundscape selected as exposed presented approximately four times the chance of reporting significant annoyance by noise when compared with the individuals of non-exposed urban soundscape (OR: 4.54; IC95%: 2.11-9.79). Moreover, the individuals who reported considering the environment in the urban soundscape noisy presented approximately 12 times the chance of reporting significant annoyance when compared with those who considered the environment quiet (OR: 12.87; IC95%: 4.57-36.22).
By observing Figure 8, it is possible to suggest the existence of a dose-response relationship between the increase of exposure levels in Lden and Ln dB (A) due to road traffic noise and increased degree of reported annoyance by noise. That means the degree of annoyance regarding road traffic noise increases according to the increase in levels of exposure [Figure 8].
Figure 8.
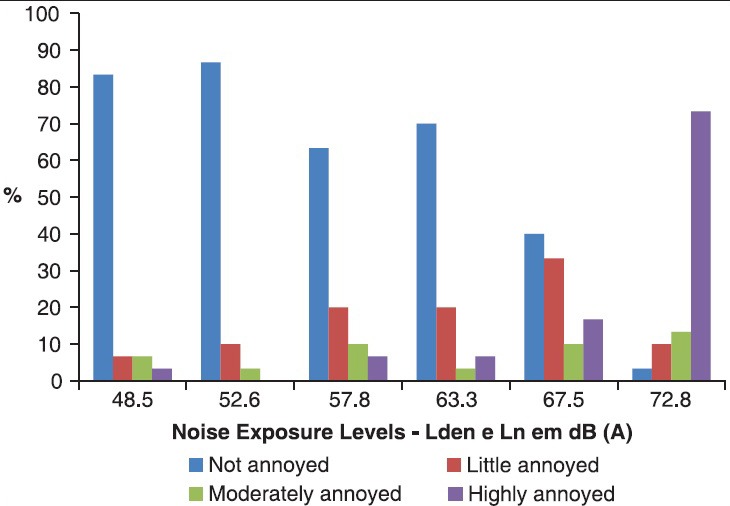
Annoyance in relation to noise exposure (Lden e Ln). Porto, Portugal, 2012
Discussion
The importance of noise maps to represent the acoustic situation deriving from noise sources is unquestionable. However, using noise maps as a strategic tool for prevention of non-auditory effects of exposure to noise may be disputed. The Lden indicator may not be representative of exposure levels in all urban soundscapes and the Ln indicator is correlated with the home scenario. Moreover, the reaction of individuals when exposed to noise is also conditioned to noise sources by social activities.
It is worth mentioning that the calculation of noise maps from the Lden indicator represents the acoustic behavior of a particular area within the period of 24 h. Even though there is a calculation of the energetic average, it is impossible to determine the time in which the individual is exposed to the detected overexposed levels.
The statistical analysis of results obtained made it possible to conclude that the assessment of different scenarios (urban soundscapes) can represent an important tool when it comes to verify the reaction of individuals to urban noise. Perceptions regarding to the presence of noise sources and annoyance were reported in distinct manners throughout the different activities in different sound levels exposure.[5]
In the leisure scenario, regardless of the exposure, noise sources were permanently perceived, though no statistically significant association with the effects of this exposure was found. The leisure scenarios, like urban parks, constitute a combination of positive sounds (sounds of nature and birds) and adverse sounds (such as road traffic noise, which interferes with perception and sensations generated during the conduct of activities in these scenarios).[7]
The results observed in the leisure scenario showed that the majority of individuals (65%) perceive noise sources in urban parks, although they consider the environment silent and does not report annoyance. Another study by Zannin, 2003[12] revealed a similar observation. He described that, despite the high levels of noise in the Botanical Garden of Curitiba — PR, Brazil, 52% of interviewees considered the park a calm environment and reported that the noise did not cause major disturbances.
Measures obtained showed that in both parks (exposed and non-exposed to road traffic noise) the sound levels were near or above the legal limit (55dB[A]), according to the Brazilian legislation. The important function played by parks in preserving or promoting the health of users should be prioritized, aiming to maintain quality of acoustic environment in these scenarios, so as not to miss or be less efficient the feeling of tranquility and pleasure that aims in leisure activities.[13]
In the work scenario, 53.3% of traders considered the work place noisy and 48.3% reported annoyance due to this noise. A study conducted with the traders in the central area of the city of São Paulo found that 65.7% of workers considered the environment noisy and 65% reported annoyance due to the traffic noise in the workplace.[14]
In the work scenario, the exposed traders reported perceiving noise sources while the non-exposed traders reported perceiving noise sources by social activities. It is possible to suggest that, since the annoyance due to the perceived noise was reported in both exposure areas, no statistically significant association between annoyance and exposure was found. The potential effects of community noise include working performance reduction and lead to social handicap such absenteeism in the workplace and accidents.
The work scenario represents a multiform soundscape. It combines the traffic noise and the outdoors commercial activities, consisting of engines and exhausts noises, human voices, and bells. The traditional commercial areas are places that represent specific characteristics of urban activities and they clearly express everyday life's rhythm. Research on the relationship between soundscape and urban activities represents the characterization of the dominant urban features.[15]
In the home scenario, associations between exposure and perception of noise sources, annoyance deriving from the noise, and the perception that noise was elevated during nighttime were observed.
Soundscape approaches for residential areasallow knowing and evaluating the acoustical constellations to which the residents are permanently exposed. Moderating and visual factors that influence noise perception, as well as attitudes towards specific environmental stimulus can help understanding motivation by complaints and sleep disturbances.[16]
Studies involving annoyance as an effect of exposure to noise are widely available in literature.[17,18,19,20,21] Nevertheless, this study intended to assess the effects of exposure to urban noise in different scenarios (urban soundscapes) for bringing further information that could help clarifying the relationship between exposure to urban noise and non-auditory health effects and the factors associated with annoyance.
Thus, in the work scenario and in the home scenario the chance of reporting annoyance increased when compared with the leisure scenario. The other variables associated with annoyance were the exposure and perception of sound quality.
The home scenario configured the urban soundscape where there was the greatest perception of noise sources; reports of annoyance regarding the perceived noise and bad quality of sleep were identified. This soundscape requires attention since it represents a scenario of rest, family interactions, and relaxing. The ever-expanding urban growth and industrialization of developing countries compromised the necessary urban planning for a guaranteed sustainability in large cities, compromising health and the population's quality of life.
Footnotes
Source of Support: Nil
Conflict of Interest: None declared.
References
- 1.Geneva: World Health Organization; 1997. World Health Organization (WHO). World Health Report: Prevention of Noise-Induced Hearing Loss; p. 55. [Google Scholar]
- 2.Noise Control Act (NCA). Noise Control Act of 1972. Public Law 92-574. Identification of Major Noise Sources. Noise Criteria and Control Technology. 1972 [Google Scholar]
- 3.Schafer RM. New York: Alfred A Knopf; 1977. The Tuning of the World; p. 301. [Google Scholar]
- 4.Méline J, Van Hulst A, Thomas F, Karusisi N, Chaix B. Transportation noise and annoyance related to road traffic in the French RECORD study. Int J Health Geogr. 2013;12:44. doi: 10.1186/1476-072X-12-44. [DOI] [PMC free article] [PubMed] [Google Scholar]
- 5.Davies WJ, Adams MD, Bruce NS, Cain R, Carlyle A, Cusack P, et al. Perception of soundscapes: An interdisciplinary approach. Appl Acoust. 2013;74:224–31. [Google Scholar]
- 6.Volz R, Jakob A, Schulte-Fortkamp B. Using the soundscape approach to develop a public space in berlin — measurement and calculation. J Acoust Soc Am. 2008;123:3808. [Google Scholar]
- 7.Nilsson ME. Soundscape quality in urban open spaces. Proc Inter Noise. 2007 Paper IN07-115. [Google Scholar]
- 8.Environmental Noise Directive. European Parliament, Council. Directive 2002/49/EC of the European Parliament and of the Council of 25 June 2002 Relating to the Assessment and Management of Environmental Noise. 2002 [Google Scholar]
- 9.Portuguese Environment Agency. Ministry of Environment, Spatial Planning and Energy. Noise General Regulation. [Last accessed on 2014 May 15]. Available from: http://www.apambiente. pt/index.php?ref=16&subref=86 .
- 10.Associação Brasileira de Normas Técnicas (ABNT) Origem: Projeto NBR-10151: 1999. Acústica — Avaliação do Ruído em Áreas Habitadas visando o Conforto da Comunidade — Procedimento. Rio de Janeiro: Associação Brasileira de Normas Técnicas (ABNT) 2000:1–4. [Google Scholar]
- 11.WG-AEN. European Commission Working Group Assessment of Exposure to Noise: Good Practice Guide for Strategic Noise Mapping and the Production of Associated Data on Noise Exposure. European Comission: WG-AEN; 2006. pp. 1–129. [Google Scholar]
- 12.Zannin PH, Szeremetta B. Evaluation of noise pollution in the Botanical Garden in Curitiba, Paraná, Brazil. Cad Saude Publica. 2003;19:683–6. doi: 10.1590/s0102-311x2003000200037. [DOI] [PubMed] [Google Scholar]
- 13.Brambilla G, Gallo V, Zambon G. The Soundscape quality in some urban parks in Milan, Italy. Int J Environ Res Public Health. 2013;10:2348–69. doi: 10.3390/ijerph10062348. [DOI] [PMC free article] [PubMed] [Google Scholar]
- 14.Petian A. São Paulo: Faculdade de Medicina da Universidade de São Paulo; 2008. Incômodo em Relação ao Ruído Urbano Entre Trabalhadores de Estabelecimentos Comerciais no Município de São Paulo; p. 111. [Google Scholar]
- 15.Nguyen TA, Semidor C. Geneva, Switzerland: PLEA; 2006. Relationship between urban activities and soundscape: Commercial areas in Bordeaux and Hanoi. PLEA 2006-The 23rd Conference on Passive and Low Energy Architecture; pp. 1–5. [Google Scholar]
- 16.Schulte-Fortkamp B, Fiebig A. Soundscape analysis in a residential area: An evaluation of noise and people's mind. Acta Acust United Acust. 2006;92:875–80. [Google Scholar]
- 17.Miedema HM, Oudshoorn CG. Annoyance from transportation noise: Relationships with exposure metrics DNL and DENL and their confidence intervals. Environ Health Perspect. 2001;109:409–16. doi: 10.1289/ehp.01109409. [DOI] [PMC free article] [PubMed] [Google Scholar]
- 18.Filho JM, Lenzi A, Zannin PH. Effects of traffic composition on road noise: A case study. Transp Res D Transp Environ. 2004;9:75–80. [Google Scholar]
- 19.Prüss-Üstün A, Corvalán C. Geneva: World Health Organization; 2006. Preventing disease through healthy environments: Towards an estimate of the environmental burden of disease; p. 106. [Google Scholar]
- 20.Shepherd D, Welch D, Dirks KN, Mathews R. Exploring the relationship between noise sensitivity, annoyance and health-related quality of life in a sample of adults exposed to environmental noise. Int J Environ Res Public Health. 2010;7:3579–94. doi: 10.3390/ijerph7103580. [DOI] [PMC free article] [PubMed] [Google Scholar]
- 21.Miedema HM. Annoyance caused by environmental noise: Elements for evidence-based noise policies. J Soc Issues. 2007;63:41–57. [Google Scholar]


