Figure 6.
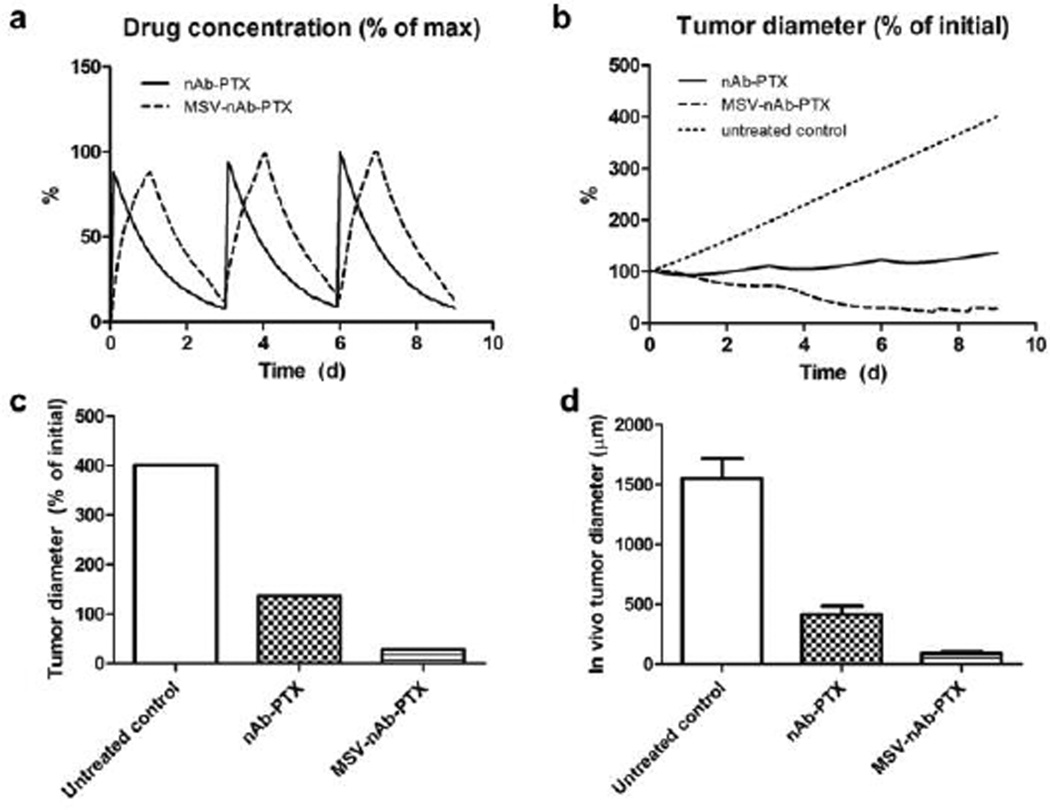
Comparison of simulation results (a–c) to response observed in vivo due to repeated therapy over the course of 9d, showing a) simulated drug (as % of maximum blood levels) and b) simulated tumor effect (as % of initial lesion diameter) after nAb-PTX and MSV-nAb-PTX injection. In all cases, therapy is simulated to begin on Days 0, 3, and 6. c) Simulated tumor diameter after 3 treatments as percentage of initial tumor. d) Comparable results from in vivo tumor after 3 treatments as reported in our recent publication19. The longer-acting and spatially focused drug release with macrophages achieves a more pronounced regression over the course of therapy than with bolus injection.

