Summary
The isolation and characterization of the lipid A domain of lipopolysaccharide (LPS) are important methodologies utilized to gain understanding of the Gram-negative cell envelope. Here, we describe protocols often employed by our laboratory for small- and large-scale isolation of lipid A from bacterial cells. Additionally, we describe various methodologies including isolation of radiolabeled lipid A, thin layer chromatography, and various mass spectrometry methods. Tandem mass spectrometry is an integral tool for the structural characterization of lipid A molecules, and both coventional collision induced dissociation (CID) and new ultraviolet photodissociation (UVPD) methods are described.
Keywords: lipid A isolation, Bligh-Dyer, thin layer chromatography (TLC), lipopolysaccharide, mass spectrometry, Collision Induced Dissociation (CID), Photodissociation (PD)
1. Introduction
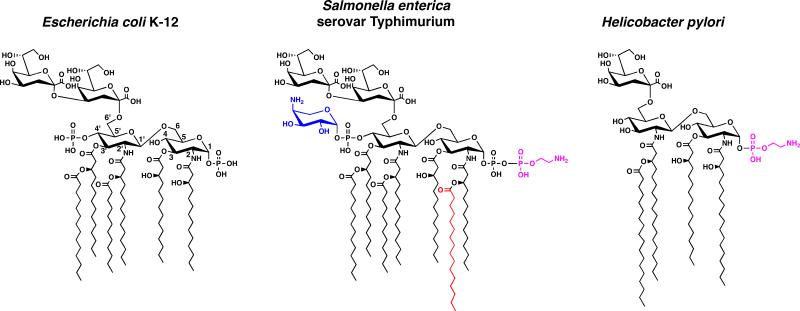
Lipopolysaccharide (LPS) covers the surface of Gram-negative bacteria and is anchored within the outer membrane by the lipid A moiety (Fig. 1) (1). The lipid A domain is the bioactive portion of LPS, activating the innate immune system via Toll-like receptor 4/myeloid differentiation factor 2 (TLR4/MD2) (2). Substantial structural heterogeneity has evolved among Gram-negative lipid A species (Fig. 1), which is largely due to enzymes that modify lipid A following its well-conserved synthetic pathway (1, 3). Given this diversity and the fact that the biological activity of lipid A largely arises from its substituent pattern, the structural characterization of lipid A species is both an important and challenging task.
Figure. 1.
Examples of the Kdo-lipid A domain of LPS from Gram-negative bacteria. The chemical structures of Escherichia coli K-12, Salmonella enterica serovar Typhimurium and Helicobacter pylori are shown. The major lipid A species of E. coli is a hexa-acylated disaccharide of glucosamine with phosphate groups at the 1- and 4′-positions. The first sugar of the core oligosaccharide, Kdo (3-deoxy-D-manno-octulosonic acid), is attached at the 6′-position and serves as a bridge to link lipid A to the remaining carbohydrate domains of LPS. Although Gram-negative bacteria share a conserved pathway for lipid A biosynthesis similar to that of E. coli K12, there is a large amount of diversity in lipid A structures. For example, the phosphate groups of lipid A can be modified in some organisms (e.g. S. enterica) with the cationic sugar L-4-aminoarabinose (blue) or with a phosphoethanolamine residue (magenta). Additionally, an acyl chain can be added to Salmonella lipid A (a palmitate is shown in red) or in H. pylori acyl chains are removed.
Various methodologies have been utilized for the extraction of LPS from the bacterial surface (4-7), the most common one being the hot phenol-water extraction procedure introduced by Westphal and Jann (8). From whole LPS, the lipid A domain can be released by mild-acid hydrolysis that selectively cleaves the linkage between the lipid region and the Kdo sugar (Fig. 1) (9). These LPS extraction methods take several days to complete, require degradation of protein and nucleic acids, and usually require the use of phenol (8). Also, LPS is naturally heterogeneous and some methods fail to extract specific types of LPS and the corresponding lipid A moiety.
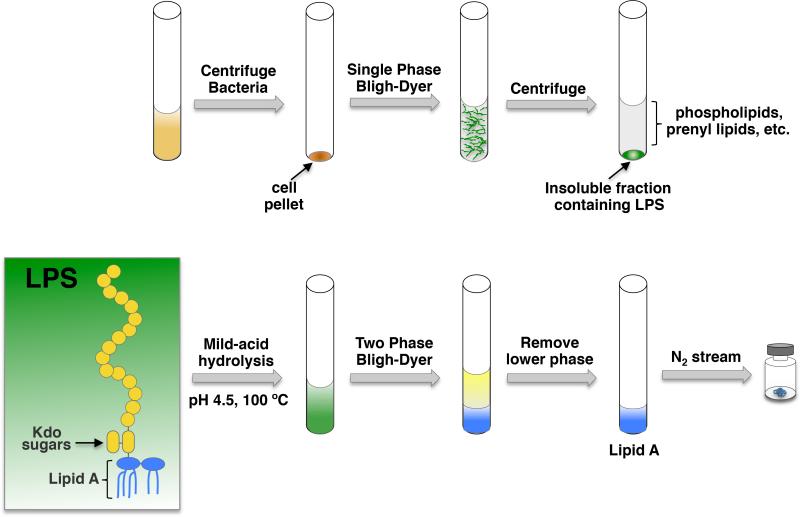
Our laboratory has expanded the method proposed by Caroff (9) and Raetz (10), which utilizes solvent extractions (Bligh-Dyer extractions) and mild-acid hydrolysis (Fig. 2). Bligh-Dyer extractions have been historically utilized for the isolation of whole lipid species from various types of preparations (e.g., animal tissue, plant tissue, etc.). The Bligh-Dyer method consists of multiple solvent extractions using chloroform, methanol and water to extract the lipid species in the organic phase. Unlike other methods, this does not select for rough- or smooth-types of LPS, providing optimal recovery of lipid A species.
Figure 2.
Isolation of intact lipid A from whole cells. Schematic showing chemical hydrolysis of the lipid A moiety from whole LPS and Bligh-Dyer extractions of lipid A.
Several methods are employed to analyze isolated lipid A species. These include thin layer chromatography (TLC) and mass spectrometry techniques. Mass spectrometry (MS) has become an indispensable tool for the elucidation of lipid A structures (11). Matrix-assisted laser desorption/ionization (MALDI) mass spectrometry is commonly employed to assess molecular weights of intact lipid A and is especially suited for initial surveys of lipid A species obtained from the extraction procedures mentioned above; however, MALDI only generates singly-charged ions which are often not ideal for elucidation of lipid A structures via tandem mass spectrometry (MS/MS). Electrospray ionization (ESI) is also routinely used to transport lipid A molecules into the gas phase as negatively charged ions, often multi-charged, which promotes efficient dissociation and production of informative fragmentation patterns upon MS/MS.
To improve sensitivity and decrease sample consumption, nanoelectrospray ionization (nESI), which uses flow regimes in the nL/min range, have been successfully employed recently for lipid A analysis (12, 13). These nL/min flow rates are facilitated by utilizing ESI needles pulled to a small tip size (usually 1 – 30 μm) along with application of lower potentials. By using nESI for lipid A analysis, 20 μL of sample solution in the 1 μM range can be analyzed over an approximately one hour period by directly infusing at 300 nL/min. The resulting ions are then activated to yield diagnostic fragmentation patterns (a process termed MS/MS). The default MS/MS method available on most commercial mass spectrometers is low-energy collision induced dissociation (CID). This method causes fragmentation upon collision of selected ions of interest with neutral bath gas molecules by application of a suitable potential to accelerate the ions. Simply stated, in this method, the internal energy imparted from the collisions causes fragmentation of the ions. CID has been vital in the characterization of lipid A and has been used to elucidate the lipid A structures of various bacterial species (14-25).
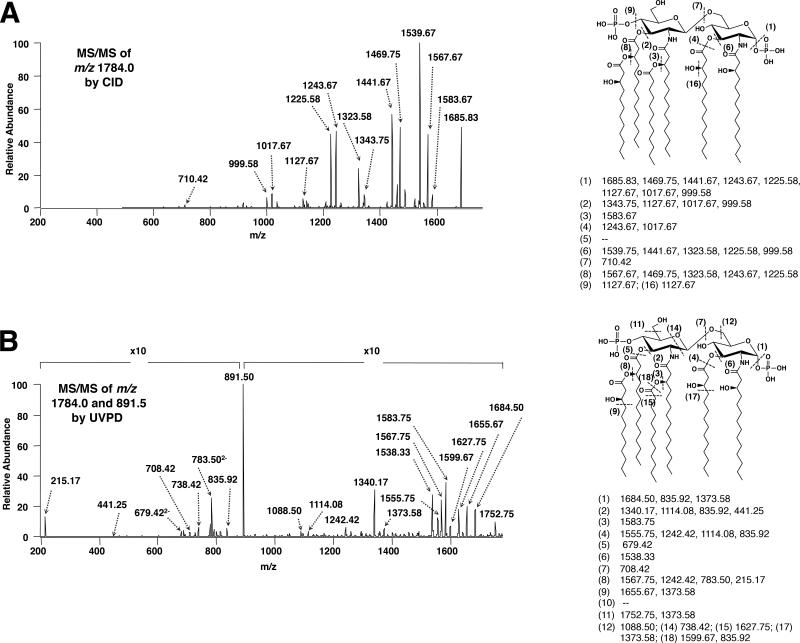
Although traditionally the most popular MS/MS method, CID generates only a limited series of product ions for lipid A molecules, mostly from C-O cleavages that result in neutral losses of phosphate groups and fatty acid chains. Ultraviolet photodissociation (UVPD) at 193 nm, an alternative MS/MS method, imparts energy by irradiating ions with high-energy photons via an excimer laser. UVPD has been shown recently to increase the depth of structural information for lipid A species by generating abundant product ions arising from cross-ring and inter-ring glucosamine cleavages, as well as cleavages between the amine and carbonyl groups on the 2’- and 2-linked primary acyl chains (12, 13). Furthermore, preferential cleavages of C-C bonds adjacent to carbonyl and hydroxyl groups have also been observed (12, 13). The combination of these diagnostic fragmentation pathways render UVPD a valuable method that can be used to accurately identify subtle changes and modifications to lipid A structures.
2. Materials
Prepare all solutions using ultrapure water and store all reagents at room temperature. Measure all solvents in a glass graduated cylinder and store in glass solvent bottles with Teflon lined caps. Teflon centrifuge tubes and rotary evaporator flasks should be rinsed with methanol and chloroform before use. Follow all waste disposal regulations when disposing of solvents and/or radioactive waste.
2.1 Lipid A Isolation Reagents
Single phase Bligh-Dyer mixture: chloroform, methanol, water (1:2:0.8 v/v). Combine 200 ml of chloroform, 400 ml of methanol and 160 ml of water in 1L solvent bottle. Cap bottle and shake to mix. After shaking, loosen the cap to vent.
Hydrolysis buffer: 50 mM sodium acetate pH 4.5, 1% sodium dodecyl sulfate (SDS). First, prepare a 10% stock solution of SDS by weighing 10 g of SDS. Transfer the SDS (see Note 1) to a 100 ml graduated cylinder, add ~ 80 ml of water and stir. Once the detergent is in solution continue to add water to 100 ml. For 0.5 L of buffer, weigh 2.05 g of sodium acetate and transfer to a 500 ml beaker. Add water to a volume of ~ 350 ml and stir. Add 50 ml of 10% SDS. Mix and adjust pH to 4.5. Make the solution up to 0.5 L with water using a graduated cylinder.
Chloroform-methanol (4:1, v/v): measure 100 ml of chloroform and transfer to solvent bottle. Measure 25 ml of methanol and mix with chloroform.
2.2 Thin-Layer Chromatography Components
TLC Solvent System: chloroform, pyridine, 88% formic acid, water (50:50:16:5 v/v). Combine 200 ml of chloroform, 200 ml of pyridine, 64 ml of 88% formic acid, and 20 of ml water in a 1 L solvent bottle. Cap bottle, shake to mix, and vent.
- Sulfuric Acid Mixture: 10% sulfuric acid-ethanol mixture.
- Measure 10 ml of sulfuric acid and dilute to 100 ml with 100% ethanol. Carefully mix the solution and transfer to a glass chromatographic reagent atomizer.
2.3 Matrix-Assisted Laser Desorption/Ionization Mass Spectrometry Components
Chloroform-methanol (4:1, v/v): measure 4 ml of HPLC grade chloroform and transfer to a glass solvent bottle. Measure 1 ml of HPLC grade methanol and combine with chloroform. Mix.
- ATT Matrix: 6-aza-2-thiothymine in 50% acetonitrile.
- Add 50 ml of water and 50 ml of acetonitrile to a microcentrifuge tube. Add 6-aza-2-thiothymine so that the 50% acetonitrile is super-saturated. Vortex and centrifuge before use.
Mass spectrometer: MALDI-TOF/TOF ABI 4700 Proteomics Analyzer equipped with a Nd:YAG laser (355 nm) using a 200-Hz firing rate.
2.4 Mass Spectrometer and Nanoelectrospray Ionization Components
Chloroform:methanol (1:1, v/v): Combine 2 ml of HPLC grade chloroform and 2 ml of HPLC methanol in a glass solvent bottle. Mix (see Note 2).
Mass Spectrometer: Thermo Fisher Scientific LTQ XL (San Jose, CA) (see Note 3).
Nanoelectrospray source: can be fabricated using any available power supply capable of delivering 1,000 - 2,500 volts to a metal-coated New Objectives PicoTip® online nanoESI emitter (30 μm tip size) (Woburn, MA) (see Note 4).
Syringe pump: any pump capable of delivering flow rates down to 300 nl/min.
2.5 Mass Spectrometer and Ultraviolet Photodissociation Components
Chloroform:methanol (1:1, v/v): Combine 2 ml of HPLC grade chloroform and 2 ml of HPLC methanol in a glass solvent bottle. Mix (see Note 2).
Laser: 193 nm Coherent ExciStar XS excimer laser (Santa Clara, CA).
Modified vacuum manifold with a CaF2 optical window to transmit photons into the ion trap.
A 2-mm aperture is added prior to the ion trap after the optical window to prevent photons from irradiating the ion trap.
Laser trigger: TTL signal from mass spectrometer to a pulse/delay generator (Model 505, Berkely Nucleonics Corporation, San Rafael, CA), which triggers laser during MS/MS.
3. Methods
3.1 Lipid A Isolation
Inoculate 5 ml of media (Luria broth or other media) using a single colony. Grow overnight at 37 °C. An overall schematic of the Bligh-Dyer extractions is shown in Fig. 2.
The next day, measure the OD600 and use the overnight culture to inoculate 200 ml of culture at a starting OD600 of 0.05 (see Note 5). Grow cells until an OD600 of 0.8-1.0 is reached.
Harvest cells via centrifugation at 10,000 × g for 10 minutes (see Note 6). Wash cell pellet with 100 ml of 1X phosphate buffered saline (PBS) (see Note 7).
Resuspend cells in 40 ml of 1X PBS and divide between two 250 ml Teflon centrifuge tubes (yielding 20 ml of suspension per tube) (see Note 8). Add 25 ml of chloroform and 50 ml of methanol to each tube, making a single phase Bligh-Dyer (chloroform, methanol, water; 1:2:0.8 v/v) (Fig. 2). Shake bottles vigorously to mix. Incubate at room temperature for 20 minutes to ensure cell lysis.
Centrifuge the mixture at 2,000 × g for 20 minutes. The LPS will pellet along with proteins (Fig. 2); however, phospholipids and isoprenyl lipids will remain in the supernatant. Discard the supernatant.
Wash the LPS pellet with single phase Bligh-Dyer mixture (1:2:0.8 v/v). Centrifuge at 2,000 × g for 20 minutes. Discard supernatant (see Note 9).
Suspend the LPS pellet in 27 ml of 50 mM sodium acetate pH 4.5, 1% SDS buffer (see Note 10).
Sonicate sample using probe tip sonicator (e.g. Branson Sonifier 250) at a constant duty cycle for 20 seconds at 50 % output. Repeat sonication of sample 2 times (20 seconds per burst).
Incubate sample for 30 minutes in boiling water bath (see Note 10). Remove from water bath and allow sample to cool to room temperature before proceeding to step 10.
To extract the lipids from the SDS solution, convert the solution into a two-phase Bligh-Dyer (Fig. 2) mixture by adding 30 ml of chloroform and 30 ml of methanol, yielding a chloroform, methanol, water (2:2:1.8, v/v) mixture. Mix by vigorously shaking the tube. Centrifuge the sample for 10 minutes at 2,000 × g. Extract the lower phase (chloroform portion) into a clean Teflon centrifuge tube using a glass pipet (see Note 11).
Perform a second extraction on the sample by adding 30 ml of chloroform to the upper phase from step 10. Vigorously mix the sample. Centrifuge at 2,000 × g for 10 minutes. Extract the lower phase, pooling it with the lower phase extracted in step 10.
Wash the pooled lower phases (60 ml total) by adding 60 ml of methanol and 54 ml of 1X PBS (see Note 12). This yields a two-phase Bligh-Dyer (chloroform, methanol, water; 2:2:1.8, v/v). Vigorously mix. Centrifuge at 2,000 × g for 10 minutes.
Remove the lower phase to a clean glass rotary evaporator flask and dry sample using rotary evaporation (see Note 13).
Store dried sample at −20 °C for TLC analysis or MS analysis.
3.2 Visualization of Lipid A Species via Thin-Layer Chromatography
Use a TLC tank that will accommodate 20 × 20 cm plates for TLC analysis (see Note 14). Line TLC tank with ~39 cm chromatography paper (Whatman 3MM Chr, 23.0 cm × 100 m).
Prepare TLC system by adding 200 ml of the chloroform, pyridine, 88% formic acid, water (50:50:16:5, v/v) mixture to tank. Allow tank to pre-equilibrate for ~ 3 hours.
Remove rotary evaporator flask from freezer and allow flask to come to room temperature. Add 5 ml of chloroform-methanol (4:1, v/v) to the sample, and bath-sonicate (30-60 seconds) to aid in removal of lipid from sides of flask. Using a glass transfer pipet, transfer lipid sample to a clean glass tube. Dry sample under a stream of nitrogen using a nitrogen dryer.
Remove the silica from the top edge of the Silica gel 60 TLC plate. Using a dull pencil, draw a line 2 cm from the bottom of the plate, which goes across the entire TLC plate. This will be your reference line for spotting the samples. Additionally, mark 1 cm increments along the reference line so that samples will be spotted 1 cm apart (see Note 15).
Dissolve lipid in 250 μl of chloroform-methanol (4:1, v/v) and vortex.
Using a calibrated glass pipet, spot one-tenth of the volume (25 μl) onto the TLC. Allow samples to air-dry for 15 minutes.
Place TLC plate containing samples into the pre-equilibrated tank. Once solvent front reaches the top of the TLC plate (see Note 16), remove the plate and air dry (~30 minutes) (see Note 17).
While plate is drying, turn on hot plate at 250 °C for charring (see Note 18).
In the fume hood, use a glass chromatographic reagent atomizer to spray the dried TLC plate with 10% sulfuric acid-ethanol mixture. Make sure spray evenly covers the TLC plate.
Place the TLC plate on the 250 °C hot plate. Within a few minutes, you will be able to visualize the charred lipid samples as black/brown spots on the plate. Do not overexpose the plate, as this will cause the entire plate to turn brown in color and make the lipid A species difficult to visualize (see Note 19).
3.3 Determination of Lipid A Species via MALDI-TOF Mass Spectrometry
Resuspend dried lipid A sample in ~200 μl chloroform-methanol (4:1, v/v) and vortex. Using a glass transfer pipet, transfer lipid A sample to glass vial (see Note 20) and dry under stream of nitrogen.
Prepare MALDI plate by adding 0.5 μl calibrant mixture to the MALDI plate on a spot near where the samples will be deposited (see Note 21).
Deposit 0.5 μl of ATT matrix onto MALDI plate on each spot that a lipid A sample will be deposited.
To concentrate sample for MS analysis, resuspend dried lipid A sample in 20 μl chloroform-methanol (4:1, v/v) to obtain a ~1-5 μg/μl solution, and vortex.
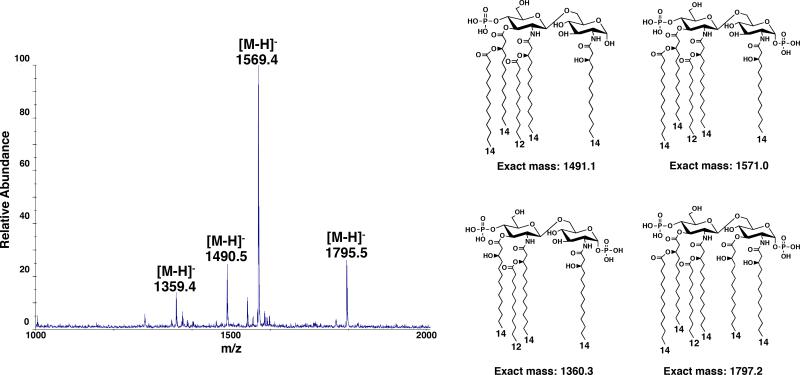
Once matrix is dry, deposit 0.5 μl of sample onto the spot of ATT matrix and acquire spectra by scanning sample for optimal ion signals (Fig. 3).
Figure 3.
Negative ion MALDI-TOF mass spectrum of a lipid A mixture. The singly deprotonated ions are denoted by [M-H]− and the predicted structure for each lipid is shown.
3.4 Nanoelectrospray Ionization and Collision Induced Dissociation (CID)
Resuspend dried lipid A in chloroform:methanol (1:1, v/v). Both methanol and chloroform should be HPLC grade to reduce clogging of nanoelectrospray tips. Sonicate diluted lipid A in bath sonicator for 10 minutes to ensure all material is dissolved.
Set up the mass spectrometer for negative mode.
Directly infuse the diluted lipid A sample (see beginning of Materials section) at 300 nL/min (see Note 22) using a syringe pump.
Slowly raise the nESI voltage from 1,000 volts to approximately 2,000 volts until spray is stable and yields high ion signals.
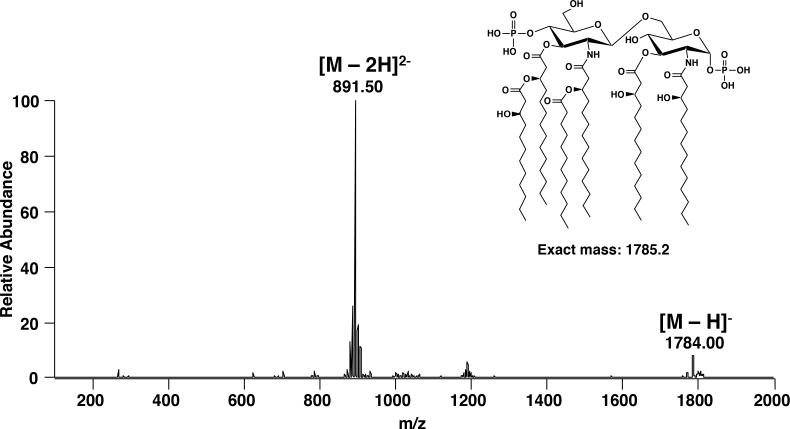
Tune the ion optics automatically or manually to enhance the ion signal of the lipid A analyte (Fig. 4).
Isolate and activate lipid A by selecting CID as the MS/MS method and isolating the precursor of interest.
Dissociate the selected precursor ion by increasing the CID voltage (or normalized collision energy) so that the precursor ion is only of 10% relative abundance as compared to the highest product ion (see Notes 23 and 24).
Collect spectra by averaging 3 – 300 scans or until high signal-to-noise is achieved for product ions (depends on the ion signal of the original precursor and how well the specific lipid A fragments) (Fig. 5A).
Figure 4.
Full negative mode nanoelectrospray ionization mass spectrum of a hexaacylated bis-phosphorylated lipid A. The singly deprotonated lipid A ion is denoted by [M-H]− and the doubly deprotonated lipid A ion is denoted by [M-2H]2−.
Figure 5.
(A) CID, [M-H]−, and (B) 193 nm UVPD, [M-2H]2− mass spectra and fragmentation maps for the hexa-acylated bis-phosphorylated lipid A shown in Fig. 4. (A) CID was performed on the deprotonated lipid, [M-H]- m/z 1784.0, and (B) UVPD was undertaken on the doubly deprotonated lipid [M-2H]2−, m/z 891.5. Fragmentation profiles are shown with dashed lines representing cleavage sites and are matched with the m/z values below the structure. The “x10” denotes a section of the spectrum that has been magnified ten times in order to more easily visualize product ions (reproduced from (3) with permission from Wiley).
3.3 Ultraviolet Photodissociation (UVPD)
Isolate and fragment lipid A by selecting CID as MS/MS method and isolating the precursorion of interest.
Set up the trigger so that the excimer laser only triggers when the CID parameter has no voltage applied (0% NCE). This requires a modest modification of the software.
Adjust the laser energy to between 1 – 8 mJ, and a repetition rate of 500 Hz.
Set the pulse generator to generate a laser pulse every 2 ms (500 Hz).
Activate the ion by increasing the laser energy and/or the number of laser pulses (thus increasing the total activation time) so that product ions are generated with high signal-to-noise (see Notes 23, 24, and 25).
Collect spectra by averaging 3 – 300 scans or until high signal-to-noise is achieved for product ions (depends on the ion signal of the original precursor and how well the specific lipid A fragments) (Fig. 5B) (see Note 26).
3.6 32P-labeled Lipid A Isolation
Inoculate 5 ml of media (Luria broth or other media) using a single colony. Grow overnight at 37 °C.
The next day, measure the OD600 and use the overnight culture to inoculate 7 ml of culture at a starting OD600 of 0.05. Add 2.5 μCi/ml of inorganic 32P. Grow cells until an OD600 of 0.8-1.0 is reached.
Harvest cells in glass centrifuge tubes with Teflon lined cap using a fixed angle clinical centrifuge at 1,500 × g for 10 minutes (see Note 27). Discard radioactive waste in appropriate radioactive waste container. Wash cell pellet with 5 ml of 1X phosphate buffered saline (PBS). Centrifuge for 10 minutes at 1,500 × g. Discard supernatant.
Resuspend cells in 5 ml of single phase Bligh-Dyer mixture (Fig. 2) consisting of chloroform, methanol, water (1:2:0.8, v/v). Vortex and incubate at room temperature for 20 minutes to ensure cell lysis.
Centrifuge in clinical centrifuge at 1,500 × g for 20 minutes. Gently pour off supernatant, which contains phospholipids and isoprenyl lipids.
Resuspend the LPS pellet in 1.8 ml of 50 mM sodium acetate pH 4.5, 1% SDS buffer via vortexing (see Note 10). Sonicate sample in bath sonicator until pellet is equally dispersed (~ 30 seconds).
Incubate sample for 30 minutes in boiling water bath (see Note 10). Remove from water bath and allow sample to cool at room temperature for 5-10 minutes.
Convert the solution into a two-phase Bligh-Dyer mixture by adding 2 ml of chloroform and 2 ml of methanol, yielding a chloroform, methanol, aqueous (2:2:1.8 v/v) mixture (see Note 28). Vortex and centrifuge for 10 minutes to separate phases. Extract the lower phase into a clean glass centrifuge tube using a glass pipet (first extraction).
Perform a second extraction on the sample by adding 2 ml of chloroform to the remaining upper phase from step 8. Vortex and centrifuge 10 minutes. Remove the lower phase and combine with the lower phase from the first extraction.
To the pooled lower phase (4 ml total volume), add 4 ml of methanol and 3.6 ml of water, yielding a two-phase Bligh-Dyer (chloroform, methanol, water; 2:2:1.8, v/v) (see Note 29). Vortex and centrifuge for 10 minutes. Remove the lower phase to a clean glass tube and dry under a stream of nitrogen. Dried samples can be stored at −20 °C until further use.
3.7 Visualization of 32P-labeled Lipid A Species via Thin-Layer Chromatography
Prepare a TLC tank and TLC plates as described under Section 3.2. 2.
Dissolve 32P-labeled sample in 500 μl of 4:1 chloroform:methanol (v/v). Vortex. Add 5 μl of sample to scintillation vial containing 5 ml of scintillation cocktail. Count in scintillation counter and calculate total CPMs of sample. Spot 10,000-20,000 cpm per sample on plate and allow silica to dry (see Note 30).
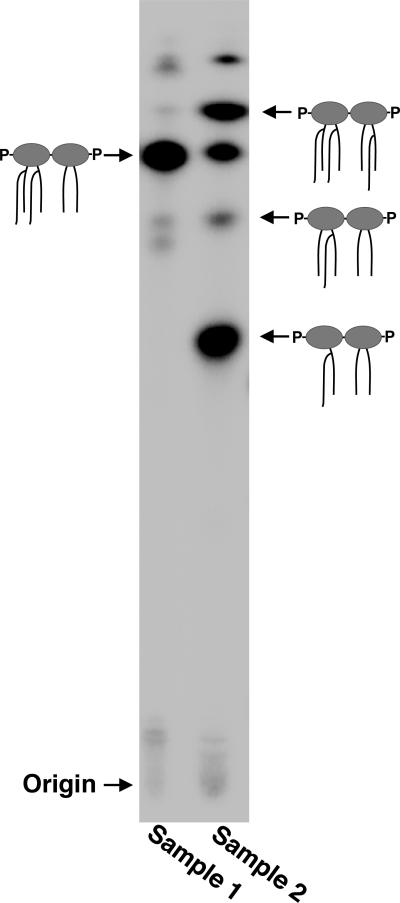
Place TLC plate containing radiolabeled samples into the pre-equilibrated tank. Once solvent front reaches the top of the TLC plate (~3 hours), remove the plate and air dry. Wrap the plate in plastic wrap and expose to PhosphorImager Screen overnight. The next morning, scan the screen to obtain the image (Fig. 6). Using imaging analysis software, this methodology also allows for quantitation of each lipid A species.
Figure 6.
TLC analysis of 32P-labeled lipid A. Two different lipid A samples are shown. In Sample 1 a single lipid A species is present, whereas Sample 2 is heterogeneous. Cartoons are shown to indicate the lipid A structures.
Acknowledgments
This work was supported by National Institutes of Health (NIH) Grants AI064184 and AI76322 to M.S.T and Welch Foundation Grant F1155 and National Science Foundation Grant CHE-1012622 to J. S. B.
Footnotes
Move a balance to the fume hood and carefully weigh the SDS. SDS is harmful if inhaled.
Both methanol and chloroform should be HPLC grade to reduce clogging of nanoelectrospray tips.
Essentially, any mass spectrometer can be used as long as it has collision induced dissociation capabilities and can be outfitted with a nanoelectrospray ionization source.
Appropriate nanotips may vary between nanosources. Nanotips with smaller tip sizes (≤ 30 μm) can be used, but a higher rate of tip clogging may occur.
Culture volumes can be adjusted depending on the strain you are working with. For instance, Vibrio cholerae requires at least 200 ml of culture in order to obtain high quality mass spectra; however, the culture volume for Escherichia coli can be scaled down to 5 ml. More starting material is required for some bacterial species because the hydrolysis step that release lipid A from whole LPS is less efficient for some organisms. When scaling down the culture volume to 5 ml, split the sample into two glass centrifuge tubes. Cap the tubes with Teflon lined caps and harvest cells using a fixed angle clinical centrifuge at 1,500 × g for 10 minutes (see Methods 3.6 for detailed instructions).
The length of centrifugation may need to be extended for bacterial cultures that are difficult to pellet.
If culture volume has been scaled down, wash the pellet in 10 ml of 1X PBS. Additionally, cell pellets can be stored at −20 °C until further use. Alternatively, resuspend the pellet in 40 ml of 1X PBS and split into two 50 ml Falcon tubes (20 ml per tube). Store samples at −20 °C.
If the culture volume has been scaled down, glass centrifuge tubes and a clinical centrifuge can be used for the lipid A isolation. Teflon lined caps should be used with glass tubes. See section 3.6 for detailed protocol using glass centrifuge tubes and the clinical centrifuge.
Additional wash steps may need to be included to reduce phospholipid contamination. When isolating lipid A from E. coli or Salmonella, only one wash is required; however, if isolating lipid A from other organisms (e.g., V. cholerae or Helicobacter pylori), additional wash steps are required.
By boiling the sample in 50 mM sodium acetate pH 4.5, 1% SDS, the lipid A domain is cleaved at the Kdo sugars from intact LPS (see Fig. 2). The boiling time should be increased to 1 hour when isolating lipid A species from organisms (e.g. V. cholerae) which synthesize a phosphorylated-Kdo (26) domain to increase yield.
If isolating lipid A species of reduced hydrophobicity having fewer phosphate groups (< 2) or fewer acyl chains (< 5), an acidic Bligh-Dyer mixture can be used to increase yield. Add 225 μl of concentrated HCl to the SDS solution containing hydrolyzed lipid A followed by 30 ml of chloroform and 30 ml of methanol yielding a chloroform, methanol, 0.1M HCl (2:2:1.8, v/v) mixture.
If isolating lipid A species of reduced hydrophobicity, use 60 ml of methanol and 54 ml of 0.1 M HCl to improve yield.
If using acidic Bligh-Dyers, add pyridine (1 drop of pyridine per 2 ml of final sample volume) to the sample before drying to neutralize the acid. Excess pyridine can lead to the removal of ester-linked fatty acids. Additionally, if lipid sample has difficulty drying, add a few milliliters of chloroform-methanol (4:1, v/v) to the flask and continue drying the sample to completion.
Two TLC plates (20 × 20 cm) can run in one TLC tank. One plate can be placed on one side of the ridge at the bottom of the tank. If it is necessary to run a second plate, place it on the other side of the ridge.
10 × 20 cm TLC plates can also be used for charring lipid samples. If desired, the samples can be spotted along the 20 cm edge of the plate and placed in the tank, which shortens the run time from 3 hours to ~ 45 minutes.
If possible, avoid spotting samples along the outside edges of the TLC plate. This helps solvent front and samples to migrate straight across plate.
Air dryers that have a cold and warm setting can also be used to dry the plates. If using a dryer, make sure to use the cold air setting as the sample may degrade when exposed to hot air for extended periods of time.
Make sure hot plate is in fume hood prior to charring plate. Fumes from sulfuric acid-ethanol mixture are harmful.
If lipid spots are not visualized initially, allow plate to cool and spray again with sulfuric acid-ethanol mixture. Expose TLC plate to the hot plate and char again.
Our laboratory prefers using conical, ‘V’-shaped glass vials. This allows the lipid A sample to be concentrated in one location (in the bottom of the ‘V’) as opposed to be spread out over the bottom of the tube. This is especially useful when suspending the dried sample in 20 μl of the chloroform-methanol mixture (4:1, v/v) for MS analysis.
Our laboratory utilizes Calibration mixture 1 from Sequazyme.
20 μL of sample can be analyzed for up to approximately 1 hour by directly infusing at 300 nL/min.
The characterization of lipid A structures is not necessarily impeded by incomplete annihilation of the precursor ion (as long as product ions are generated at a high signal-to-noise).
Multiply-charged ions dissociate more easily than singly-charged ions due to coulombic repulsion. Thus, lower collision energies are generally used for higher precursor charge states.
UVPD is generally less sensitive than CID due to the generation of more product ions from ongoing secondary dissociation of primary product ions, thus subdividing the product ion current into more channels.
There are currently no commercially available automated spectral interpretation or database search programs to assist with the assignment of lipid A structures.
Do not centrifuge glass tubes above 1,500 × g, as higher speeds will cause glass tubes to shatter.
If isolating lipid A species of reduced hydrophobicity, an acidic Bligh-Dyer mixture can be used to increase yield. Add 15 μl of concentrated HCl to the SDS solution containing hydrolyzed lipid A followed by 2 ml of chloroform and 2 ml of methanol yielding a chloroform, methanol, 0.1M HCl (2:2:1.8, v/v) mixture.
If isolating lipid A species of reduced hydrophobicity, use 4 ml of methanol and 3.6 ml of 0.1 M HCl to improve yield.
When visualizing radiolabeled lipid species, 10 × 20 cm or 20 × 20 cm TLC plates can be used. For 10 x 20 cm plates, samples should be spotted along the 10 cm edge of the plate to improve separation of lipid A species.
References
- 1.Trent MS, et al. Diversity of endotoxin and its impact on pathogenesis. J Endotoxin Res. 2006;12:205–223. doi: 10.1179/096805106X118825. [DOI] [PubMed] [Google Scholar]
- 2.Kim HM, et al. Crystal structure of the TLR4-MD-2 complex with bound endotoxin antagonist Eritoran. Cell. 2007;130:906–917. doi: 10.1016/j.cell.2007.08.002. [DOI] [PubMed] [Google Scholar]
- 3.Raetz CR, et al. Lipid A Modification Systems in Gram-Negative Bacteria. Annu Rev Biochem. 2007;76:295–329. doi: 10.1146/annurev.biochem.76.010307.145803. [DOI] [PMC free article] [PubMed] [Google Scholar]
- 4.Yi EC, Hackett M. Rapid isolation method for lipopolysaccharide and lipid A from gram-negative bacteria. The Analyst. 2000;125:651–656. doi: 10.1039/b000368i. [DOI] [PubMed] [Google Scholar]
- 5.Darveau RP, Hancock RE. Procedure for isolation of bacterial lipopolysaccharides from both smooth and rough Pseudomonas aeruginosa and Salmonella typhimurium strains. J Bacteriol. 1983;155:831–838. doi: 10.1128/jb.155.2.831-838.1983. [DOI] [PMC free article] [PubMed] [Google Scholar]
- 6.Galanos C, Luderitz O, Westphal O. A new method for the extraction of R lipopolysaccharides. Eur J Biochem. 1969;9:245–249. doi: 10.1111/j.1432-1033.1969.tb00601.x. [DOI] [PubMed] [Google Scholar]
- 7.Li J, et al. Development of an on-line preconcentration method for the analysis of pathogenic lipopolysaccharides using capillary electrophoresis-electrospray mass spectrometry. Application to small colony isolates. Journal of chromatography. 1998;817:325–336. doi: 10.1016/s0021-9673(98)00341-0. [DOI] [PubMed] [Google Scholar]
- 8.Westphal O, a. J., K. Bacterial Lipopolysaccharide: Extraction with phenol-water and further application of the procedure. Methods Carbohydr. Chem. 1965;5:83–91. [Google Scholar]
- 9.Caroff M, et al. Analysis of unmodified endotoxin preparations by 252Cf plasma desorption mass spectrometry: Determination of molecular masses of the constituent native lipopolysaccharides. J Biol Chem. 1991;266:18543–18549. [PubMed] [Google Scholar]
- 10.Odegaard TJ, et al. Shortened hydroxyacyl chains on lipid A of Escherichia coli cells expressing a foreign UDP-N-acetylglucosamine O-acyltransferase. J Biol Chem. 1997;272:19688–19696. doi: 10.1074/jbc.272.32.19688. [DOI] [PubMed] [Google Scholar]
- 11.Banoub JH, et al. Structural investigation of bacterial lipopolysaccharides by mass spectrometry and tandem mass spectrometry. Mass Spectrom. Rev. 2010;29:606–650. doi: 10.1002/mas.20258. [DOI] [PubMed] [Google Scholar]
- 12.Madsen JA, et al. IR and UV Photodissociation as Analytical Tools for Characterizing Lipid A Structures. Anal. Chem. (Washington, DC, U. S.) 2011;83:5107–5113. doi: 10.1021/ac103271w. [DOI] [PMC free article] [PubMed] [Google Scholar]
- 13.Hankins JV, et al. Elucidation of a novel [i]Vibrio cholerae[/i] lipid A secondary hydroxy-acyltransferase and its role in innate immune recognition. Mol. Microbiol. 2011;81:1313–1329. doi: 10.1111/j.1365-2958.2011.07765.x. [DOI] [PMC free article] [PubMed] [Google Scholar]
- 14.Chan S, Reinhold VN. Detailed structural characterization of lipid A: electrospray ionization coupled with tandem mass spectrometry. Anal. Biochem. 1994;218:63–73. doi: 10.1006/abio.1994.1141. [DOI] [PubMed] [Google Scholar]
- 15.Boue SM, Cole RB. Confirmation of the structure of lipid A from Enterobacter agglomerans by electrospray ionization tandem mass spectrometry. J. Mass Spectrom. 2000;35:361–368. doi: 10.1002/(SICI)1096-9888(200003)35:3<361::AID-JMS943>3.0.CO;2-D. [DOI] [PubMed] [Google Scholar]
- 16.Kussak A, Weintraub A. Quadrupole ion-trap mass spectrometry to locate fatty acids on lipid A from Gram-negative bacteria. Anal. Biochem. 2002;307:131–137. doi: 10.1016/s0003-2697(02)00004-0. [DOI] [PubMed] [Google Scholar]
- 17.El-Aneed A, Banoub J. Elucidation of the molecular structure of lipid A isolated from both a rough mutant and a wild strain of Aeromonas salmonicida lipopolysaccharides using electrospray ionization quadrupole time-of-flight tandem mass spectrometry. Rapid Commun. Mass Spectrom. 2005;19:1683–1695. doi: 10.1002/rcm.1971. [DOI] [PubMed] [Google Scholar]
- 18.Murphy RC, et al. Mass spectrometry advances in lipidomica: collision-induced decomposition of Kdo2-lipid A. Prostaglandins Other Lipid Mediators. 2005;77:131–140. doi: 10.1016/j.prostaglandins.2004.09.004. [DOI] [PMC free article] [PubMed] [Google Scholar]
- 19.Lee C-S, et al. Structural analysis of lipid A from Escherichia coli O157:H7:K-using thin-layer chromatography and ion-trap mass spectrometry. J. Mass Spectrom. 2004;39:514–525. doi: 10.1002/jms.614. [DOI] [PubMed] [Google Scholar]
- 20.Wang Z, Li J, Altman E. Structural characterization of the lipid A region of Aeromonas salmonicida subsp. salmonicida lipopolysaccharide. Carbohydr. Res. 2006;341:2816–2825. doi: 10.1016/j.carres.2006.09.020. [DOI] [PubMed] [Google Scholar]
- 21.Mikhail I, et al. Structural characterization of lipid A from nontypeable and type f Haemophilus influenzae: variability of fatty acid substitution. Anal. Biochem. 2005;340:303–316. doi: 10.1016/j.ab.2005.02.020. [DOI] [PubMed] [Google Scholar]
- 22.Madalinski G, et al. Gram-negative bacterial lipid A analysis by negative electrospray ion trap mass spectrometry: Stepwise dissociations of deprotonated species under low energy CID conditions. Int. J. Mass Spectrom. 249. 2006;250:77–92. [Google Scholar]
- 23.Silipo A, et al. Structural characterizations of lipids A by MS/MS of doubly charged ions on a hybrid linear ion trap/orbitrap mass spectrometer. J. Mass Spectrom. 2008;43:478–484. doi: 10.1002/jms.1333. [DOI] [PubMed] [Google Scholar]
- 24.Jones JW, et al. Determination of pyrophosphorylated forms of lipid A in gram-negative bacteria using a multivaried mass spectrometric approach. Proc. Natl. Acad. Sci. U. S. A. 2008;105:12742–12747. doi: 10.1073/pnas.0800445105. [DOI] [PMC free article] [PubMed] [Google Scholar]
- 25.Jones JW, et al. Comprehensive structure characterization of lipid A extracted from Yersinia pestis for determination of its phosphorylation configuration. J. Am. Soc. Mass Spectrom. 2010;21:785–799. doi: 10.1016/j.jasms.2010.01.008. [DOI] [PubMed] [Google Scholar]
- 26.Hankins JV, Trent MS. Secondary acylation of Vibrio cholerae lipopolysaccharide requires phosphorylation of Kdo. The Journal of biological chemistry. 2009;284:25804–25812. doi: 10.1074/jbc.M109.022772. [DOI] [PMC free article] [PubMed] [Google Scholar]


