Abstract
Background
The first step in many cellular signaling processes occurs at various types of receptors in the plasma membrane. Membrane cholesterol can alter these signaling pathways of living cells. However, the process in which the interaction of activated receptors is modulated by cholesterol remains unclear.
Methods
In this study, we measured single-molecule optical trajectories of epidermal growth factor receptors moving in the plasma membranes of two cancerous cell lines and one normal endothelial cell line. A stochastic model was developed and applied to identify critical information from single-molecule trajectories.
Results
We discovered that unliganded epidermal growth factor receptors may reside nearby cholesterol-riched regions of the plasma membrane and can move into these lipid domains when subjected to ligand binding. The amount of membrane cholesterol considerably affects the stability of correlated motion of activated epidermal growth factor receptors.
Conclusions
Our results provide single-molecule evidence of membrane cholesterol in regulating signaling receptors. Because the three cell lines used for this study are quite diverse, our results may be useful to shed light on the mechanism of cholesterol-mediated interaction between activated receptors in live cells.
Keywords: Epidermal growth factor receptor, Diffusion, Single-molecule trajectory, Live cell, Plasma membrane
Background
Receptor proteins are ubiquitous in the plasma membrane of mammalian cells, which transduce information about cellular environment to intracellular signaling networks [1–3]. There are approximately 1352 receptor proteins coded by human genome [4]. The flow of information through those receptors is critically shaped by receptor interactions. The diverse cellular processes regulated by such receptor proteins include cell growth and division, differentiation, migration, and apoptosis [5]. Receptor signaling dysregulation is attributed to the pathogenesis of several diseases [6, 7]. Therefore, understanding the interactions, molecular processes and relevant structures of such signaling receptors is imperative.
Human receptor proteins, including the epidermal growth factor receptor (EGFR), share a common molecular architecture, consisting of an extracellular binding domain, a single transmembrane helix, a flexible juxtamembrane segment, and an intracellular tyrosine kinase domain [8]. Ligand binding to the extracellular domains induces conformational reorganization that promotes receptor dimerization, leading to the activation of the intracellular tyrosine kinase domain. However, conclusions about the mechanism of ligand-induced dynamic recruitment and dimerization of membrane-associated receptors remains controversial [9]. Conventional steady-state ensemble approaches cannot be used to address the stochastic nature of activated receptors that encounter each other in a highly heterogeneous and fluidic plasma membrane. Recent advancements in single-molecule fluorescent imaging and tracking have provided further insights into the behavior of EGFR in vivo [10–12]. For example, Lidke et al. devised a two-color quantum-dot tracking method to visualize the state-dependent dimerization processes of human EGFR in living cells [13]. A hidden Markov model was used to extract the kinetic parameters of the underlying free, co-confined, and dimerized states.
Researchers have increasingly determined that lipid domains rich in glycosphingolipids and cholesterol can facilitate signaling receptors to form a dimer [13–15]. Because the recruitment mechanism and dynamic clustering of receptors in the hierarchical structure of plasma membranes are not clearly understood, the existence and functionality of lipid nanoscale domains on EGFR dimerization remains controversial. A growing body of research indicates that membrane cholesterol can influence the organization, stability, and function of membrane proteins including receptors [16–18]. The process by which this cholesterol modulates membrane proteins remains unclear.
The plasma membranes of live cells are complex and highly heterogeneous. Single-molecule tracking had been successfully used to probe the microscopic environments and fluctuations faced by receptor proteins in a living cell [13, 19, 20]. As a receptor protein diffuses in the plasma membrane, it encounters two types of interactions with its local environment [9, 21]. Firstly, the receptor protein can induce a local ordering of the surrounding lipid molecules via a lipid–protein interaction. Furthermore, confinement by actin filaments can also be involved. We developed an energetic model to describe the dynamic diffusion of a membrane-associated protein in a hierarchical structure of actin corrals and lipid domains [22]. This model enables us to identify critical information from single-molecule trajectories. Specifically, the confinement influences on EGFRs can be revealed by analyzing the normalized variance of mean square of diffusion step size of receptor proteins in live HeLa cells [20, 22]. In ref. [20], we focused on the influence of lipid domains on the diffusion of EGFRs. However, affinity of liganded EGFR for lipid domains and requirement of membrane cholesterol have not been verified on different cell lines. In this study, we employed single-molecule tracking technique to address the problem associated with the effect of membrane cholesterol on receptor-receptor interaction in vivo. Please note that those data are spatially and temporally coarse-grained from sampling of real molecule motions. The diffusion coefficient deduced from the coarse-grained trajectories can be location-dependent, reflecting the influences from local barriers [23].
Three cell lines were carefully selected for this study. HeLa cells, which was derived from cervical cancer cells and had served as the standard in cellular biology research. Typically, HeLa cells can express EGFR at a level of 20,000 per cell [24] and approximately contain 17 μg cholesterol per mg protein [25]. The second cell line, A431, derived from a human epidermal carcinoma, is a model system for the study of cancer-associated cellular signaling pathways. A431 cells can express EGFR at an extremely high level (500,000 per cell) [24] and contain 32 μg cholesterol per mg protein [26]. The third one, MCF12A, is a non-tumorigenic breast epithelial cell line, which expresses EGFR normally.
Methods
EGFRs were labeled to display their diffusive motions in the plasma membranes of live cells. An anti-EGFR antibody-quantum dot complex was synthesized for attaching specifically on unliganded EGFRs as a fluorescent tag. To label liganded EGFRs, we used fluorescent epidermal growth factors (EGF) to activate EGFRs and tag them at the same time. A schematic diagram of native and liganded EGFRs in the environment of plasma membrane is described in Fig. 1.
Fig. 1.
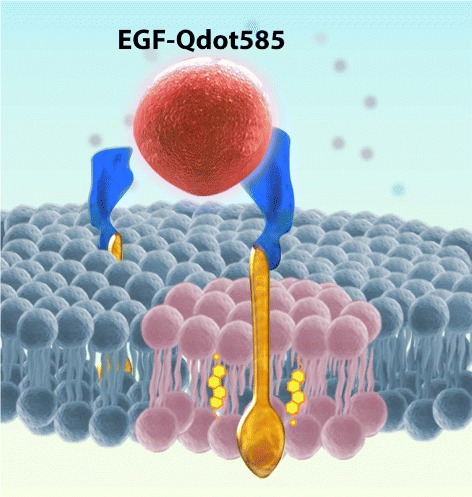
Schematic diagram of epidermal growth factor receptors (EGFRs) in the environment of plasma membrane. EGF-Qdot585 is a fluorescent epidermal growth factor (EGF) synthesized by conjugating EGF with a quantum dot Qdot585. Here cholesterol molecules are shown in yellow, the pink lipids represent the raft lipid species, and the dark green lipids are nonraft lipids
Cell culture and reagents
HeLa and A431 cells were cultured in Dulbecco’s Modified Eagle’s medium (DMEM) with 10 % (v/v) fetal bovine serum without phenol red, whereas MCF12A cells were cultured in a 1:1 mixture of DMEM and Ham’s F12 medium containing 20 ng/mL Human EGF, 0.01 mg/mL bovine insulin, 500 ng/mL hydrocortisone, and 5 %(v/v) horse serum. Before the single-molecule live-cell imaging was performed, the cells were plated in a slide with eight-well chambers. After a 70–80 % confluence was reached, HeLa and A431 cells were deprived of serum for 24 h, whereas MCF12A cells were deprived of serum for 3 h.
To tag EGFRs in the plasma membranes of live cells, anti-EGFR antibody (Thermo Fisher Scientific, Waltham, MA, USA) was first biotinylated. The resulting biotinylated anti-EGFRs were conjugated with quantum dots (Qdot585-streptavidin, Thermo Fisher Scientific). Cells were incubated in a cell culture containing 10 nM of anti-EGFR-Qdot585 for 15 min and then washed three times with phosphate buffered saline (PBS). Fluorescent EGF (EGF-Qdot585) was synthesized by conjugating biotin-EGF from Invitrogen to Qdot585-streptavidin in PBS. To activate EGFRs, cells were incubated in a cell culture containing 40 ng/mL of EGF-Qdot585. Fluorescent anti-CD59 antibody was synthesized by biotinylating anti-CD59 antibody (Sigma-Aldrich, St. Louis, MO, USA) and then conjugated with Qdot585-streptavidin in PBS. To label CD59, we followed the same protocol as described above for labeling EGFR.
In this research, we used two drugs to modify the amount and spatial distribution of cholesterol in the plasma membranes of live cells. The first drug is nystatin, which can be used to render cholesterol more uniformly distributed, while keeping the total amount of cholesterol constant [27]. The second drug is methyl- β-cyclodextrin (M βCD), which can deplete membrane cholesterol to a low level [28]. Cells were incubated in their normal growth medium containing 7.5 mM M βCD for 1 h and then washed three times with PBS before EGFRs (or CD59) in the cells were labeled fluorescently. To create a uniform cholesterol distribution, cells were incubated in a cell culture with 10 μg/mL nystatin for 1 h.
Single-molecule optical measurement
The output from a blue (473 nm) solid-state laser was used to excite quantum dots in live cells. The fluorescent signals were collected with a high numerical aperture (NA) oil immersion objective lens mounted on an inverted optical microscope (IX-71, Olympus Optical Co., Tokyo, Japan) and filtered using a 473-nm Raman notch filter. We then detected the fluorescent signals with an electron-multiplying charge-coupled device (EMCCD, Cascade II 512, Photometrics Inc., Huntington Beach, CA, USA).
Data analysis
Single-molecule optical trajectories of proteins under study were recorded for as long as 100 s with a frame period of τ=25 ms. Position coordinates of single-molecule proteins were extracted from a set of images. A typical EMCCD image of EGFRs in a living cell is presented in Fig. 2. The nearest positions in consecutive frames were connected to form a single-molecule trajectory by using multiple-target tracing algorithm [29]. Events of confined diffusion were extracted from a single-molecule trajectory by using the confinement quantification procedure [30]. The mean squared displacements (MSD) were calculated from single-molecule trajectories. The localization accuracy of our apparatus was approximately 40 nm, implying an accuracy of 0.002 μm2 for determination. We presented a histogram of MSD and normalized variance in a contour plot; here can quantify the manner in which a receptor molecule diffuses in its environment, and can reveal the nature (deterministic or stochastic) of interaction between a receptor protein and its environment [22]. An attractive feature of this plot is that when a molecule repeatedly visits a membrane domain, the characteristic and of the lipid domain is imposed on the trajectories, resulting in the formation of a peak at the corresponding position on the plot.
Fig. 2.
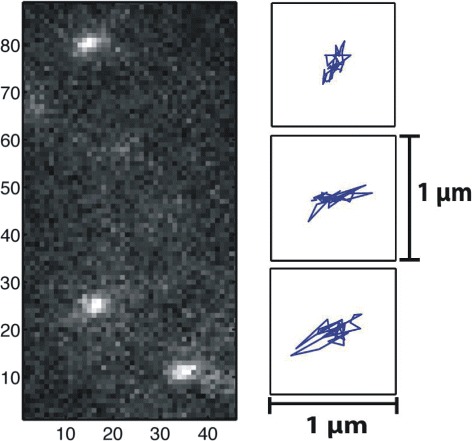
An EMCCD image of single-molecule EGFRs in a living cell taken with an exposure time of 25 ms; Three typical trajectories of EGFRs diffusing in a confined region were extracted from measured trajectories using the confinement quantification procedure [30]
The mathematical foundation of the method had been detailed in [22]. Here we summarize some key findings to facilitate further discussion. For molecules under free diffusion, has a constant value of 2. As a receptor protein diffuses under a strong confinement of actin corral, can be a large positive value [20]. By contrast, of a receptor is reduced to below 2 when it is confined in a lipid domain. This can be understood as follows: Actin filaments act as soft potential barriers for the diffusing protein [21, 22, 31]. As membrane proteins diffuse near an actin filament, the soft potential barrier may stall the diffusing proteins for a brief moment, which causes a large variance in the diffusion step size. Furthermore, the faster the protein diffuses, the larger the variance is. At the limit of fast diffusion, can reach a saturated level, depending on the barrier height. Owing to the protein-lipid interaction, we can view a protein and its nearby ordered lipids as a dressed protein. For a protein diffusing in a lipid domain, the faster the protein diffuses, the larger the dressing effect is. This shall result in a smaller variance of , and thereby yields smaller for faster diffusing proteins.
Results
Single-molecule optical trajectories of CD59 reveal the association with cholesterol-rich lipid domains
Lipid raft domains are rich in cholesterol and glycosphingolipids such as ganglioside GM1 [15]. Previous studies had reported that CD59 can colocalizes with GM1 lipids in the plasma membrane of a cell [32, 33]. Here we used CD59 as a marker for the lipid raft domain.
We analyzed the trajectories of Qdot585-Ab-CD59 in HeLa cells. The resulting - contour plot was presented in Fig. 3. For the native HeLa cells, Fig. 3a displays four peaks (labeled 1, 2, 3, and 4) at the coordinates of (0.004, 1.6), (0.008, 1.2), (0.015, 1.2), and (0.028, 1.2), respectively. For the M βCD-treated cells (see Fig. 3b), the four peaks shift upwards as approaches the free diffusion limit. This result is consistent with the assumption that CD59 proteins are embedded in lipid raft domains. When membrane cholesterol is depleted by M βCD, CD59s are released from lipid raft domains, allowing them to diffuse freely.
Fig. 3.
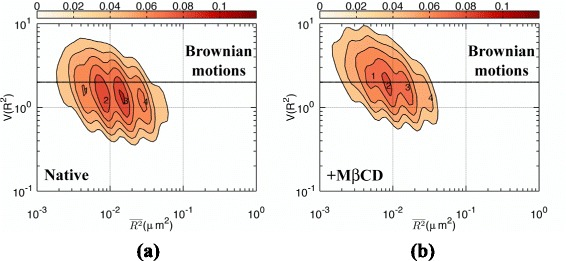
Two-dimensional contour plot on the - plane for Qdot585-Ab-CD59 diffusing in the plasma membrane of (a) native HeLa cells and (b) M βCD-pretreated HeLa cells
EGF binding causes EGFRs to translocate into cholesterol-rich lipid domains.
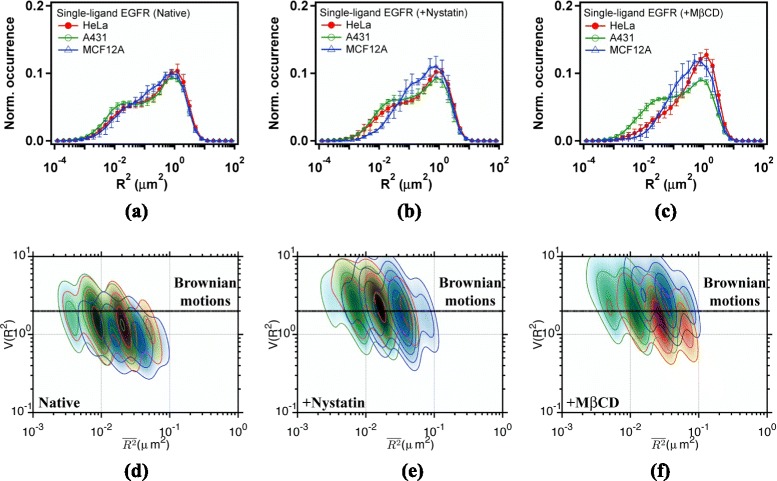
Equipped with the result of CD59, we moved on to measure and analyze the trajectories of unliganded EGFRs in the three cell lines. By grouping the MSDs to an appropriate number of bins, a histogram of MSD can be prepared (see Fig. 4a). Note that the diffusion coefficient is related to MSD by with a frame period of τ=25 ms. We can identify two groups of diffusing species in the histogram [20]. The faster group displays a peak at about 0.8 μm2, attributable to non-confined diffusion. The slower group has a peak near 0.012 μm2, which can be ascribed to confined diffusion. Unliganded EGFRs of the two cancerous cell lines (HeLa and A431) prefer to diffuse in the confined diffusion state. The reverse is apparent in the normal epithelial MCF-12A cells. The corresponding - plots of unliganded EGFRs in the confined diffusion state are illustrated in Fig. 4d for HeLa (Red), A431 (Green), and MCF-12A (Blue), respectively. The regions colored in black indicate the similarity of the confined diffusion state in the three cell lines. Two peaks with values of 3 and 4 occur in the three cell lines, indicating a strong interaction of EGFR with actin corrals [22].
Fig. 4.
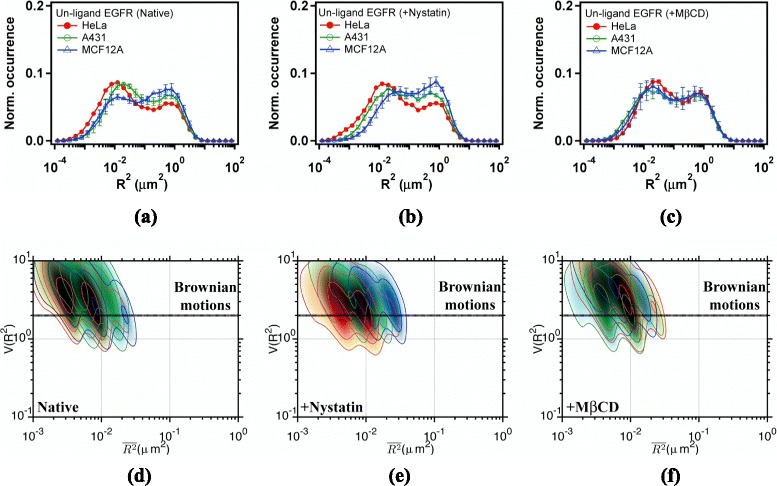
a, b, c Histograms of mean-square displacements (MSD) and (d, e, f) - plots of unliganded EGFR (Qdot585-Ab-EGFR) diffusing in the plasma membrane of (a, d) native cells, (b, e) nystatin-pretreated cells, and (c, f) M βCD-pretreated cells. Trajectories were sampled with a frame period of τ=25 ms. Data are shown in red for HeLa cells, green for A431 cells, and blue for MCF12A cells
When different drug effects on membrane cholesterol are applied with nystatin and M βCD, cholesterol-mediated interaction of EGFRs can be investigated. The results are shown in Fig. 4b and c. For the nystatin-pretreated cells, the MSD profile of EGFR is similar to that in native cells. Remarkably in native MCF-12A cells, the population of unliganded EGFR diffusing in the fast state is larger, whereas that in the M βCD-treated cells it becomes smaller. After M βCD treatment the cell line dependent variations in MSD profiles become smaller (see Fig. 4c), revealing that the lipid environments of unliganded EGFRs in the three cell lines are similar after membrane cholesterol is depleted. All these observations clearly indicate that the diffusion of unliganded EGFR is relevant to the amount of membrane cholesterol. Figure 4e and f display the corresponding - plots of unliganded EGFR in the cell lines subjected to different drug treatments. Similar - values as those observed in native cells were observed, which is opposite to that of CD59 presented in Fig. 3. The result suggests that unliganded EGFR may locate outside of the cholesterol-rich lipid domains.
Figure 5a depicts the diffusion behavior of liganded EGFR in the three cell lines. Comparing to the result of unliganded EGFR shown in Fig. 4a, we found that receptor activation with EGF appears to promote the liganded EGFR (Qdot585-EGF-EGFR) to diffuse in the fast state. Figure 5b and c show the effects of nystatin and M βCD on liganded EGFR. Among the three cell lines, the diffusion behavior of liganded EGFRs in A431 cells is least sensitive to changes in membrane cholesterol. The MSD profile of liganded EGFR in native HeLa cells is similar to that in A431; however, it becomes more similar to that in MCF-12A after M βCD treatment (Fig. 5c).
Fig. 5.
a, b, c Histograms of MSDs and (d, e, f) - plots of liganded EGFR (Qdot585-EGF-EGFR) diffusing in the plasma membrane of (a, d) native cells, (b, e) nystatin-pretreated cells, and (c, f) M βCD-pretreated cells. Trajectories were sampled with a frame period of τ=25 ms. Data are shown in red for HeLa cells, green for A431 cells, and blue for MCF12A cells
Figure 5d presents the corresponding - plots of native cells. Compared to the result of unliganded EGFR shown in Fig. 4d, EGF binding decreases to below the free diffusion limit, suggesting that liganded EGFR may encounter with different environments. The value of liganded EGFR increases from that in the native cells (Fig. 5d) to approximately at the free diffusion limit in the nystatin-pretreated (Fig. 5e) and M βCD-pretreated cells (Fig. 5f). By contrast, uniformly distributing membrane cholesterol does not change the value of unliganded EGFR. This finding suggests that liganded EGFRs may colocalize with membrane cholesterol, but unliganded EGFRs do not. The - plots of liganded EGFRs in the three cell lines are similar to that of CD59, further supporting that these two types of proteins are located in similar environments. These experimental results may be effectively explained by the concept that unliganded EGFRs are located outside the cholesterol-rich lipid domains and EGF binding causes the receptors to move into the cholesterol-rich lipid domains [20].
Cholesterol-mediated interaction between liganded EGF Receptors
When a receptor protein passes a nearby receptor, it may experience an attractive force that can result in a correlated motion between the two molecules [34]. To quantitatively display the correlation between two trajectories, we expressed the position vectors as a phasor and calculated the degree of correlation with
| 1 |
Thus, we can select highly correlated segments from trajectories by using C>0.8. We analyzed those segments to disclose the correlated motion of paired Qdot585-EGF-EGFRs.
Figure 6a displays the MSD histograms of correlated Qdot585-EGF-EGFRs in native HeLa (red), A431(green), and MCF-12A (blue), respectively. The correlated Qdot585-EGF-EGFRs in HeLa and A431 cells appear to diffuse more slowly than the independent Qdot585-EGF-EGFR does, reflecting an attractive interaction effect with their nearby companion. To further examine the nature of receptor-receptor and receptor-environment interactions, we subjected those highly correlated segments to - analysis. The resulting - plots for the three cell lines are presented in Fig. 6d. The contour plots are more scattered than those of independent Qdot585-EGF-EGFRs (see Fig. 5d), revealing that this data analysis scheme is highly sensitive to receptor interaction. The value of the correlated Qdot585-EGF-EGFRs is considerably lower in A431 cells, attributable to highly effective receptor-lipid and receptor-receptor interactions in A431 cells [20]. To inspect the nature of interactions and the relevance to receptor-induced lipid ordering, we again took advantages of the drug effects with nystatin and M βCD. Figure 6b and c display the MSD histograms of the correlated Qdot585-EGF-EGFRs. Pretreatment of HeLa cells with M βCD shifts the MSD profile of liganded EGFRs to the side of higher diffusion constant. M βCD treatment also broadens the MSD profile of liganded EGFRs in A431 cells. The - plots for the three cell lines pretreated with nystatin are presented in Fig. 6(e). Correlated Qdot585-EGF-EGFRs appear to experience a weaker interaction in the nystatin-treated A431 cells, as evidenced by an increased value. This observation may be explained with less stable lipid domain due to lower amount of cholesterol, resulting in larger variance of diffusing step size of the correlated receptors. By contrast, the effective interaction becomes stronger in nystatin-treated MCF-12A cells, suggesting the effect of cholesterol-mediated interaction is opposite to that of receptor-lipid interaction. The of correlated Qdot585-EGF-EGFR in A431 increases by two orders of magnitude from 10−2 of native cells to 1 of M βCD treated cells. Noteworthy, the value can be increased to higher than 10 in M βCD treated HeLa and MCF-12A cells, revealing that a deterministic dimerization interaction will dominate after membrane cholesterol is depleted. These observation results exhibit the vital role of membrane cholesterol in mediating the interaction between liganded receptors in the three cell lines under study.
Fig. 6.
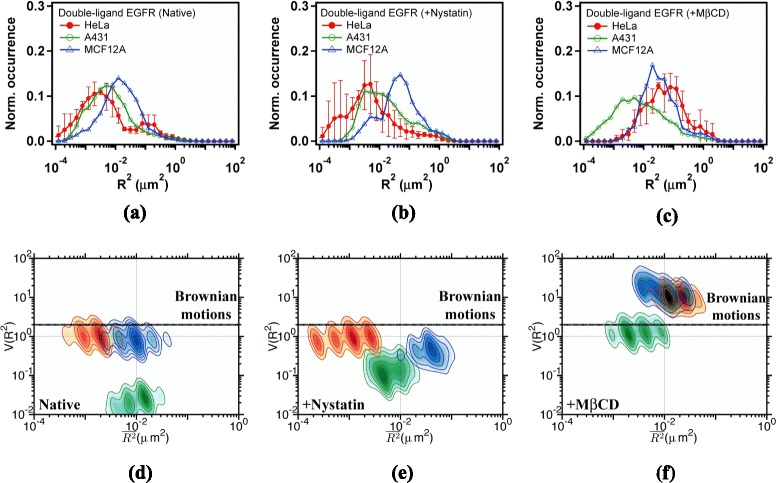
a, b, c Histograms of MSDs and (d, e, f) - plots of correlated Qdot585-EGF-EGFRs diffusing in the plasma membrane of (a, d) native cells, (b, e) nystatin-pretreated cells, and (c, f) M βCD-pretreated cells. Trajectory segments with a degree of correlation exceeding 0.8 were analyzed. Trajectories were sampled with a frame period of τ=25 ms. Data are shown in red for HeLa cells, green for A431 cells, and blue for MCF12A cells
Discussion
A receptor protein can induce order in the surrounding lipids through the receptor-lipid interaction [22]. The degree of induced lipid order is determined by the effects of receptor-lipid interaction and the amount of cholesterol in the plasma membrane. Recent molecular dynamics (MD) simulations of human receptor tyrosine kinases in various lipid bilayers revealed that the predominant drivers of the receptor-induced lipid ordering domains may originate from electrostatic interactions between the anionic lipids and clustering basic residues in the juxtamembrane starting region of receptors [35]. Lipid domains had been predicted to exist in multicomponent membranes and experimentally observed on artificial membranes. For example, thermal fluctuations on a multicomponent membrane can produce inhomogeneities of lipid phases because the order parameters of lipid systems depend not only on the lipid composition but also on the compositional difference of two lipid leaves [36]. Coupling between inner and outer leaves of an asymmetric lipid bilayer could also produce inhomogeneities of lipid phases with a nonzero curvature [37].
In a cholesterol-rich lipid domain, interactions between receptors may be regulated by membrane cholesterol. Such cholesterol-mediated interactions between membrane-associated proteins and cholesterol-dependent nanoassemblies had been reported in the literature [16, 38–40]. Recently, coarse-grained MD simulations had been carried out to explore the nature of molecular interaction between membrane cholesterol and β2-adrenergic receptor [41]. This simulation revealed that cholesterol can bind to transmembrane helix IV of β2-adrenergic receptor and thereby regulates the dimer formation. Several experimental studies also showed that membrane cholesterol can regulate ligand-induced activation of receptors [16–18]. Affinity of liganded EGFR for lipid domains and requirement of membrane cholesterol in those lipid heterogeneities have not been verified. In this research, we found that unliganded EGFRs may reside outside cholesterol-rich lipid domains of the plasma membranes and can move into lipid raft domains when subjected to ligand binding. Our study provides single-molecule experimental evidence of membrane cholesterol in regulating signaling receptors. Noteworthy, some raftophilic proteins were recently found to appear preferentially at a spatial proximity (<150 nm) to the GM1 nanodomains without physical intermixing [40].
It is appealing to improve our understanding for the mechanism that can drive the ligand bound receptor to lipid domains. Based on the - analysis of single-molecule EGFR trajectories in live cells, we proposed a simple molecular-level model. Ligand binding to an EGFR can induce a conformational change of EGFR that may expose some residues with high cholesterol affinity. Thereby, liganded EGFRs may provoke an aggregate of their neighboring raft lipids (such as GM1) to form a cholesterol-rich lipid domain. Figure 7 presents a schematic representation (center) of correlated EGFRs (green) in a cholesterol-rich (yellow) lipid domain. Without membrane cholesterol (right schematic of Fig. 7), a deterministic dimerization interaction dominates, which causes the value to be increased to higher than 10 as shown in Fig. 6f. Liganded EGFR can also be attracted to an existing lipid domain. As pointed out above that coupling between inner and outer leaves of an asymmetric lipid bilayer could produce inhomogeneities of lipid phases with a nonzero curvature [37]. Such membrane deformations could affect the movements of liganded receptors with the deformed lipids. Because the three cell lines used for this study are quite diverse, our results may be useful to shed light on the mechanism of cholesterol-mediated interaction between activated receptors in live cells.
Fig. 7.
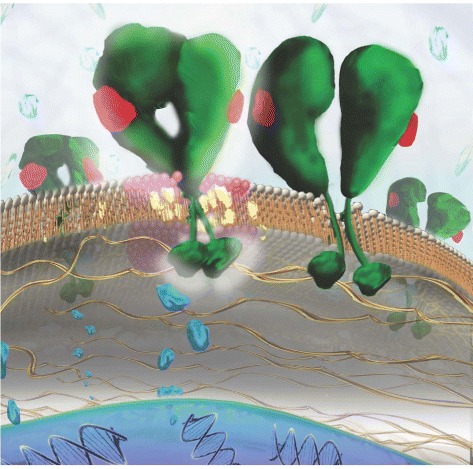
Schematic representation of correlated EGFRs (green) in a cholesterol (yellow) enriched lipid domain (center) and in a cholesterol-depleted nonraft lipid domain (right), drawn to illustrate the conclusion of this study. The red object on EGFR denotes the EGF ligand. Cholesterol molecules increase receptor-receptor interaction and thus promote the stability of correlatively moving EGFRs
Conclusions
In summary, we studied single-molecule optical trajectories of EGFRs moving in the plasma membranes of two cancerous cell lines (A431 and HeLa) and one normal epithelial cell line (MCF-12A). A stochastic model of single-molecule optical data, developed in our previous study [22], was used to analyze and identify critical information from single-molecule trajectories. We disclosed that EGFRs at rest in the three cell lines are located outside the cholesterol-rich lipid domains; EGF binding induces the receptors to move into the cholesterol-rich lipid domains. The liganded receptors diffusing in proximity in the plasma membrane interact with each other that causes the receptors to move correlatively. Membrane cholesterol was found to considerably affect the correlated motion of activated EGFRs. Our single-molecule tracking results reveal the vital role of membrane cholesterol in mediating the interaction between liganded receptors in the three cell lines under study. Because receptor dimerization is a common process for signal transduction, our results can shed light on the way in which cholesterol molecules regulate receptor-receptor interactions in the plasma membranes of live cells.
Abbreviations
DMEM, Dulbecco’s modified eagle’s medium; EGF, epidermal growth factor; EGFR, epidermal growth factor receptor; EMCCD, electron-multiplying charge-coupled device; M βCD, methyl- β-cyclodextrin; MD, molecular dynamics; MSD, mean-square displacement; PBS, phosphate buffered saline
Acknowledgements
None.
Funding
This research was funded by the National Science Council of the Republic of China under the grant number MOST 103-2112-M-009-012-MY3.
Availability of data and materials
All datasets and software used for supporting the conclusions of this article are available from the public data repository at the website of https://zenodo.org/record/54563 .
Authors’ contributions
JYH designed, coordinated this research and drafted the manuscript. CYL carried out experiments and data analysis. LWL conceived of the study, and participated in research coordination. The authors read and approved the final manuscript.
Competing interests
The authors declare that they have no competing interests.
Consent for publication
Not applicable.
Ethics approval and consent to participate
Not applicable.
References
- 1.Vaquerizas MJ, Kummerfeld SK, Teichmann SA, Luscombe NM. A census of human transcription factors: function, expression and evolution. Nat Rev Genet. 2009;10:252–63. doi: 10.1038/nrg2538. [DOI] [PubMed] [Google Scholar]
- 2.Yosef N, Ungar L, Zalckvar E, Kimchi A, Kupiec M, Ruppin E, Sharan R. Toward accurate reconstruction of functional protein networks. Mol Syst Biol. 2009;5:248. doi: 10.1038/msb.2009.3. [DOI] [PMC free article] [PubMed] [Google Scholar]
- 3.Purvis JE, Lahav G. Encoding and decoding cellular information through signaling dynamics. Cell. 2013;152:945–56. doi: 10.1016/j.cell.2013.02.005. [DOI] [PMC free article] [PubMed] [Google Scholar]
- 4.Almén MS, Nordström KJ, Fredriksson R, Schiöth HB. Mapping the human membrane proteome: a majority of the human membrane proteins can be classified according to function and evolutionary origin. BMC Biol. 2009;7:1–14. doi: 10.1186/1741-7007-7-50. [DOI] [PMC free article] [PubMed] [Google Scholar]
- 5.Schlessinger J. Cell signaling by receptor tyrosine kinases. Cell. 2000;103:211–25. doi: 10.1016/S0092-8674(00)00114-8. [DOI] [PubMed] [Google Scholar]
- 6.Gschwind A, Fischer OM, Ullrich A. The discovery of receptor tyrosine kinases: targets for cancer therapy. Nat Rev Cancer. 2004;4:361–70. doi: 10.1038/nrc1360. [DOI] [PubMed] [Google Scholar]
- 7.Mendelsohn J, Baselga J. The egf receptor family as targets for cancer therapy. Oncogene. 2000;19:6550–565. doi: 10.1038/sj.onc.1204082. [DOI] [PubMed] [Google Scholar]
- 8.Citri A, Yarden Y. Egf-erbb signalling: towards the systems level. Nat Rev Mol Cell Biol. 2006;7:505–16. doi: 10.1038/nrm1962. [DOI] [PubMed] [Google Scholar]
- 9.Kusumi A, Fujiwara TK, Morone N, Yoshida KJ, Chadda R, Xie M, Kasai RS, Suzuki KGN. Membrane mechanisms for signal transduction: The coupling of the meso-scale raft domains to membrane-skeleton-induced compartments and dynamic protein complexes. Semin Cell Dev Biol. 2012;23:126–44. doi: 10.1016/j.semcdb.2012.01.018. [DOI] [PubMed] [Google Scholar]
- 10.Teramura Y, Ichinose J, Takagi H, Nishida K, Yanagida T, Sako Y. Single-molecule analysis of epidermal growth factor binding on the surface of living cells. EMBO J. 2006;25:4215–222. doi: 10.1038/sj.emboj.7601308. [DOI] [PMC free article] [PubMed] [Google Scholar]
- 11.Chung I, Akita R, Vandlen R, Toomre D, Schlessinger J, Mellman I. Spatial control of egf receptor activation by reversible dimerization on living cells. Nature. 2010;464:783–7. doi: 10.1038/nature08827. [DOI] [PubMed] [Google Scholar]
- 12.Hiroshimaa M, Saekib Y, Okada-Hatakeyamab M, Sako Y. Dynamically varying interactions between heregulin and erbb proteins detected by single-molecule analysis in living cells. Proc Natl Acad Sci USA. 2012;109:13984–13989. doi: 10.1073/pnas.1200464109. [DOI] [PMC free article] [PubMed] [Google Scholar]
- 13.Low-Nam ST, Lidke KA, Cutler PJ, Roovers RC, van Bergen en Henegouwen PMP, Wilson BS, Lidke DS. Erbb1 dimerization is promoted by domain co-confinement and stabilized by ligand binding. Nat Struct Mol Biol. 2011;18:1244–9. doi: 10.1038/nsmb.2135. [DOI] [PMC free article] [PubMed] [Google Scholar]
- 14.Hess ST, Gould TJ, Gudheti MV, Maas SA, Mills KD, Zimmerberg J. Dynamic clustered distribution of hemagglutinin resolved at 40 nm in living cell membranes discriminates between raft theories. PNAS. 2007;104:17370–5. doi: 10.1073/pnas.0708066104. [DOI] [PMC free article] [PubMed] [Google Scholar]
- 15.Lingwood D, Simons K. Lipid rafts as a membrane-organizing principle. Science. 2010;327:46–50. doi: 10.1126/science.1174621. [DOI] [PubMed] [Google Scholar]
- 16.Orr G, Hu D, Özçxelik S, Opresko LK, Wiley HS, Colson SD. Cholesterol dictates the freedom of egf receptors and her2 in the plane of the membrane. Biophys J. 2005;89:1362–1373. doi: 10.1529/biophysj.104.056192. [DOI] [PMC free article] [PubMed] [Google Scholar]
- 17.Ringerike T, Blystad FD, Levy FO, Madshus IH, Stang E. Cholesterol is important in control of egf receptor kinase activity but egf receptors are not concentrated in caveolae. J Cell Sci. 2002;115:1331–1340. doi: 10.1242/jcs.115.6.1331. [DOI] [PubMed] [Google Scholar]
- 18.Pike LJ, Casey L. Cholesterol levels modulate egf receptor-mediated signaling by altering receptor function and trafficking. Biochemistry. 2002;41:10315–22. doi: 10.1021/bi025943i. [DOI] [PubMed] [Google Scholar]
- 19.Türkcan S, Richly MU, Alexandrou A, Masson JB. Probing membrane protein interactions with their lipid raft environment using single-molecule tracking and bayesian inference analysis. PLOS ONE. 2013;8:53073. doi: 10.1371/journal.pone.0053073. [DOI] [PMC free article] [PubMed] [Google Scholar]
- 20.Lin CY, Huang JY, Lo LW. Unraveling the impact of lipid domains on the dimerization processes of single-molecule egfrs of live cells. Biochimica et Biophysica Acta. 2015;1848:886–93. doi: 10.1016/j.bbamem.2014.12.019. [DOI] [PubMed] [Google Scholar]
- 21.Gómez-Llobregat J, Buceta J, Reigada R. Interplay of cytoskeletal activity and lipid phase stability in dynamic protein recruitment and clustering. Sci Rep. 2013;3:1–8. doi: 10.1038/srep02608. [DOI] [PMC free article] [PubMed] [Google Scholar]
- 22.Lin CY, Huang JY, Lo LW. Energetic modeling and single-molecule verification of dynamic regulation on receptor complexes by actin corrals and lipid raft domains. J Chem Phys. 2014;141:215102–9. doi: 10.1063/1.4902985. [DOI] [PubMed] [Google Scholar]
- 23.Godin AG, Lounis B, Cognet L. Super-resolution microscopy approaches for live cell imaging. Biophys J. 2014;107:1777–1784. doi: 10.1016/j.bpj.2014.08.028. [DOI] [PMC free article] [PubMed] [Google Scholar]
- 24.Zhang F, Yin SWL, Yang Y, Guan Y, Wang W, Xu H, Tao N. Quantification of epidermal growth factor receptor expression level and binding kinetics on cell surfaces by surface plasmon resonance imaging. Anal Chem. 2015;87:9960–965. doi: 10.1021/acs.analchem.5b02572. [DOI] [PMC free article] [PubMed] [Google Scholar]
- 25.Robinet P, Fradagrada A, Monier MN, Marchetti M, Cogny A, Moatti N, Paul JL, Vedie B, Lamaze C. Dynamin is involved in endolysosomal cholesterol delivery to the endoplasmic reticulum: Role in cholesterol homeostasis. Traffic. 2006;7:811–23. doi: 10.1111/j.1600-0854.2006.00435.x. [DOI] [PubMed] [Google Scholar]
- 26.Westover EJ, Covey DF, Brockman HL, Brown RE, Pike LJ. Cholesterol depletion results in site-specific increases in epidermal growth factor receptor phosphorylation due to membrane level effects studies with cholesterol enantiomers. J Biol Chem. 2003;278:51125–1133. doi: 10.1074/jbc.M304332200. [DOI] [PMC free article] [PubMed] [Google Scholar]
- 27.Coutinho A, Prieto M. Cooperative partition model of nystatin interaction with phospholipid vesicles. Biophys J. 2003;84:3061–078. doi: 10.1016/S0006-3495(03)70032-0. [DOI] [PMC free article] [PubMed] [Google Scholar]
- 28.López CA, de Vries AH, Marrink SJ. Molecular mechanism of cyclodextrin mediated cholesterol extraction. Plos Comp Biol. 2011;7:1002020. doi: 10.1371/journal.pcbi.1002020. [DOI] [PMC free article] [PubMed] [Google Scholar]
- 29.Sergé A, Bertaux N, Rigneault H, Marguet D. Dynamic multiple-target tracing to probe spatiotemporal cartography of cell membranes. Nat Methods. 2008;5:687–94. doi: 10.1038/nmeth.1233. [DOI] [PubMed] [Google Scholar]
- 30.Meilhac N, Guyader LL, Salomé L, Destainville N. Detection of confinement and jumps in single-molecule membrane trajectories. Phy Rev E. 2006;73:011915. doi: 10.1103/PhysRevE.73.011915. [DOI] [PubMed] [Google Scholar]
- 31.Auth T, Gov NS. Diffusion in a fluid membrane with a flexible cortical cytoskeleton. Biophys J. 2009;96:818–30. doi: 10.1016/j.bpj.2008.10.038. [DOI] [PMC free article] [PubMed] [Google Scholar]
- 32.Chen Y, Qin J, Cai J, Chen ZW. Cold induces micro- and nano-scale reorganization of lipid raft markers at mounds of t-cell membrane fluctuations. PLoS ONE. 2009;4:5386. doi: 10.1371/journal.pone.0005386. [DOI] [PMC free article] [PubMed] [Google Scholar]
- 33.Suzuki KGN, Kasai RS, Hirosawa KM, Nemoto YL, Ishibashi M, Miwa Y, Fujiwara TK, Kusumi A. Transient gpi-anchored protein homodimers are units for raft organization and function. Nat Chem Biol. 2012;8:774–83. doi: 10.1038/nchembio.1028. [DOI] [PubMed] [Google Scholar]
- 34.Huang JY, Lin CY. Exploring the stochastic dynamics of correlated movement of receptor proteins in plasma membranes in vivo. J Chem Phys. 2015;143:225101. doi: 10.1063/1.4936963. [DOI] [PubMed] [Google Scholar]
- 35.Hedger G, Sansom MSP, Koldsø H. The juxtamembrane regions of human receptor tyrosine kinases exhibit conserved interaction sites with anionic lipids. Sci Rep. 2015;5:9198. doi: 10.1038/srep09198. [DOI] [PMC free article] [PubMed] [Google Scholar]
- 36.Shlomovitz R, Maibaum L, Schick M. A unified picture of rafts: lipid phase behavior in a multicomponent membrane. Biophys J. 2014;106:1979–1985. doi: 10.1016/j.bpj.2014.03.017. [DOI] [PMC free article] [PubMed] [Google Scholar]
- 37.Shlomovitz R, Schick M. Model of a raft in both leaves of an asymmetric lipid bilayer. Biophys J. 2013;105:1406–1413. doi: 10.1016/j.bpj.2013.06.053. [DOI] [PMC free article] [PubMed] [Google Scholar]
- 38.Eggeling C, Ringemann C, Medda R, Schwarzmann G, Sandhoff K, Polyakova S, Belov VN, Hein B, von Middendorff C, Schönle A, Hell SW. Direct observation of the nanoscale dynamics of membrane lipids in a living cell. Nature. 2009;457:1159–1162. doi: 10.1038/nature07596. [DOI] [PubMed] [Google Scholar]
- 39.Lasserre R, Guo XJ, Conchonaud F, Hamon Y, Hawchar O, Bernard AM, Soudja SM, Rigneault PFLH, Olive D, Bismuth G, Nunes JA, Payrastre B, Marguet D, He HT. Raft nanodomains contribute to akt/pkb plasma membrane recruitment and activation. Nat Chem Biol. 2008;4:538–47. doi: 10.1038/nchembio.103. [DOI] [PubMed] [Google Scholar]
- 40.van Zanten TS, Gómez J, Manzo C, Cambi A, Buceta J, Reigada R, Garcia-Parajo MF. Direct mapping of nanoscale compositional connectivity on intact cell membranes. Proc Natl Acad Sci U S A. 2010;107:15437–15442. doi: 10.1073/pnas.1003876107. [DOI] [PMC free article] [PubMed] [Google Scholar]
- 41.Prasanna X, Chattopadhyay A, Sengupta D. Cholesterol modulates the dimer interface of the β2-adrenergic receptor via cholesterol occupancy sites. Biophys J. 2014;106:1290–1300. doi: 10.1016/j.bpj.2014.02.002. [DOI] [PMC free article] [PubMed] [Google Scholar]
Associated Data
This section collects any data citations, data availability statements, or supplementary materials included in this article.
Data Availability Statement
All datasets and software used for supporting the conclusions of this article are available from the public data repository at the website of https://zenodo.org/record/54563 .


