

Abstract
Introduction:
There is need for employing strategies to minimize measurement errors while administering semi-quantitative FFQ. The current study was planned to adapt and standardize locally available portion sizes for semi-quantitative FFQ to improve its validity and document the process of standardization of portion sizes.
Methodology:
The study was conducted in 9 villages of the INCLEN-SOMAARTH DDESS (Demographic, Development and Environmental Surveillance Site), Palwal district, Haryana, India. The subjects in these nine villages are part of a cohort study to assess the interaction between societal and household factors with food intake and physical activity of children. Systematic utensil survey was undertaken in 3 randomly chosen households per village i.e. 27 households and the portion sizes were derived from a total of 74 serving utensils. The derived sizes were classified as small (240 ml), medium (320 ml) and large (600 ml). The semi-quantitative FFQ with locally derived portion sizes was then administered to 63 children in 6-12 year age group.
Results:
The volume of food measured by the reference portion sizes generally being employed in the national surveys, would have been underestimated the food consumed by the child by 55-60% as compared to what was being consumed by the children in the study area. The correlation between food intake assessed by 24-hr recall method and FFQ using derived (local) portion sizes was better as compared to that obtained with the semi-quantitative FFQ done with reference portions.
Conclusion:
In conclusion, local portion size adaptation of FFQ for semi-quantification is useful to mitigate measurement errors associated with this technique.
Keywords: Local portion sizes, measurement error, nutrition epidemiology, semi-quantitative food frequency questionnaire (Sq FFQ)
Introduction
India is a diverse country in terms of dietary patterns, the foods consumed, cooking procedures, and the utensils. Furthermore, the country is undergoing rapid social, demographic, epidemiological, economic, and nutritional transitions leading to a gradual shift in the consumption pattern of the population from traditional foods toward modern foods.(1,2,3) To cope with the fast-changing food environment, the measurement techniques and instruments need constant refinement and updating.
Semi-quantitative food frequency questionnaire (Sq FFQ) is a list of foods in which the subjects are asked to indicate the typical frequency of consumption, along with the approximate amount/volume of food consumed each time.(4,5,6) It is generally considered as the appropriate instrument for dietary estimation for large scale epidemiological studies due to its feature of estimating long-term dietary intake and cost-effectiveness in data collection.(7) Assessment of food frequency questionnaire (FFQ) encompasses two components, i.e., portion size for measuring the quantity/amount of food consumed by an individual and the frequency of intake, which is used to measure the dietary patterns. Quantification of portion sizes is one of the sources of error in collecting food intake data, especially when the assessment of food consumed is recalled from memory.(8,9)
Along with the wide variety of foods consumed, the portion sizes vary across regions and communities in India.(10) National surveys have reported the differences in portion sizes for the foods consumed in both rural and urban areas.(11) Use of reference portion sizes (RPS) representative of the country's dietary patterns may result in inconsistency of the food estimation and thus, result in errors.(5) Unless accounted for, the inconsistency occurred can potentially further augment the nonsystematic error in estimation of foods consumed through FFQs weakening the diet–disease relationships in epidemiological studies. For reducing the error, the standardization of food items and the portion sizes are required as a methodological requirement when dietary assessments are done using a Sq FFQ.(12)
This study has been designed to standardize the portion sizes before embarking on field administration of Sq FFQs in a rural North Indian setting and determine the degree of error in estimating consumption pattern that was likely if the imputation of values based on reference portion size as used by the National Institute of Nutrition (NIN) in National Nutrition Monitoring Bureau (NNMB) surveys(11) was done. The study was conducted in nine villages of the International Clinical Epidemiology Network (INCLEN)-Synergizing Economic Development and Comprehensive Health (SOMAARTH) Demographic, Development and Environmental Surveillance Site (DDESS) in Palwal district, Haryana, India. The subjects in these nine villages were part of a cohort study to assess the interaction between societal and household factors with food intake and physical activity of children.(13)
Materials and Methods
Study site
The standardization process was performed as a preparatory activity for a larger research program funded by the Indian Council of Medical Research (ICMR) on childhood obesity. This study was conducted at the DDESS called SOMAARTH established by INCLEN in Palwal district, Haryana, North India. The surveillance site included 51 villages from three blocks of the district (Hodal, Hathin, and Palwal blocks) with a base of two lakh population. It was bounded by National Highway 2 (NH-2) on the east, Palwal-Mewat state highway on the northern side, and Nuh-Hodal state highway on the southern side. The rationale behind selecting the study site was that it was undergoing major economic and occupational transitions, affecting the lifestyle and culture of the residing population immensely. Ethical clearance for the study was obtained from the INCLEN Institutional Ethics Committee and IHE Institutional Ethics Committee. The standardization activity carried out to validate the portion sizes to be used in the FFQ was done in two phases, i.e., utensil survey for deriving the portion size and validating portion size.
Sampling and sample size
For the ICMR childhood obesity study, a cohort of 612 children in the age group of 6-12 years was assembled from nine villages (three clusters of three villages each). These villages were identified strategically by the Project Advisory Group as a representation of the SOMAARTH DDESS. For the first phase, 27 households of the cohort subjects spread over the nine villages were randomly selected (three households per village). A sample of 63 children was selected for the validation phase from the same cohort previously mentioned.
Methods adopted
Phase 1: Utensil survey — Deriving portion sizes
In the first phase, i.e., utensil survey, commonly used serving utensils (SUs) were identified to derive the community-specific portion sizes and the list of commonly consumed food items in the community. The quantities of the food items were then standardized as per the derived portion sizes (DPS). For this, a systematic survey was conducted in the sampled households wherein the commonly used SUs were identified and a 1-day 24-h dietary recall was done among children in 6-12-year-old age group. The dietary recall was done to understand the dietary patterns of the children, commonly consumed food items, and the cooking methods used in the rural community.
Two nutritionists, accompanied by the local field workers/personnel conducted the household SU survey and assessment of dietary patterns. The field survey took 6 days to complete. The activity was carried out in the month of March 2012; therefore, the list of food items obtained was season-specific. Measurements of all the SUs, i.e., bowls and glasses were done comprehensively. Depth/diameter and volume of the utensils were measured using a measuring scale (Model number.: B00TI9TMXA, Yangli Manufacturers) and standard cup (volume = 240 mL), respectively. For conducting a 24-h dietary recall in the same household, the child's mother was chosen as the respondent. She was asked to recall all the food items/drinks such as vegetable curries, tea, milk, which were cooked in the household on the previous day. The portion of the food consumed by the child was assessed in terms of household measures. The respondent was also inquired about the recipe of the food items and the method of cooking. From the systematic survey, three portion sizes were derived based on the frequency of their use and classified as small, medium, and large portion sizes to be used for the dietary assessment of the child.
The standardization of food items in terms of portion sizes was done in the Foods and Nutrition Laboratory, Department of Foods and Nutrition, Institute of Home Economics, Delhi University with prior permissions. For solid raw ingredients, a digital weighing scale (Model no.: Z3000-Surge, ZIEIS) (accuracy 0.1 g) was used for weighing; for liquid ingredients, standardized spoons and standard measuring cup (volume = 240 mL) were used. The weight of all the raw ingredients was summed to obtain the “uncooked weight of the dish.” The recipes and ingredients used for preparation of the dish were similar to that reported in the survey and the total weight of the cooked dish was estimated as “cooked weight of the dish.” The weight of the cooked dish was then estimated in the reference and the DPS. The reference set of utensils were those obtained from NIN and being used in NNMB surveys for FFQ: small-105 mL, medium-140 mL, and large-200 mL.
Phase 2: Estimation of nutrient intake using local and reference portion sizes
The second phase, i.e., validation of dietary measurement included the comparative estimation of energy and macronutrient intakes (carbohydrates, proteins, and fat) was assessed using FFQ by both the reference standard utensils and the locally used utensils against the reference dietary assessment method (3-day 24-h dietary recall). In this phase, the dietary assessment of the children (n2 = 63; 6-12 year old) was done through two methods: Administering FFQ with portion sizes identified from phase 1 (small, medium, and large) and a 3-day 24-h dietary recall [using 12 standardized portion sizes ranging 30-1,400 mL (Yangli Manufacturers) and an electronic weighing machine “Seca Culina 852 kitchen scale” (Manufactured by SECA) (accuracy-1 g)] for 2 working days and 1 holiday. The respondent chosen for the dietary assessment was the mother to assess the foods cooked in the household and an informal interaction was done with the child if any food has been consumed by him/her outside the house. For dietary recall, all the food items, which had been cooked in the household and consumed by the child were weighed in terms of the raw ingredients. The portion of the food consumed by the child was then estimated from the total cooked quantity of the food item in the household. The FFQ administered using DPS contained a list of 110 food items (also including local and context-specific food items). As part of step 2 exercise, the quantity of food consumed were imputed according to the reference utensils used across India in various surveys to estimate nutrient intake. Figure 1 describes the methodology followed for the validation task.
Figure 1.

Methodology flowchart
Results
Phase 1: Utensil survey — Deriving context-specific portion sizes
Depending on the size (big or small) and type of SU (bowl/glass), the data regarding dimensions (depth and diameter) and volumes (in terms of standard cups) of the SUs were pooled together. A total of 74 SUs (bowls = 58; drinking glass/tumbler = 16) were observed and assessed in terms of their depth, diameter, and volume as given in Table 1. It was observed that bowls were preferred to glasses for even consuming liquid foods such as water/tea/milk in the households of the rural community.
Table 1.
Dimensions and volumes of different serving utensils found in the households (n = 27 households)

We observed that most households used bowls for food/drink consumption and not glasses in this area and therefore, only measurements from bowls were used for deriving portion sizes. The bowls as measured in all the households showed a wide variation in terms of their volumes [Table 2]. The utensil volumes and their numbers were arranged in ascending order. The utensil list was divided in to three approximately equal parts. Rounded median volumes were considered for the three portion sizes (small, medium, and large). The findings as per the use of the SU in the household are given in Figure 1.
Table 2.
Different bowl volumes, frequency of use, mean, and median of the bowl volumes (n = 58 utensils)

Phase 2: Estimating nutrient intakes based on local and reference portion sizes
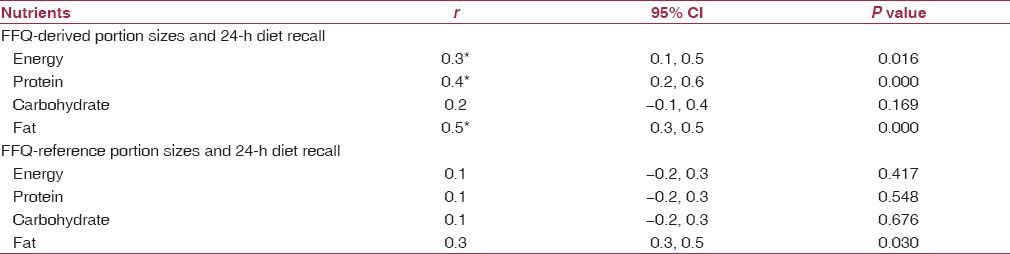
For validating portion sizes, crude daily intakes were estimated in terms of energy and macronutrients including carbohydrates, proteins, and fat from the dietary assessment methodologies including FFQ using RPS, FFQ using DPS, and 3-day 24-h dietary recall (used as reference standard). The FFQ using RPS underreported the dietary intake in terms of all the four nutrients by 10-20% when compared to 3-day 24-h dietary recall, whereas FFQ using DPS overreported the intakes by 40-61% [Table 3]. The correlation between food intake assessed by 24-h recall method and FFQ-DPS was better as compared to that obtained from imputed FFQ-RPS [Table 4]. Protein and fat intakes derived from FFQ-DPS correlated reasonably well with the reference standard but none of the nutrient intakes assessed through FFQ-RPS correlated with the 24-h recall method.
Table 3.
Median (interquartile range) crude daily nutrient intake from FFQ-reference portion size, 24-h dietary recall, FFQ-derived portion sizes, absolute and relative differences between FFQ-reference portion size and 24-h dietary recall, FFQ-derived portion sizes, and 24-h dietary recall (n = 63 children)

Table 4.
Pearson correlation r between crude nutrient intakes from FFQ standard portion sizes, diet recall, and FFQ-derived portion sizes (n = 63 children)
Discussion
The median volume of the small, medium, and large utensils and bowls used in the area were 56-67% larger than the RPS as used in national surveys [Figure 2]. Therefore, the RPS recommended and used during Sq FFQs in various national surveys were not applicable to this area. The validity of questionnaire estimates of food consumption (for nutrient intake) among between items and communities.(14) The energy, protein, and fat intakes correlated significantly with the 24-h dietary recall as the reference method (0.3, 0.4, and 0.5, respectively). The existing literature indicates that there is an agreement of 0.4-0.5 between nutrient intakes derived from Sq FFQ and the reference dietary assessment method being used.(12) Sq FFQs are reported to generally overestimate the calorie and nutrient intakes by 15–50%.(15,16) With the locally prevalent portion sizes, the Sq FFQ overestimated the food and nutrient intakes by 40-62%. In contrast, if we had used the RPS, there was a likelihood of either underestimation of the energy and nutrient intakes in the range of 10-24% or the findings could have been erratic without any systematic direction as the respondents, particularly rural illiterate individuals and children have limited ability to conceptualize portion sizes.(17,18)
Figure 2.

Modifications in the volume of portion sizes—reference and derived
There are several other limitations of the semi-quantitative FFQ methodology; it generally leads to overestimation of the nutrient intake due to the variety of the food list under one category of foods by the respondent.(19) In our study, proteins and fat showed a good correlation but carbohydrates and energy were not so well-correlated with reference method estimations. In our subjects, 56% of the total energy intake was derived from diverse sources of carbohydrates and this may be a possible reason for poor correlation with the 24-h recall method.(5) Palwal district of Haryana, India is a rural area with poor development and nutritional indicators.(20) We had interviewed the mothers in most cases for Sq FFQ but comprehension of the questionnaire may have varied according to the education and socioeconomic class of the respondents. There is no evidence at present to suggest the accuracy and precision of different food intake assessment methods by the cultural and economic backgrounds of the respondents, particularly children.(21)
To overcome the challenges of varying portion sizes in the field, two-dimensional and three-dimensional food model techniques were also used to assist the task of dietary data collection.(14,22) These however, remain unsatisfactory in the achievement of valid estimations because identifying portion sizes is a complex process in which perception, conceptualization, and memory play a role.(23) Validation of FFQ with reference to the appropriate portion sizes helps in adjusting the within-person random error.
Utensil profile and sizes differ according to the religion and social classes and are based on the social norms of the community.(24) Based on our local observations, we decided to use bowls as the reference portion instead of the tumblers for this population. For designing an epidemiological study aiming to measure the diet–disease relationship, efforts should be made to reduce the measurement error, i.e., the selection of suitable dietary instrument, by designing and planning a dietary instrument adapted to the local context and using replicate measurements of thediet.(25,26,27,28) This means that a careful consideration of potential advantages and disadvantages of including portion size in a food FFQ has to be made. The limitation of the study was the small sample size and a wider age range (6-12-year-old children among both males and females). This might have resulted in a wider interquartile range of all the crude dietary intakes as derived using different assessment techniques.
Conclusion
In conclusion, a local adaptation of the portion sizes is desirable to obtain more valid and reliable food and nutrient intakes in the community using questionnaire-based recall methods. Robust dietary data available at the community level can further act as a functional lever in mapping the process of nutrition transition.
Financial support and sponsorship
The authors acknowledge the financial support received for the study from Indian Council of Medical Research under the grants available for ICMR-CIHR joint health research colloboration on childhood obesity and UGC for its financial support to complete the PhD reserch work.
Conflicts of interest
There are no conflicts of interest.
References
- 1.Popkin BM. The nutrition transition and obesity in the developing world. J Nutr. 2001;131:871–3S. doi: 10.1093/jn/131.3.871S. [DOI] [PubMed] [Google Scholar]
- 2.Popkin BM, Adair LS, Ng SW. Global nutrition transition and the pandemic of obesity in developing countries. Nutr Rev. 2012;70:3–21. doi: 10.1111/j.1753-4887.2011.00456.x. [DOI] [PMC free article] [PubMed] [Google Scholar]
- 3.Dubé L, Labban A, Moubarac JC, Heslop G, Ma Y, Paquet C. A nutrition/health mindset on commercial big data and drivers of food demand drivers in modern and traditional systems. Ann N Y Acad Sci. 2014;1331:278–95. doi: 10.1111/nyas.12595. [DOI] [PubMed] [Google Scholar]
- 4.Ferro-Luzzi A. Keynote paper: Individual food intake survey methods. National Institute for food and nutrition research. FAO. 2002:14. [Google Scholar]
- 5.Gibson RS. Principles of Nutritional Assessment. 2nd ed. Dunedin, New Zealand: Oxford University Press; 2005. pp. 46–47. [Google Scholar]
- 6.Gemming L, Utter J, Ni Mhurchu C. Image-assisted dietary assessment: A systematic review of the evidence. J Acad Nutr Diet. 2015;115:64–77. doi: 10.1016/j.jand.2014.09.015. [DOI] [PubMed] [Google Scholar]
- 7.Shim JS, Oh K, Kim HC. Dietary assessment methods in epidemiologic studies. Epidemiol Health. 2014;36:e2014009. doi: 10.4178/epih/e2014009. [DOI] [PMC free article] [PubMed] [Google Scholar]
- 8.Schwartz J, Byrd-Bredbenner C. Portion distortion: Typical portion sizes selected by young adults. J Am Diet Assoc. 2006;106:1412–8. doi: 10.1016/j.jada.2006.06.006. [DOI] [PubMed] [Google Scholar]
- 9.Johansson I, Hallmans G, Wikman A, Biessy C, Riboli E, Kaaks R. Validation and calibration of food-frequency questionnaire measurements in the North Sweden Health and Disease cohort. Public Health Nutr. 2002;5:487–96. doi: 10.1079/phn2001315. [DOI] [PubMed] [Google Scholar]
- 10.NSS Report No. 541 (66/1.0/3). Household consumption of various goods and services in India. Government of India February 2012 [Google Scholar]
- 11.NNMB Technical Report No. 26. Diet and Nutritional status of rural population, prevalence of hypertension and diabetes among adults and infants and young child feeding practices. 3rd Repeat Survey. 2012 [Google Scholar]
- 12.Cade J, Thompson R, Burley V, Warm D. Development, validation and utilization of food-frequency questionnaires-a review. Public Health Nutr. 2002;5:567–87. doi: 10.1079/PHN2001318. [DOI] [PubMed] [Google Scholar]
- 13.SOMAARTH: Where we are. [Last accessed on 2015 Oct 7]. Available from http://somaarth.org/index.php/about-us/where-we-are .
- 14.Nelson M, Bingham SA. Assessment of food consumption and nutrient intake. In: Margetts BM, Nelson M, editors. Design Concepts in Epidemiology. 2nd ed. Oxford: Oxford University Press; 1997. pp. 123–69. [Google Scholar]
- 15.O'Connor J, Ball EJ, Steinbeck KS, Davies PS, Wishart C, Gaskin KJ, et al. Comparison of total energy expenditure and energy intake in children aged 6-9 y. Am J Clin Nutr. 2001;74:643–9. doi: 10.1093/ajcn/74.5.643. [DOI] [PubMed] [Google Scholar]
- 16.Jarman M, Fisk CM, Ntani G, Crozier SR, Godfrey KM, Inskip HM, et al. Southampton Women's Survey Study Group. Assessing diets of 3 year old children: Evaluation of a food frequency questionnaire. Public Health Nutr. 2014;17:1069–77. doi: 10.1017/S136898001300102X. [DOI] [PMC free article] [PubMed] [Google Scholar]
- 17.Cullen KW, Zakeri I. The youth/adolescent questionnaire has low validity and modest reliability among low-income African-American and Hispanic seventh- and eighth-grade youth. J Am Diet Assoc. 2004;104:1415–9. doi: 10.1016/j.jada.2004.06.022. [DOI] [PubMed] [Google Scholar]
- 18.Lietz G, Barton KL, Longbottom PJ, Anderson AS. Can the EPIC food-frequency questionnaire be used in adolescent populations? Public Health Nutr. 2002;5:783–9. doi: 10.1079/PHN2002344. [DOI] [PubMed] [Google Scholar]
- 19.Coulston AM, Boushey CJ, Ferruzzi MG. Nutrition in the Prevention and Treatment of Disease. 3rd ed. Elsevier; 2013. pp. 5–46. [Google Scholar]
- 20.District Fact sheet Palwal. DLHS-4, Ministry of Health and Family Welfare 2012-13. [Last accessed on 2015 Sep 13]. Available from: https://nrhm-mis.nic.in/DLHS4/Haryana/District%20Factsheets/Palwal.pdf .
- 21.Biró G, Hulshof KF, Ovesen L, Amorim Cruz JA. EFCOSUM Group. Selection of methodology to assess food intake. Eur J Clin Nutr. 2002;56(Suppl 2):S25–32. doi: 10.1038/sj.ejcn.1601426. [DOI] [PubMed] [Google Scholar]
- 22.Foster E, Matthews JN, Nelson M, Harris JM, Mathers JC, Adamson AJ. Accuracy of estimates of food portion size using food photographs – The importance of providing age-appropriate tools. Public Health Nutr. 2006;9:509–14. doi: 10.1079/phn2005872. [DOI] [PubMed] [Google Scholar]
- 23.Turconi G, Guarcello M, Berzolari FG, Carolei A, Bazzano R, Roggi C. An evaluation of a colour food photography atlas as a tool for quantifying food portion size in epidemiological dietary surveys. Eur J Clin Nutr. 2005;59:923–31. doi: 10.1038/sj.ejcn.1602162. [DOI] [PubMed] [Google Scholar]
- 24.Brienza V, Elserafi J, Herman P. The portion size effect: A review. JULS. 2010;4:78–80. [Google Scholar]
- 25.Kippins V, Subar AF, Midthune D, Freedman LS, Ballard-Barbash R, Troiano RP, et al. Structure of dietary measurement error: Result of the OPEN biomarker study. Am J Epidemiol. 2003;158:14–26. doi: 10.1093/aje/kwg091. [DOI] [PubMed] [Google Scholar]
- 26.Kippins V, Midthune D, Freedman LS, Bingham S, Schatzkin A, Subar A, et al. Empirical evidence of correlated biases in dietary assessment instruments and its implications. Am J Epidemiol. 2001;153:394–403. doi: 10.1093/aje/153.4.394. [DOI] [PubMed] [Google Scholar]
- 27.Paul DR, Rhodes DG, Kramer M, Baer DJ, Rumpler WV. Validation of food frequency questionnaire by direct measurement of habitual ad libitum food intake. Am J Epidemiol. 2005;162:806–14. doi: 10.1093/aje/kwi279. [DOI] [PubMed] [Google Scholar]
- 28.Basic Dietary analysis: Important Statistical Considerations Regarding Dietary Data Analyses. [Last accessed on 2015 Oct 7]. Available from: http://www.cdc.gov/nchs/tutorials/Dietary/index.htm .