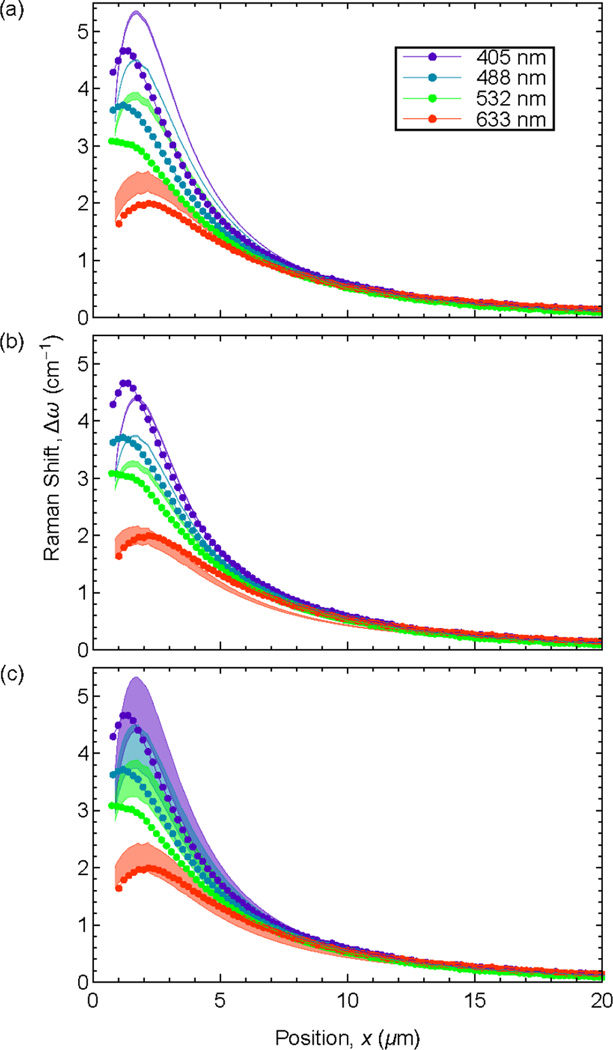
Fig. 8.
Plot of Raman shifts measured by CRM (symbols) adjacent to the wedge indentation compared with values simulated by FEA and opto-mechanical analysis (bands). The effects of selection of information depths (Table 3) are shown in (a) using PDPs from [47] and (b) using PDPs from [48]. The effects of selection of PDPs and information depths (Tables 2 and 3) are shown in (c).

