

Abstract
Aim
To compare detection of and referral for developmental and emotional problems in a school readiness screening programme (New Zealand Before School Check, B4SC) with that of a comprehensive neurodevelopmental assessment.
Methods
Prospective cohort study of children (n=274) born at risk of neonatal hypoglycaemia and recruited to a follow-up study of neurodevelopmental outcomes at 4.5 years (CHYLD Study). Children identified as of significant concern for developmental and emotional problems, and referrals made, were compared in the B4SC and CHYLD Study. Scores of the parent-completed Strengths and Difficulties Questionnaire (SDQ-P) used in both assessments were compared.
Results
Of 274 children who underwent clinical neurodevelopmental assessment at a mean (SD) age of 53.3 (1.8) months, 237 had the B4SC developmental and emotional health screening. Of these, 44 (19%) children met B4SC referral criteria and 15 (6%) were referred but only 21 (9%) children met CHYLD referral criteria and 10 (4%) were referred. Twelve children (5%) met both the B4SC and CHYLD referral criteria and 2 were referred by both. When assessed twice 39 (17%) children changed SDQ-P category. Children who did not have B4SC screening had higher mean total difficulties score (10.5 vs 8.2, P=0.009) and were more likely to have cognitive delay than those who were screened (19% vs 8%, P=0.04).
Conclusions
More children met referral criteria for the B4SC screening programme than for a more comprehensive neurodevelopmental assessment. Children who did not have screening had higher incidence of cognitive and behaviour problems than those who did.
Keywords: child behaviour, emotional disturbances, early intervention, referral
Introduction
Developmental and emotional health problems are common in young children, with an incidence of up to 18% in the general population,1-3 and may lead to social and academic difficulties in later childhood and beyond.4, 5 Early intervention in children with developmental and emotional problems has been shown to improve outcomes.6, 7 However, these problems are difficult to detect during regular health check visits. Low sensitivity and specificity has been reported when identifying these problems based solely on clinical judgement.8 As a result, children are often only identified as having a difficulty after they enter school, when they have missed the opportunity for early intervention.6 Therefore, many countries have implemented screening for developmental and emotional problems as part of routine child health surveillance to enable early detection and referral to child development services.9-13
While the value of parent evaluation of children’s developmental and emotional status remains controversial,14-16 most screening programs use brief parental questionnaires to identify children with problems. Clinical assessment by a psychologist is usually not included because of cost and time constraints. However, an assessment using cognitive tests and a multidisciplinary clinical approach would be expected to provide a more comprehensive understanding of a child’s abilities and problems.17
The Before School Check (B4SC) is a school readiness screening programme available for all 4-year-olds in New Zealand. It includes screening for developmental and emotional health problems using questionnaires completed by parents and preschool teachers18, and results are used to initiate referral for additional assessment and intervention where required.
The aims of this study were threefold: first, to compare the frequency of identification of developmental and emotional problems and of referrals made as a result of parent reports obtained for the B4SC with those as a result of a comprehensive neurodevelopmental assessment obtained by trained examiners; second, to determine whether parent-reported behavioural assessments give similar results when administered in different environments and for different purposes (screening vs research); and third, to compare the developmental characteristics of children who did and did not participate in B4SC screening.
Methods
Design
This study was part of a larger prospective cohort study of babies born at risk of neonatal hypoglycaemia, the CHYLD Study.19 Children were enrolled at birth (2006-2010) to either the BABIES20 or Sugar Babies21 studies at Waikato Women’s Hospital, Hamilton, New Zealand. Babies were born with one or more risk factors for neonatal hypoglycaemia: diabetic mother, late preterm (32 to 36 completed weeks’ gestation), small (<2500g or <10th centile), large (>4500g or >90th centile) or other risk (feeding difficulties or respiratory distress). From 614 babies recruited to neonatal studies, 604 were eligible for 4.5 year follow-up. A cohort of 274 children born between 2006 and 2010 and assessed at 4.5 years in the CHYLD Study before August 2014 are reported here.
Families were invited to participate in this follow-up study when the child was 4.5 years’ corrected age. Children underwent a detailed assessment of neurodevelopment, vision, and general health status. Data were collected by questionnaire on household demographics, including income, education, and number of children. New Zealand deprivation index (NZDEP), based on the place of residence, was used as a measure of socio-economic status, where decile one is the least deprived and ten is most deprived.22
The study was approved by the Northern Y Health and Disability Ethics Committee (reference number NTY/10/03/021). Parents provided written consent for the assessment and to access the B4SC information.
Neurodevelopmental assessment
Neurodevelopmental assessment for the CHYLD Study was undertaken by trained examiners who were blinded to perinatal history. Each assessment was videoed to standardise assessment administration and scoring. Neurodevelopmental tests included the Wechsler Preschool and Primary Scale of Intelligence 3rd edition (WPPSI-III),17 Beery-Buktenica Developmental Test of Visual Motor Integration, 6th Edition, Phelps Kindergarten Readiness Scale (Items 6-8), Strengths and Difficulties Questionnaire for 4-10 year olds (SDQ-P), Child Behaviour Checklist for ages 1.5-5 years (CBCL), Social Communication Questionnaire (SCQ) and tests of executive function. Parents completed paper-pencil questionnaires at the time of assessment or took it home for completion and posted it back.
Children who had WPPSI full Scale IQ (FSIQ) composite score or two or more subset scores ≤79, or who did not complete the neurodevelopmental assessment due to behavioural problems, or when an examiner or a parent had significant concerns about the child’s development or social-emotional status, were considered ‘of concern’. For these children, results of all assessments (WPPSI, Beery, Phelps, SDQ, CBCL, SCQ) and video recording of WPPSI assessment were reviewed by a developmental psychologist who made a clinical judgement whether the child met clinical criteria for referral. Parents were informed about the need of referral and referral was made when they agreed to it. Children were not excluded from the analysis if they had vision, neurological or other deficits identified during the neurodevelopmental assessments.
Preschool screening assessment
All children in New Zealand are encouraged to have a screening assessment of school readiness after their fourth birthday, the Before School Check (B4SC).18 Development and emotional health are assessed using the Parental Evaluation of Developmental Status (PEDS) questionnaire, and SDQ completed by parents (SDQ-P) and preschool teachers (SDQ-T). We accessed PEDS and SDQ scores from the B4SC national information system using the National Health Index number assigned to each child at birth.
PEDS assigns children to pathways (A, B, C, D, E) according to parental concerns about cognitive development, language, motor skills, emotional health and self-help.23 Reported sensitivity is 86% and specificity is 83% to predict any developmental and emotional health problems.24
SDQ is a behavioural screening questionnaire that has 25 questions divided into 5 subscales.25 Four of the subscales, emotional symptoms, conduct problems, hyperactivity, and peer problems, are combined to give a total difficulties score. Children are classified as ‘normal’, ‘borderline’ and ‘abnormal’ based on the total SDQ score. The fifth subscale, the strengths of a child, is not used in the B4SC referral process. SDQ completed by multiple informants was reported to predict disorders with a sensitivity of 63.3% and specificity of 94.6% in a community sample of 5-15 year olds.26 For the subgroup of 5-10 year-old children, SDQ-P predicted problems with sensitivity of 30% and this figure increased to 62% when SDQ-T scores were added. Similar findings were reported for 3-year-olds when SDQ-P abnormal cut-offs predicted problems with a 30% sensitivity and 96% specificity.27 Test-retest reliability within 4-6 months assessments was 0.62.25
The B4SC referral criteria are an abnormal score on SDQ-P (≥17) or SDQ-T (≥16), or PEDS pathway A (two or more significant predictive concerns) or B (one significant predictive concern) and these children are classified ‘of significant concern’. Children who do not meet referral criteria but have borderline SDQ-P (14-16) or SDQ-T (12-15) scores or are in PEDS pathway C (non-significant concerns) or D (difficulties communicating) are classified as ‘of some concern’.
Statistical analysis
Analyses were performed using JMP Software, Version 11.2.0 (SAS Institute Inc., Cary, NC, 2013). SDQ-P scores were compared from the B4SC and the CHYLD assessment, and between first and second assessments, using paired t-tests. Agreement between the first and second assessments was compared by change in clinical category (chi-square test), and by kappa agreement coefficient.28 Referral outcomes of the B4SC and CHYLD assessment were compared using chi-square tests and ANOVA. Data are presented as number (percent), mean (standard deviation), median (interquartile range) and mean difference (95% confidence interval).
Results
For 274 children included in the analysis mean (SD) age at assessment was 53.3 (1.8) months. Of these, 237 children underwent B4SC screening at 49.8 (2.8) months. The subgroup of included children was not different from the rest of the study children eligible for the 4.5 year follow-up in ethnicity and neonatal risk factors (data not shown), but lived in less deprived areas (NZ DEP 6 (4; 9) vs 7 (5; 9) for the rest of study children).
Half of the cohort were boys and one third were Māori (Table 1). The majority of households had two children. Over two thirds of mothers had attended a tertiary education institution.
Table 1.
Cohort characteristics.
| Cohort† N=274 | Had B4SC screening
|
||
|---|---|---|---|
| Yes N=237 |
No N=37 |
||
| Boys | 138(50) | 118(50) | 20(54) |
| Ethnicity: | |||
| New Zealand European | 144(54) | 126(55) | 18(50) |
| Māori | 86(32) | 72(31) | 14(39) |
| Other | 36(14) | 32(14) | 4(11) |
| Neonatal risk factor‡: | |||
| Pre-term | 124(45) | 109(46) | 15(41) |
| IDM | 91(33) | 82(35) | 9(24) |
| Small | 84(31) | 68(29) | 16(43) |
| Large | 56(20) | 55(23) | 1(3) |
| Other | 13(5) | 9(4) | 4(11) |
| Gestational age, weeks | 37(36; 39) | 37(36; 39) | 37(36; 39) |
| Number of siblings: | |||
| 0 | 38(14) | 32(14) | 6(17) |
| 1 | 107(41) | 95(42) | 12(33) |
| 2 | 76(29) | 65(29) | 11(31) |
| ≥3 | 43(16) | 36(16) | 7(19) |
| Mother’s education#: | |||
| School | 75(29) | 66(29) | 9(26) |
| Tertiary | 187(71) | 161(71) | 26(74) |
| Household income: | |||
| ≤ $30,000 | 36(16) | 30(16) | 6(21) |
| $30,001 – 70,000 | 80(36) | 67(35) | 13(46) |
| ≥ $70,001 | 104(47) | 95(49) | 9(32) |
| New Zealand deprivation index: | 6(4; 9) | 6(4; 9) | 7(3; 10) |
Data are number (percent) or median (IQR).
Characteristics of children who did and did not have the B4SC are not significantly different. IDM, infant of a diabetic mother. Data missing for some variables: ethnicity, 8; number of siblings, 10; mother’s education, 12; household income, 54; deprivation index, 1.
Risk factors not mutually exclusive.
Highest level of education attended.
Preschool screening vs clinical neurodevelopmental assessment
At the B4SC 44/237 (19%) children were rated as of significant concern, of whom 15 (34%) were referred (Figure 1). Six children not meeting criteria were also referred (Figure 1). PEDS identified more children of parental concern than SDQ, but more were referred because of SDQ results (Table 2). In the CHYLD Study, 21/237 children (9%) were of significant concern after review of all assessments by psychologist, and 10/21 (48%) of these children were referred (Figure 1). Twelve (5%) children met both the B4SC and CHYLD Study referral criteria, two of whom were referred after both assessments. Five of 29 children who met the B4SC criteria and were not referred met CHYLD referral criteria, and were all referred after that assessment. Similarly, of 11 children that met CHYLD referral criteria and were not referred, 5 met the B4SC referral criteria and 2 of them were referred by the B4SC programme (Figure 1).
Figure 1.
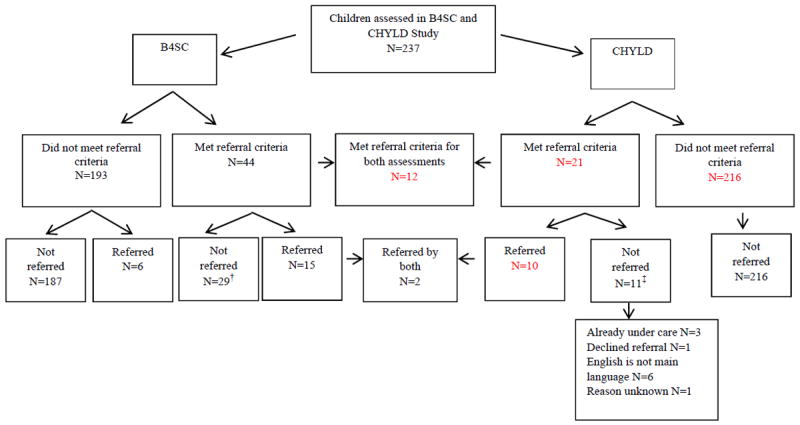
B4SC and CHYLD Study referrals
B4SC, Before School Check. †5 of these children met CHYLD criteria and all were referred by CHYLD; ‡5 of these children met B4SC referral criteria, 2 were referred by the B4SC. See text for definitions of referral criteria.
Table 2.
The B4SC outcome categories and referrals.
| SDQ-P | SDQ-T | SDQ: P or T† | PEDS | Any test† | ||||
|---|---|---|---|---|---|---|---|---|
|
|
||||||||
| N=234 | N=152 | N=237 | Referred N=14 | N=234 | Referred N=10 | N=237 | Referred N=21 | |
| No concern | 214(91) | 146(96) | 213(90) | 4(29) | 173(74) | 0(0) | 163(69) | 3(14) |
| Of some concern | 7(3) | 3(2) | 9(4) | 2(14) | 30(13) | 3(30) | 30(13) | 3(14) |
| Of significant concern | 13(6) | 3(2) | 15(6) | 8(57) | 31(13) | 7(70) | 44(19) | 15(71) |
Data are number (percent).
Categorised by the worst score category and referral outcome of all tests. SDQ, the Strengths and Difficulties Questionnaire, P, parent version; T, teacher version; PEDS, Parental Evaluation of Developmental Status.
Screening outcomes using SDQ-P in different settings
The mean (SD) SDQ-P total difficulties score was 6.5 (4.7) at the B4SC and 8.2 (4.7) in the CHYLD Study, with a mean difference (95% CI) of 1.7 (1.2, 2.3, P=0.0001). The median (IQR) interval between the B4SC and CHYLD SDQ-P assessments was 111 (43; 149) days, and 206 (89%) children completed the B4SC before the CHYLD Study assessment. Mean (SD) total difficulties score was 6.7 (4.7) at the first assessment and 8.0 (4.8) at the second assessment, with a mean difference (95% CI) of 1.3 (0.7, 1.9; P=0.0001) and fair overall agreement between assessments (kappa 0.26). More children had borderline scores at the second than the first assessment. Almost a fifth of the cohort changed category between assessments, but the interval between assessments did not appear to affect this (Table 3).
Table 3.
SDQ-P category outcomes for first and second assessments and for short and long time intervals between assessments.
| Assessment order
| ||||
|---|---|---|---|---|
| Second assessment | First assessment
|
|||
| Abnormal | Borderline | Normal | Total | |
| Abnormal
|
4(2) | 1(0) | 7(3) | 12(5) |
| Borderline
|
5(2) | 2(1) | 18(8) | 25(11) |
| Normal
|
4(2) | 4(2) | 189(81) | 197(84) |
| Total
|
13(6) | 7(3) | 214(91) | 234(100) |
| Agreement between assessments | 0.26(0.12; 0.39) | |||
|
| ||||
|
Time between assessments
| ||||
| <4 months N=123 |
≥4 months N=111 |
|||
|
| ||||
| First | Second | First | Second | |
|
| ||||
| Abnormal | 6(5) | 8(7) | 7(6) | 4(4) |
| Borderline | 5(4) | 8(7) | 2(2) | 17(15) |
| Normal | 112(91) | 107(87) | 102(92) | 90(81) |
| Changed category between assessments | 19(15) | 20(18) | ||
| Normal at first but abnormal at second assessment† | 4(3) | 3(3) | ||
| Abnormal at first but normal at second assessment | 2(2) | 2(2) | ||
| Agreement between assessments | 0.24(0.02; 0.45) | 0.28(0.10; 0.46) | ||
Data are number (percent) or kappa coefficient (95% CI). SDQ-P, the Strengths and Difficulties Questionnaire (parent).
Developmental and emotional health of children who did not have the B4SC
Thirty seven children (14%) in the CHYLD Study cohort did not have the B4SC. Demographic and neonatal characteristics of these children were not significantly different from those who did have the B4SC (Table 1). However, children who did not have the B4SC were twice as likely to have concerning cognitive scores, had significantly lower FSIQ and higher mean SDQ-P score than children who did have B4SC screening (Table 4).
Table 4.
CHYLD assessment outcomes and referral status for children who did and did not have B4SC screening.
| Category | Cohort N=274 | B4SC Screening
|
P | |
|---|---|---|---|---|
| Yes N=237 | No N=37 | |||
| Mean (SD) SDQ-P score | 8.5(4.9) | 8.2(4.7) | 10.5(5.6) | 0.009 |
| No concern SDQ-P | 226(82) | 200(84) | 26(70) | 0.06 |
| Of some concern SDQ-P | 30(11) | 25(11) | 5(14) | |
| Of significant concern SDQ-P | 18(7) | 12(5) | 6(16) | |
| Low WPPSI scores† | 25(9) | 18(8) | 7(19) | 0.04 |
| WPPSI Full Scale IQ | 99(15) | 100(14) | 93(16) | 0.004 |
| Referred | 11(4) | 10(4) | 1(3) | 0.6 |
Data are mean (SD) or number (percent). SDQ-P, the Strengths and Difficulties Questionnaire (parent); B4SC, Before School Check.
Full scale IQ (intelligence quotient) or ≥2 subset scores ≤79. WPPSI Full Scale IQ scores were available for 274 (100%) children, all subtest WPPSI scores were available for 257 (94%) of children.
Discussion
This study compared detection of and referral for developmental and emotional problems in the New Zealand preschool screening programme with that of a comprehensive neurodevelopmental assessment. More children were identified as of significant concern in the B4SC, based on parent-completed questionnaires, than in the CHYLD neurodevelopmental assessment. However, 14% of our cohort did not have the B4SC and these children had higher incidence of cognitive delay and developmental and emotional problems than children who did have B4SC screening. Furthermore, our findings show that using SDQ-P as a single assessment screening tool can lead to different outcomes when completed in different settings and for different purposes.
Preschool screening tests vs clinical neurodevelopmental assessment
In the B4SC almost one fifth of children were identified as being of significant concern, thus meeting criteria for referral for additional assessment. In contrast, in the CHYLD neurodevelopmental assessment only 9% of children were considered of significant concern.
Parent completed questionnaires identified around 15-20% of concerning children in other screening programs; referral rates ranged from less than a third29 to over half30 of these children. Similar to our results, not all children identified as concerning by a questionnaire have a cognitive problem when tested using examiner administered cognitive tests.31 This is appropriate, as screening programs are designed to identify children with possible health problems who may benefit from further assessment, some of whom will then be found not to have a significant difficulty. Parental questionnaires may also over-identify children with problems, as parents may not understand what normal development is for age.32
Many children who met criteria for referral were not referred; 29 (66%) in the B4SC and 11 (52%) in CHYLD. These non-referral rates are similar to previously reported for the B4SC in a single region of New Zealand, where 129 of 199 children (65%) who met referral criteria were not actually referred.10 In the CHYLD Study some children were not referred because their low WPPSI scores were judged to be due to limited English language rather than cognitive delay. Conversely, some children who had low language scores were referred at parental request. The B4SC expects to refer all children in PEDS pathway A and rate of referral for other pathways to be lower. Discussion with parents regarding the need for referral is included in the B4SC screening, and this can help clarify additional concerns that may reflect inappropriate expectations of some parents. We have no information about why some children who met B4SC criteria in out cohort were not referred, but of 199 children who met the B4SC referral criteria in one region of New Zealand in 2010-2011, 57 (29%) were judged by clinicians as not in need of a referral, 36 (18%) were already under care, and parents of another 36 (18%) children declined referral.10 An internal review of the B4SC also reported in 2014 that there was wide variation in referral processes and inconsistent recording of examiners’ decisions about referrals.33
Our results show that using different tools (clinical assessment vs parent-completed questionnaire) that test different domains result in different referral outcomes for the same group of children.34 This is consistent with other studies that have shown that implementation of screening programmes is challenging, and that children who fail screening have variable referral outcomes.35 This may be due to many factors such as parental view of the need for services and availability of services that could accept the referral. Therefore, clear referral criteria and pathways are essential to ensure that those identified by screening programmes as having problems do indeed receive the additional assessment and interventions intended.
Screening outcomes using SDQ-P in different settings
Overall, the mean total difficulties score in our cohort was similar to those obtained in other studies.36 However, scores were higher at the second assessment, which in most cases was the CHYLD Study assessment. Importantly, the agreement between first and second assessment was only fair, and outcome category differed in 39 (17%) children, independent of the time between assessments.
Such differences in outcome categories might be due to changes in a child’s behaviour over time or changes in parental perception. For example, it is possible that parents may be more critical in their evaluation of a child’s behaviour or have accepted the presence of a problem when completing the SDQ a second time.37
The change in a category between assessments could also be due to the change in the setting where the SDQ was completed. Almost 90% of first assessments were part of the B4SC which included examination of several other aspects of health such as hearing and vision. CHYLD assessments included an in-depth assessment of neurodevelopment in a home-like setting, which may give the impression to parents that their answers had greater value.
The same screening tools are often used to detect the need for and then measure the effect of interventions. One evaluation of children referred to mental health services showed a decrease of 3.2 SDQ points at 6 month follow-up.38 In a New Zealand evaluation of a 4-6 week mental health camp intervention, SDQ scores decreased by 2.9 points in the high risk population and the number of children categorised as abnormal decreased by 13%, but several children previously categorised as normal changed category to borderline or abnormal.39 Our findings suggest that changes in SDQ scores of this magnitude may occur with repeated administration of the questionnaire even in the absence of interventions when the setting where assessment is done changes. Thus, in children requiring repeated assessment to evaluate the effect of an intervention, use of additional tools such as the SDQ added value score40 or follow-up questions on behavioural change since the last visit might be a more appropriate approach than repeated administration of the same SDQ.
Developmental and emotional health of children who did not have preschool screening
Children who did not have developmental and emotional health screening at the B4SC were more likely to have borderline cognitive scores, lower FSIQ and higher SDQ scores than those who were screened. This is of concern, as these children have missed the opportunity to receive support before school entry; the primary purpose of the B4SC programme. Other studies have also reported that children with significant concerns are less likely to attend surveillance programs.41 However, although low socio-economic status has been associated with high rate of emotional problems2 and low utilisation of free health services,42 we did not find any difference in socio-economic status between those who did and did not have the B4SC screening.
Study limitations
We did not have information about the reasons for the B4SC referral decisions and could not investigate variation between test scores and referral outcomes in more detail. For example, advice may have been offered on the day of screening instead of referral.
In addition, we did not control for the time interval between SDQ-P administrations, and could not be sure that interventions of which we were not aware between the two assessments may have contributed to the different scores. It is also possible that a different parent or caregiver completed the SDQ on each occasion, although this was likely to have occurred infrequently as the mother accompanied the child for the majority of assessments.
This cohort of children may not be representative of New Zealand general preschool population, since they were all born with risk factors at a single hospital. However, it is a unique cohort of children with diverse neonatal and socio-demographic characteristics and therefore it is particularly important to provide effective screening and interventions in a timely manner to this group of children.
Conclusions
The B4SC pre-school screening assessment identified more children with developmental and emotional health problems than did clinical neurodevelopmental assessment. However, the majority of children meeting referral criteria for either assessment were not actually referred. Repeated administration of the SDQ-P in different settings and for different purposes may not be a reliable approach to evaluate behavioural interventions in pre-school children. Finally, children who miss out on preschool screening have higher rates of cognitive delay and behavioural difficulties. Pre-school screening programmes may be more effective if every effort is made to screen all children, and referral processes are clear and consistently applied. Further investigation of the reasons for failure to attend the B4SC may help improve the effectiveness of this programme.
What is already known on this topic
Parent questionnaires are often used to screen young children for developmental and emotional health problems as part of routine child health surveillance.
Screening is intended to identify children who may benefit from further assessment and intervention where appropriate.
Clinical neurodevelopmental tests are costly and time consuming, but may detect different problems from those identified by screening questionnaires.
What this study adds
Screening for developmental and emotional problems using questionnaires results in a different referral pattern compared to clinical neurodevelopmental assessment, and referral criteria were inconsistently applied.
Repeated screening using the same parental questionnaire in different settings and for different purposes may give different screening outcomes.
Children who were not screened for developmental and emotional health had a higher incidence of cognitive delay and behavioural problems than children who were screened.
Acknowledgments
We wish to acknowledge the contribution of The Children with Hypoglycaemia and their Later Development (CHYLD) Study team: Judith Ansell, Coila Bevan, Nataliia Burakevych, Ellen Campbell, Jessica Charlton, Tineke Crawford, Kelly Fredell, Karen Frost, Claire Hahnhaussen, Safayet Hossin, Greg Gamble, Anna Gsell, Yannan Jiang, Kelly Jones, Sapphire Martin, Chris McKinlay, Grace McKnight, Christina McQuoid, Neil Mickelwood, Janine Paynter, Jenny Rogers, Ryan San Diego, Kate Sommers, Heather Stewart, Anna Timmings, Jess Wilson, from the Liggins Institute, University of Auckland; Nicola Anstice, Arijit Chakraborty, Robert Jacobs, Gill Matheson, Nabin Paudel, Sandy Yu, from the Department of Optometry and Vision Science, University of Auckland. Max Berry, Arun Nair, Alexandra Wallace, Phil Weston from the Department of Paediatrics, Waikato Hospital, Hamilton, New Zealand. Aaron Le Compte, Department of Engineering, University of Canterbury. The CHYLD Steering Group: Jane Alsweiler, Department of Paediatrics; Child and Youth Health, University of Auckland, J. Geoffery Chase, Department of Engineering, University of Canterbury, Jane Harding, Liggins Institute, University of Auckland, Deborah Harris, Newborn Intensive Care Unit, Waikato District Health Board, Ben Thompson, Department of Optometry and Vision Science, University of Auckland, Trecia Wouldes, Department of Psychological Medicine, University of Auckland, Auckland, New Zealand. International Advisory Group: Heidi Feldman, Stanford University School of Medicine, USA; William Hay, University of Colorado School of Medicine, USA; Darrell Wilson, Stanford University School of Medicine, USA; Robert Hess, McGill Vision Research Unit, Department of Ophthalmology, McGill University, USA.
We also wish to acknowledge the B4SC team and New Zealand Ministry of Health for sharing the B4SC data that was used in the analysis.
Funding This research was supported by grants from The Health Research Council of New Zealand and Auckland Medical Research Foundation. The project described was supported by Grant Number R01HD069622 from the Eunice Kennedy Shriver National Institute of Child Health and Human Development. The content is solely the responsibility of the authors and does not necessarily represent the official views of the Eunice Kennedy Shriver National Institute of Child Health and Human Development or the National Institutes of Health.
Footnotes
Contributors
NB and the CHYLD Study team collected data. NB wrote the initial draft. CJDM, JMA, JEH and TAW reviewed and revised the manuscript. All authors participated in the analysis, interpretation of results and discussion, and approved the final manuscript.
Conflict of interests None.
Ethics approval Approved by the Northern Y Health and Disability Ethics committee (approval number NTY/10/03/021).
Provenance and peer review Not commissioned; externally peer reviewed.
Data sharing statement Additional information is available on request from the corresponding author.
References
- 1.Egger HL, Angold A. Common emotional and behavioral disorders in preschool children: Presentation, nosology, and epidemiology. J Child Psychol Psychiatry Allied Discip. 2006;47:313–37. doi: 10.1111/j.1469-7610.2006.01618.x. [DOI] [PubMed] [Google Scholar]
- 2.Holtz CA, Fox RA, Meurer JR. Incidence of behavior problems in toddlers and preschool children from families living in poverty. J Psychol Interdiscip Appl. 2014;149:161–74. doi: 10.1080/00223980.2013.853020. [DOI] [PubMed] [Google Scholar]
- 3.Boyle CA, Boulet S, Schieve LA, Cohen RA, Blumberg SJ, Yeargin-Allsopp M, et al. Trends in the prevalence of developmental disabilities in US children, 1997-2008. Pediatrics. 2011;127:1034–42. doi: 10.1542/peds.2010-2989. [DOI] [PubMed] [Google Scholar]
- 4.Canino G, Shrout PE, Rubio-Stipec M, Bird HR, Bravo M, Ramírez R, et al. The DSM-IV Rates of Child and Adolescent Disorders in Puerto Rico: Prevalence, Correlates, Service Use, and the Effects of Impairment. Arch Gen Psychiatry. 2004;61:85–93. doi: 10.1001/archpsyc.61.1.85. [DOI] [PubMed] [Google Scholar]
- 5.Caspi A, Moffitt TE, Newman DL, Silva PA. Behavioral observations at age 3 years predict adult psychiatric disorders: Longitudinal evidence from a birth cohort. Arch Gen Psychiatry. 1996;53:1033–9. doi: 10.1001/archpsyc.1996.01830110071009. [DOI] [PubMed] [Google Scholar]
- 6.Manning M, Homel R, Smith C. A meta-analysis of the effects of early developmental prevention programs in at-risk populations on non-health outcomes in adolescence. Child Youth Serv Rev. 2010;32:506–19. [Google Scholar]
- 7.Campbell FA, Pungello EP, Burchinal M, Kainz K, Pan Y, Wasik BH, et al. Adult outcomes as a function of an early childhood educational program: An abecedarian project follow-up. Dev Psychol. 2012;48:1033–43. doi: 10.1037/a0026644. [DOI] [PMC free article] [PubMed] [Google Scholar]
- 8.Sheldrick RC, Merchant S, Perrin EC. Identification of developmental-behavioral problems in primary care: A systematic review. Pediatrics. 2011;128:356–63. doi: 10.1542/peds.2010-3261. [DOI] [PubMed] [Google Scholar]
- 9.Alexander KE, Brijnath B, Mazza D. ‘Can they really identify mental health problems at the age of three?’ Parent and practitioner views about screening young children’s social and emotional development. Aust New Zealand J Psychiatry. 2013;47:538–45. doi: 10.1177/0004867413476756. [DOI] [PubMed] [Google Scholar]
- 10.Hedley C, Thompson S, Morris Matthews K, Pentecost M, Wivell J, Frost AS, et al. The B4 school check behaviour measures: findings from the Hawke’s Bay evaluation. Nurs Prax N Z. 2012;28:13–23. [PubMed] [Google Scholar]
- 11.Dishion TJ, Shaw D, Connell A, Gardner F, Weaver C, Wilson M. The family check-up with high-risk indigent families: Preventing problem behavior by increasing parents’ positive behavior support in early childhood. Child Dev. 2008;79:1395–414. doi: 10.1111/j.1467-8624.2008.01195.x. [DOI] [PMC free article] [PubMed] [Google Scholar]
- 12.Bradley SJ, Jadaa D, Brody J, Landy S, Tallett SE, Watson W, et al. Brief psychoeducational parenting program: An evaluation and 1-year follow-up. J Am Acad Child Adolesc Psychiatry. 2003;42:1171–8. doi: 10.1097/00004583-200310000-00007. [DOI] [PubMed] [Google Scholar]
- 13.Webster-Stratton C. Preventing conduct problems in head start children: Strengthening parenting competencies. J Consult Clin Psychol. 1998;66:715–30. doi: 10.1037//0022-006x.66.5.715. [DOI] [PubMed] [Google Scholar]
- 14.Chung C, Liu W, Chang C, Chen C, Tang SF, Wong AM. The relationship between parental concerns and final diagnosis in children with developmental delay. J Child Neurol. 2011;26:413–9. doi: 10.1177/0883073810381922. [DOI] [PubMed] [Google Scholar]
- 15.Wake M, Gerner B, Gallagher S. Does parents’ evaluation of developmental status at school entry predict language, achievement, and quality of life 2 years later? Ambul Pediatr. 2005;5:143–9. doi: 10.1367/A04-162R.1. [DOI] [PubMed] [Google Scholar]
- 16.Dixon G, Badawi N, French D, Kurinczuk JJ. Can parents accurately screen children at risk of developmental delay? J Paediatr Child Health. 2009;45:268–73. doi: 10.1111/j.1440-1754.2009.01492.x. [DOI] [PubMed] [Google Scholar]
- 17.Lichtenberger EO. General measures of cognition for the preschool child. Ment Retard Dev Disabil Res Rev. 2005;11:197–208. doi: 10.1002/mrdd.20076. [DOI] [PubMed] [Google Scholar]
- 18.The B4 School Check: a handbook for practitioners. Wellington: Ministry of Health; 2008. Ministry of Health. [Google Scholar]
- 19.McKinlay CJD, Alsweiler JM, Ansell JM, Anstice NS, Chase JG, Gamble GD, et al. Neonatal Glycemia and Neurodevelopmental Outcomes at 2 Years. N Engl J Med. 2015 Oct 15;373:1507–18. doi: 10.1056/NEJMoa1504909. [DOI] [PMC free article] [PubMed] [Google Scholar]
- 20.Harris DL, Battin MR, Weston PJ, Harding JE. Continuous glucose monitoring in newborn babies at risk of hypoglycemia. J Pediatr. 2010;157:198–202.e1. doi: 10.1016/j.jpeds.2010.02.003. [DOI] [PubMed] [Google Scholar]
- 21.Harris DL, Weston PJ, Signal M, Chase JG, Harding JE. Dextrose gel for neonatal hypoglycaemia (the Sugar Babies Study): a randomised, double-blind, placebo-controlled trial. Lancet. 2013;382:2077–83. doi: 10.1016/S0140-6736(13)61645-1. [DOI] [PubMed] [Google Scholar]
- 22.Salmond C, Crampton P, King P, Waldegrave C. NZiDep: A New Zealand index of socioeconomic deprivation for individuals. Soc Sci Med. 2006;62:1474–85. doi: 10.1016/j.socscimed.2005.08.008. [DOI] [PubMed] [Google Scholar]
- 23.Glascoe FP. Parents’ Evaluation of Developmental Status: How well do parents’ concerns identify children with behavioral and emotional problems? Clin Pediatr. 2003;42:133–8. doi: 10.1177/000992280304200206. [DOI] [PubMed] [Google Scholar]
- 24.Glascoe FP, Marks KP, Poon JK, Macias MM, editors. Identifying and Addressing Developmental-Behavioral Problems: A Practical Guide for Medical and Non-medical Professionals, Trainees, Researchers and Advocates. Nolensville, Tennessee: PEDStest.com, LLC; 2013. www.pedstest.com. [Google Scholar]
- 25.Goodman R. Psychometric properties of the strengths and difficulties questionnaire. J Am Acad Child Adolesc Psychiatry. 2001;40:1337–45. doi: 10.1097/00004583-200111000-00015. [DOI] [PubMed] [Google Scholar]
- 26.Goodman R, Ford T, Simmons H, Gatward R, Meltzer H. Using the Strengths and Difficulties Questionnaire (SDQ) to screen for child psychiatric disorders in a community sample. Br J Psychiatry. 2000;177:534–9. doi: 10.1192/bjp.177.6.534. [DOI] [PubMed] [Google Scholar]
- 27.Ezpeleta L, Granero R, La Osa ND, Penelo E, Domènech JM. Psychometric properties of the Strengths and Difficulties Questionnaire3-4 in 3-year-old preschoolers. Compr Psychiatry. 2013;54:282–91. doi: 10.1016/j.comppsych.2012.07.009. [DOI] [PubMed] [Google Scholar]
- 28.Landis JR, Koch GG. The measurement of observer agreement for categorical data. Biometrics. 1977;33:159–74. [PubMed] [Google Scholar]
- 29.Talmi A, Bunik M, Asherin R, Rannie M, Watlington T, Beaty B, et al. Improving developmental screening documentation and referral completion. Pediatrics. 2014;134:e1181–8. doi: 10.1542/peds.2012-1151. [DOI] [PubMed] [Google Scholar]
- 30.Guevara JP, Gerdes M, Localio R, Huang YV, Pinto-Martin J, Minkovitz CS, et al. Effectiveness of developmental screening in an urban setting. Pediatrics. 2013;131:30–7. doi: 10.1542/peds.2012-0765. [DOI] [PubMed] [Google Scholar]
- 31.Ek U, Holmberg K, De Geer L, Swärd C, Fernell E. Behavioural and learning problems in schoolchildren related to cognitive test data. Acta Paediatr Int J Paediatr. 2004;93:976–81. [PubMed] [Google Scholar]
- 32.Cox JE, Huntington N, Saada A, Epee-Bounya A, Schonwald AD. Developmental screening and parents’ written comments: An added dimension to the parents’ evaluation of developmental status questionnaire. Pediatrics. 2010;126:S170–6. doi: 10.1542/peds.2010-1466M. [DOI] [PubMed] [Google Scholar]
- 33.Litmus. The Well Child / Tamariki Ora Programme Quality Reviews. Wellington: Ministry of Health; 2014; 2013. (online) [Google Scholar]
- 34.Mackrides PS, Ryherd SJ. Screening for developmental delay. Am Fam Phys. 2011;84:546–9. [PubMed] [Google Scholar]
- 35.King TM, Tandon SD, Macias MM, Healy JA, Duncan PM, Swigonski NL, et al. Implementing developmental screening and referrals: Lessons learned from a national project. Pediatrics. 2010;125:350–60. doi: 10.1542/peds.2009-0388. [DOI] [PubMed] [Google Scholar]
- 36. [3/15/2015];The Strengths and Difficulties Questionnaire norms. Available at: http://www.sdqinfo.org/g0.html.
- 37.Angold A, Costello EJ. A test-retest reliability study of child-reported psychiatric symptoms and diagnoses using the Child and Adolescent Psychiatric Assessment (CAPA-C) Psychol Med. 1995 Jul;25:755–62. doi: 10.1017/s0033291700034991. [DOI] [PubMed] [Google Scholar]
- 38.Mathai J, Anderson P, Bourne A. Use of the strengths and difficulties questionnaire as an outcome measure in a child and adolescent mental health service. Australas Psychiatry. 2003;11:334–7. [Google Scholar]
- 39.Gibbs A, Moor S, Frampton C, Watkins W. Impact of psychosocial interventions on children with disruptive and emotional disorders treated in a health camp. Aust New Zealand J Psychiatry. 2008;42:789–99. doi: 10.1080/00048670802277248. [DOI] [PubMed] [Google Scholar]
- 40.Ford T, Hutchings J, Bywater T, Goodman A, Goodman R. Strengths and Difficulties Questionnaire Added Value Scores: Evaluating effectiveness in child mental health interventions. Br J Psychiatry. 2009;194:552–8. doi: 10.1192/bjp.bp.108.052373. [DOI] [PubMed] [Google Scholar]
- 41.Lever M, Moore J. Home visiting and child health surveillance attendance. Community Pract. 2005;78:246–50. [PubMed] [Google Scholar]
- 42.Søndergaard G, Biering-Sørensen S, Michelsen SI, Schnor O, Andersen A-N. Non-participation in preventive child health examinations at the general practitioner in Denmark: A register-based study. Scand J Prim Health Care. 2008;26:5–11. doi: 10.1080/02813430801940877. [DOI] [PMC free article] [PubMed] [Google Scholar]