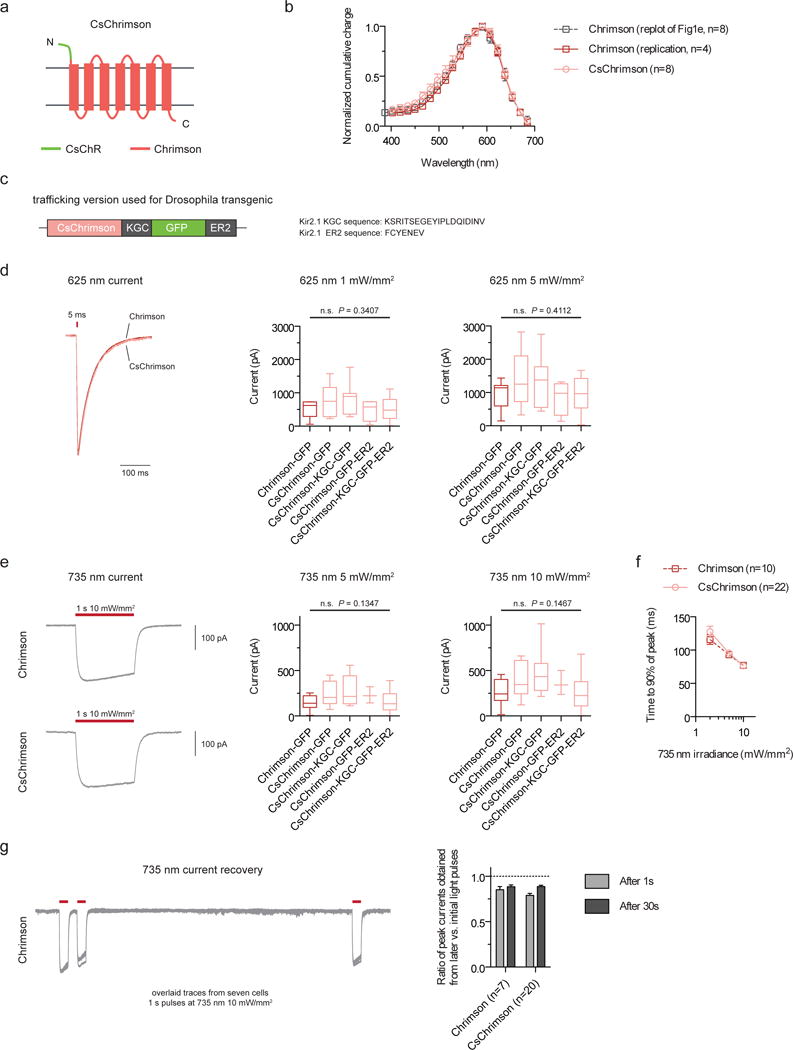
A trafficking variant of the Chrimson molecule (Addendum Fig. 1c) was used for the Drosophila experiments in the original version of the paper (i.e., Fig. 3, Supplementary Figs. 14–16, and the Supplementary Videos). This trafficking variant, called CsChrimson-KGC-GFP-ER2, is a CsChR-Chrimson chimera, replacing the Chrimson N-terminus with the CsChR N-terminus (Addendum Fig. 1a, Addendum Supplementary Fig. 1), with appended KGC and ER2 trafficking sequences (Addendum Fig. 1c).
In the original paper, we found CsChR to have high membrane expression levels (Supplementary Figs. 5–6). We therefore attempted to boost Chrimson expression by swapping the Chrimson N-terminus with that of the CsChR N-terminus. As no transmembrane regions were modified, we unsurprisingly found that CsChrimson has the same spectral and kinetic properties as Chrimson in murine cultured neurons (Addendum Figs. 1b, d, f, g). We additionally compared CsChrimson with and without KGC and/or ER2 trafficking sequences and found all variants to have similar photocurrents in cultured neurons (Addendum Figs. 1d, e). However, we observed more cytosolic aggregates with the KGC version and a reduction of aggregates with the ER2 version (Addendum Supplementary Fig. 2). It is therefore likely that CsChrimson will be of use with the ER2 trafficking sequence in some biological contexts.
Methods
Whole-cell patch clamp recordings were made using a Multiclamp 700B amplifier and a Digidata 1550 digitizer (Molecular Devices, Sunnyvale, CA). All other experimental conditions are the same as previously described.
Supplementary Material
Transmembrane regions are based on an alignment against C1C2 crystal structure. Putative transmembrane helices are flagged. Orange and blue sequences highlight the differences between Chrimson and CsChrimson.
Representative GFP epi-fluorescence images for Chrimson and CsChrimson trafficking variants taken on 20x objective and imaged under identical conditions. All images have identical brightness and contrast settings. Scale bar, 10 μm.
Figure 1. CsChrimson characterization in cultured cells.

(a) Schematic of CsChrimson chimera. (b) Action spectra for Chrimson and CsChrimson, as well as the Chrimson spectrum data from the original manuscript (HEK293 cells; measured using equal photon fluxes of ~2.5 × 10²¹ photons/s/m2). (c) Schematic of trafficking sequences used to generate the CsChrimson Drosophila transgenics. (d–e) Maximum photocurrents in response to red (625-nm) and far-red (735-nm) light as measured in cultured neurons. (f–g) Turn-on (f) and recovery kinetics (g) in response to 735-nm light. CsChrimson kinetic data were pooled from all trafficking versions. All constructs in this panel were expressed under CaMKII promoter and selected based solely on the presence of co-transfected cytosolic tdTomato expression. Illumination conditions are as labeled in each panel. Box plot whiskers represent minimum and maximum data points. Box limits represent 25th percentile, median, and 75th percentile. n values: Chrimson-GFP (n = 9 cells in d, n = 12 cells in e), CsChrimson-GFP (n = 7 cells in d, n = 8 cells in e), CsChrimson-KGC-GFP (n = 7 cells in d, e), CsChrimson-GFP-ER2 (n = 4 cells in d, n = 3 cells in e), and CsChrimson-KGC-GFP-ER2 (n = 10 cells in d, n = 11 cells in e). Plotted data are mean ± s.e.m. in b, f, and g. ANOVA with Dunnett’s post hoc test with Chrimson-GFP as reference in d, e.
Footnotes
Accession codes. GenBank/EMBL/DDBJ: CsChrimson is listed under accession code KJ995863.
Associated Data
This section collects any data citations, data availability statements, or supplementary materials included in this article.
Supplementary Materials
Transmembrane regions are based on an alignment against C1C2 crystal structure. Putative transmembrane helices are flagged. Orange and blue sequences highlight the differences between Chrimson and CsChrimson.
Representative GFP epi-fluorescence images for Chrimson and CsChrimson trafficking variants taken on 20x objective and imaged under identical conditions. All images have identical brightness and contrast settings. Scale bar, 10 μm.


