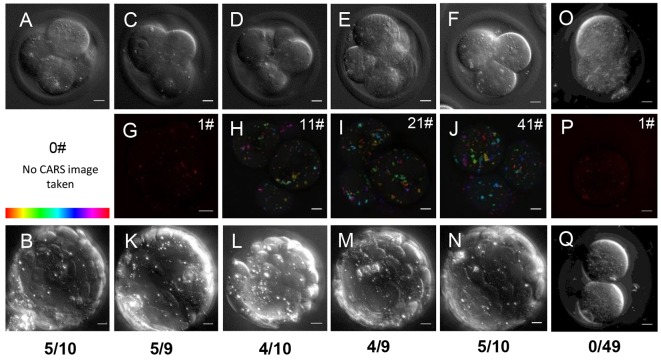
Fig. 4.
Embryo viability after live imaging with CARS. (A) Single z-plane and (B) maximum intensity projection DIC images taken with a 1.27 NA water objective and a 1.4 NA oil condenser of an embryo at four-cell stage and blastocyst stage, without CARS imaging (n=10). (C-F) Single z-plane DIC and (G-J) depth colour-coded CARS stacks of four-cell embryos before their development to blastocyst stage after different CARS imaging at 2850 cm−1. Number of CARS images taken is indicated in the top right corner; (G) 1 CARS xy image (n=9), (H) 11 CARS xy images with 5 µm z-steps (n=10), (I) 21 CARS xy images with 0.5 µm z-steps (n=9), (J) 41 CARS xy images taken with 0.5 µm z-steps (n=10). (K-N) Maximum intensity projection DIC images of blastocyst stages of the same embryos seen at the four-cell stage in panels C-J; blastocyst developmental rate is indicated beneath panels. (O,P) DIC and CARS (1 xy) images of a two-cell embryo, and (Q) DIC image of the same embryo 5 days later, demonstrating arrest (n=49). 0.1×0.1 µm pixel size; 0.01 ms pixel dwell time; ∼14 mW (∼9 mW) pump (Stokes) power at the sample. Scale bars: 10 µm. Colour bar shows depth colour-coding from –25 µm-25 µm (0 µm being the equatorial plane). Data from >5 trials, using 1-3 mice each.

