

Abstract
Increased population density is among the proposed drivers of the behavioural changes culminating in the Middle to Later Stone Age (MSA–LSA) transition and human dispersals from East Africa, but reliable archaeological measures of demographic change are lacking. We use Late Pleistocene–Holocene lithic and faunal data from Nasera rockshelter (Tanzania) to show progressive declines in residential mobility—a variable linked to population density—and technological shifts, the latter associated with environmental changes. These data suggest that the MSA–LSA transition is part of a long-term pattern of changes in residential mobility and technology that reflect human responses to increased population density, with dispersals potentially marking a complementary response to larger populations.
This article is part of the themed issue ‘Major transitions in human evolution’.
Keywords: modern human origins, East Africa, residential mobility, paleodemography
1. Introduction
The shift from Middle Stone Age (MSA) to Later Stone Age (LSA) technologies is the most pronounced feature of the Late Pleistocene (126 000–12 000 years ago; 126–12 ka) archaeological record of East Africa. Prominent changes in artefact assemblages across the MSA–LSA transition are seen in aspects of stone tool production, the proliferation of items of personal adornment such as ostrich eggshell beads, and intensification of the long-distance movement of obsidian through trade or other mechanisms. Together, these shifts imply key changes in hominin technological and social systems that anticipate the behavioural systems of extant and historic hunter–gatherers [1–7]. Most of the East African Late Pleistocene archaeological record was made by morphologically diverse populations of Homo sapiens [8], but some fossil and genetic evidence hint at the possibility of the late persistence of archaic taxa [9,10].
The timing and tempo of the MSA–LSA transition in East Africa appears to have varied across the region within the broad interval of approximately 30–60 ka, based on currently available radiometric dates, although significant interpretive problems remain at the key sites in Kenya and northern Tanzania (figure 1). Three different excavations at Mumba rockshelter (Tanzania) have led to very different interpretations that range from the rapid and early appearance of LSA technologies by 55 ka [11–13] to a more gradual appearance approximately 35–40 ka [14,15]. Recent results from Kisese II rockshelter (Tanzania) suggest that the shift may have begun approximately 40 ka with the most pronounced changes occurring approximately 35 ka; however, the original excavations were largely unpublished and much of the material and original field notes have since been lost [16,17]. At Enkapune ya Muto (Kenya), available evidence suggests that the MSA–LSA transition may be more than 40–50 ka with a complex pattern of change, but the site chronology is limited by infinite radiocarbon dates and only summary descriptions of the archaeological data are available [1,18]. At GvJm-22 at Lukenya Hill (Kenya), new radiocarbon dates suggest that the transition occurred approximately 26–50 ka, but dated material were sampled from older excavations that mixed key strata, and thus the tempo of change cannot be determined [8,19]. A number of MSA sites from the Lake Victoria basin are as young as approximately 35–50 ka, but overlying LSA deposits are absent [20–22].
Figure 1.
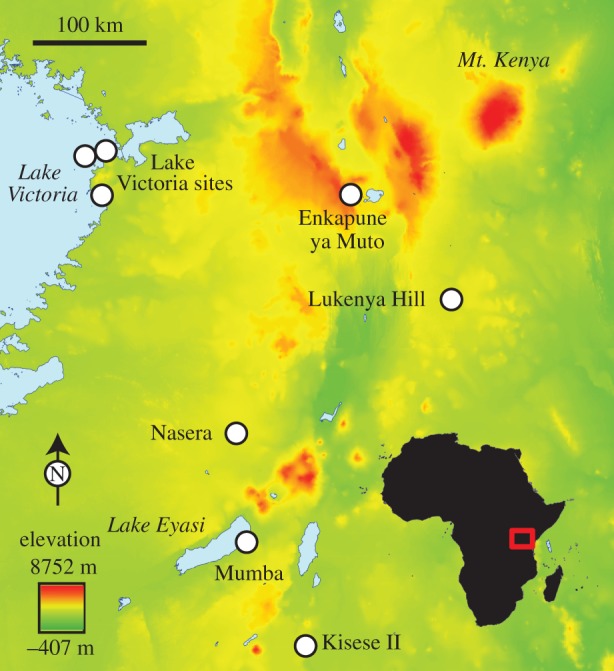
Schematic map of East Africa and archaeological sites discussed in the text.
At least three hypotheses have been proposed to explain the MSA–LSA transition. Klein [23] considers it the outcome of a genetic mutation within H. sapiens that led to rapid cognitive developments and the subsequent fluorescence of language and art. While archaeological data cannot contribute directly to debates about changes in the human genome, this hypothesis does predict that the MSA–LSA transition should be rapid, which can be tested with well-dated stratigraphic sequences. Ambrose [1,24] has linked the MSA–LSA transition to technological and social changes to accommodate resource risk during cooler, drier and increasingly variable Late Pleistocene environments. Others consider it the outcome of demographic changes within Late Pleistocene populations of H. sapiens, with a shift towards larger, denser and more inter-connected populations that would have increased the potential for the appearance, maintenance and spread of novel behaviours [25–28]. Direct evidence for changes in Late Pleistocene human populations from data such as patterns in radiocarbon dates, artefact types, shellfish and tortoise size, and diet breadth is lacking outside of southern Africa [28–31].
Processes leading to increases in population size or changes in population structure approximately 60 ka are consistent with genetic and fossil evidence for human dispersals across and out of Africa, with East Africa an important point of departure for these expansions [32–34]. Regional or continental-scale comparisons of Late Pleistocene environmental proxies with estimates of population size from archaeological data in East Africa are suggestive of a possible population increase, but are poorly resolved because of the paucity of sites and imprecise chronology [35]. Here we take a site-focused approach and use lithic and faunal data from Nasera rockshelter (Tanzania; figure 1) to show that changes throughout the Late Pleistocene are consistent with decreased residential mobility and increased population density concurrent with environmental shifts towards drier and more open conditions, providing the first empirical support for the role of demographic and environmental shifts in mediating technological changes across the MSA–LSA transition in East Africa.
2. Demography, mobility and technological organization
Inferences of Palaeolithic demography from archaeological proxies usually rely on changes in (i) the number of sites in a region for a given time interval, (ii) artefact accumulation rates, (iii) site size or (iv) diet, particularly increased dietary breadth, the inclusion of lower ranked resources, intensified predation pressure and prey extirpation [36]. For East Africa, Blome et al. [35] report increases in site frequency beginning approximately 90 ka, but temporally and spatially limited excavations and the rarity of preserved or reported fauna currently severely limit use of analyses of site size or changes in dietary breadth [3,35]. In this paper, we examine artefact accumulation rates but focus on inferred changes in residential mobility patterns, as groups with low residential mobility tend to live at higher population densities than those with high residential mobility [37]. Organizational approaches have shown that residential mobility structures technology, and thus by examining lithic technology in the archaeological record, we have a means to infer past residential mobility [38,39]. Although direct ethnographic analogues for foragers in African tropical grasslands are lacking [40], we make use of generalized patterns based on theoretical predications and observations spanning a geographically broad spectrum of recent and historical foragers, which should be applicable to a range of environmental contexts. We use fossil fauna as a proxy for changing local palaeoenvironments to assess whether variation in both residential mobility and/or technology are related to environmental differences. We use α = 0.05 for all statistical analyses.
(a). Measuring residential mobility from lithic data
Residential mobility is the movement of individuals or groups from one residential base camp to another. The frequency of residential moves is mediated by subsistence or environmental variables (e.g. the density and predictability of key resources), and the proximity and number of other human groups, as a more densely packed landscape reduces mobility options [41]. While an individual forager or group may shift residential mobility seasonally or over longer time periods [41], data from recent and historic foragers [36,37,41–46] suggest that residential mobility is inversely correlated with net primary productivity and the abundance and predictability of key resources. When resources are abundant and predictable, there is little need for a group to incur the energetic costs of high residential mobility, but when sparse, the costs of mobility are outweighed by the increase in returns gained from exploiting the broader landscape. Areas with higher net primary productivity generally support higher population densities [42,47], and where data are available, groups with low residentially mobility (often focused on gathering and fishing) live at greater population densities (more than 32 people per 100 km2) than those with high residential mobility (less than 32 people per 100 km2), many of whom rely on hunting [37]. As the total number of residential moves for a given group declines, the intensity and duration of each occupation necessarily increases. We measure occupation intensity and duration using several proxies from lithic data from Nasera, and use these to infer changes in residential mobility. Our data provide some of the only estimates of changes in residential mobility using lithic data from East African Pleistocene sites (but see Barut [48]).
(i). Occupation intensity
As a gross measure of occupation intensity, we estimate the accumulation rate of artefacts per thousand years (kyr), defined as the density of artefacts (artefacts m−3) for a given sedimentary unit, divided by an estimate of its time of accumulation. As occupation intensity increases, so too should the artefact accumulation rate. Because of the many assumptions required for these analyses (cf. [36,49]), such as constant sedimentary deposition, and the coarse chronological resolution at Nasera, these data are useful only for general comparisons among strata and require confirmation from additional proxies. At Nasera, we group stratigraphic units by artefact industry to examine changing occupation intensity.
(ii). Occupation duration
We use two proxies to estimate occupation duration. The first is the ratio of the number of retouched tools to artefact volumetric density for each assemblage. As shown through extensive modelling and application to sites in Eurasia and North America, as the time spent at a residential site increases, the relative abundance of retouched tools, some of which are presumably transported from the previous residential sites [50], declines as their numbers become swamped by the large amounts of debris produced during on-site flaking episodes [51–53]. This results in a strong, significant negative relationship between retouched tool count and artefact volumetric density. Converting this relationship into a ratio allows us to examine changes in this variable through time at Nasera, with decreasing values indicating increased occupation duration.
The second proxy relates to raw material type. Like the number of retouched tools, the number of artefacts made of non-local stone raw materials will decrease with occupation duration. As the number of residential moves from areas where non-local material occur declines, so too will the relative abundance of exotic materials brought to and discarded at the site [51]. Our proxy is Surovell's [51] occupation span index (OSI), developed through behavioural ecological modelling and used to study archaeological datasets produced by North American and Australian foragers. The OSI is a normalized average of two ratios calculated for each assemblage. The first is the ratio of local to non-local stone raw materials, with approximately 20 km used as the divide between local and non-local sources, based on maximum daily foraging range. The second is the ratio of total debitage (flaking debris) to retouched tools made of non-local raw materials. This ratio is similar to the retouched tool : artefact volumetric density ratio in that it takes into account the observation that among mobile groups, transported artefacts are often retouched tools [50]. An increase in OSI over time suggests greater occupation duration, and among Surovell's [51] datasets, OSI was significantly and positively correlated with measures of occupation intensity (e.g. artefact density).
(iii). Artefact size
Variation among individual types of artefacts can be used as a relative measure of the degree of residential mobility. The frequency of residential moves structures how groups stay supplied with tools and raw materials in anticipation of future needs, and thus more residentially mobile groups tend to exhibit greater economization of raw materials to overcome periods where raw material availability is unpredictable [50]. As a result, there is often greater reduction intensity (the amount of use prior to discard) among stone tools (particularly scrapers) and cores with an increased distance from their source, demonstrated for Late Pleistocene–Holocene foragers in Eurasia, North America, Australia, Africa and elsewhere [50,54–57]. We test this hypothesis for cores and retouched tools (points, backed microliths and endscrapers) from Nasera, examining temporal trends in artefact size and the ratio of local : non-local raw materials for both cores and tools. Where suitable raw material is available locally, decreased residential mobility, particularly at residential sites, should create less incentive to economize raw material.
3. The archaeological and environmental history of Nasera rockshelter, Tanzania
(a). Setting, excavation history and stratigraphy
Nasera rockshelter (35°21′29″ E, 2°44′13″ S) lies on the north face of a quartzo-feldspathic gneiss inselberg on the eastern margin of the Serengeti. The southern and eastern sides of the inselberg offer sweeping views across the approximately 4-km-wide Angata Kiti Valley that connects the Serengeti to the Salei Plains, the Lake Natron Basin, and the still-active volcanic Crater Highlands on the Rift Valley margin to the east [14]. The area receives approximately 500 mm of rainfall per year, with water available primarily in the wet season in ephemeral pools and springs. The vicinity of the rockshelter is covered by short-grass edaphic grasslands that are the outcome of low precipitation and shallow, poorly drained, calcareous sediments formed on recent volcanic ashes [14,58]. Sparse resident fauna include baboons (Papio sp.), klipspringer (Oreotragus oreotragus) and hyrax (Procavia capensis), but during the wet season (December–April), large migratory herds of wildebeest (Connochaetes taurinus), Thompson's gazelle (Eudorcas thomsonii), plains zebra (Equus quagga) and attendant carnivores move through the area. Game and water are highly seasonal at Nasera, and plants such as tubers that may be particularly important to buffer against seasonal variation are locally uncommon due to poor soil drainage [40,59], and thus occupation was also likely seasonal throughout much of the site's history.
L. S. B. Leakey originally excavated the site in 1932 (as ‘Apis Rock’), but we rely here on data from the more recent and better-documented 75 m2 excavations at a depth of up to 9 m by M. J. Mehlman [14,60]. Mehlman divided the archaeological sequence into a series of industries, from bottom to top: the Kisele industry (MSA; approx. 73–56 ka), the Mumba industry (MSA/LSA transitional; approx. 56–50 ka), the Nasera industry (MSA/LSA transitional; approx. 37–25 ka), the Lemuta industry (early LSA; approx. 24–16 ka), the Silale industry (LSA; approx. 8 ka), the Olmoti industry (Kansyore/ceramic LSA; approx. 5 ka), a series of Pastoral Neolithic (PN; approx. 2 ka) industries associated with Akira and Narosura ceramics, and more recent Iron Age deposits (table 1). Age estimates summarized above are from 14C (organic and inorganic fractions), uranium-series and amino acid racemization of bones and teeth [14], as well as comparisons with OSL dates on the similar sequence of artefact industries found at nearby Mumba rockshelter [13], also excavated and partially analysed by Mehlman. All Nasera data in this paper are derived from those reported by Mehlman [14].
Table 1.
Stratigraphic and archaeological summary of Nasera rockshelter. Bold values denote arbitrarily defined instances of major changes within each variable. n.a., not applicable; n.d., no data.
| level | 18–25 | 12–17 | 8/9–11 | 6/7 | 4/5 | 3b | 3B | 3A |
|---|---|---|---|---|---|---|---|---|
| industry | Kisele | Kisesle | Mumba | Nasera | Lemuta | Silale | Olmoti | Angata Kiti |
| technocomplex | MSA | MSA | MSA/LSA | MSA/LSA | early LSA | ceramic LSA + PN | ceramic LSA (Kansyore/Nderit) | PN (Narosura/Akira) |
| age estimate (ka) | 56–73 | 56–73 | 50–56 | 25–37 | 16–24 | 8 | 5 | 2 |
| accumulation span (kyr) | 17 | 17 | 6 | 12 | 8 | 1 | 1 | 1 |
| artefact volumetric density (artefacts m−3) | 67.02 | 32.86 | 56.84 | 1031.89 | 2170.55 | 648.50 | 1808.24 | 484.67 |
| artefact accumulation rate (artefacts m−3 kyr−1) | 3.94 | 1.93 | 9.47 | 85.99 | 271.32 | 648.50 | 1808.24 | 484.67 |
| retouched tool count | 188 | 61 | 46 | 355 | 390 | 215 | 147 | 99 |
| retouched tools : artefact volumetric density | 2.81 | 1.86 | 0.81 | 0.34 | 0.18 | 0.33 | 0.08 | 0.20 |
| local : non-local raw materials | 5.45 | 4.5 | 6.33 | 23.72 | 8.07 | 18.95 | 12.54 | 6.28 |
| debitage : non-local tools | 76.98 | 26.33 | 27.93 | 144.09 | 155.04 | 131.46 | 105.61 | 36.03 |
| local : non-local cores | 3.7 | 3 | 29 | 23.74 | 11.56 | 27.33 | 19.3 | 3.82 |
| local : non-local tools | 3.35 | 1.03 | 2.07 | 4.55 | 4.17 | 6.68 | 4.25 | 1.54 |
| occupation span index (OSI) | 36.31 | 17.98 | 22.36 | 96.48 | 67 | 82.34 | 60.49 | 24.85 |
| avg. non-bipolar core size (mm) | 40.72 | 48.6 | 30.2 | 30.44 | 28.98 | 22.3 | n.d. | 26.68 |
| avg. bipolar core size (mm) | 26.23 | 28 | 20.6 | 24.94 | 24.08 | 20.6 | n.d. | 24.53 |
| avg. point size (mm) | 42.1 | 40.8 | 35.5 | 28.01 | n.a. | 31 | n.a. | 31 |
| tip cross-sectional area (TCSA) | 156.84 | 120.51 | 100.19 | 74.78 | n.a. | 103.16 | n.a. | 76.59 |
| avg. endscraper length (mm) | 31.03 | 34 | 29.2 | 26.3 | 24.21 | 18.6 | 31.1 | 31.1 |
| retouched tool count | 188 | 61 | 46 | 355 | 390 | 215 | 147 | 99 |
| points (%) | 13.3 | 18 | 4.3 | 14.6 | 0.3 | 0.5 | 0 | 1 |
| backed microliths (%) | 1.1 | 0 | 6.5 | 3.9 | 30.5 | 56.7 | 29.3 | 24.2 |
| Levallois core (%) | 9.7 | 14.3 | 16.7 | 11.9 | 6.3 | 0 | 0 | 0 |
| bipolar core (%) | 9.9 | 24 | 46.7 | 47.8 | 37.4 | 55.3 | 61.9 | 65.4 |
| CA axis 1 | n.d. | n.d. | 0.47 | 0.17 | −0.87 | 0.40 | n.d. | 1.75 |
| CA axis 2 | n.d. | n.d. | −2.17 | −1.29 | 0.46 | 1.85 | n.d. | 0.47 |
(b). The nature of the Middle to Later Stone Age transition at Nasera
Artefacts at Nasera are abundant (particularly in the upper strata) and well described. The site is exceptional as it is the only site in East Africa that has a long (more than 50 kyr) and carefully excavated sequence with abundant qualitative and quantitative lithic and faunal data. It provides a key but often overlooked benchmark for understanding changes across the MSA–LSA transition and throughout the Late Pleistocene–Holocene. The Nasera sequence documents the gradual shift from Levallois and bipolar reduction strategies, the incremental replacement of points by backed microliths, and the general pattern of artefact miniaturization that are among the key elements defining the MSA–LSA transition; in the case of points and microliths, miniaturization may relate to changes related to the development of projectile technology [1,3,12,61,62]. Stone raw materials include locally available quartz and quartzite, chert from sources 30 and 60 km away [14], and obsidian, which, although rare (less than 6.2%), is from sources approximately 250 km distant [4,5].
The frequency of Levallois cores is at its highest in the Kisele and Mumba industries (9–16%), lower in the Nasera and Lemuta industries (6–12%) and absent by the Holocene with the Silale industry. Levallois cores are always more rare than bipolar cores (table 1). Levallois and all other core types (except bipolar cores) show a progressive (if irregular) decrease in mean size through time (rs = −0.822, p = 0.023), approximately from 4.5 to 2.5 cm (table 1). The number of bipolar cores (relative to other cores) increases throughout the stratigraphic sequence ( p < 0.001), with a low of 9–24% in the Kisele industry and a pronounced increase with the appearance of the Mumba industry (46.5%), remaining at more than 37% in overlying industries. Mean bipolar core size (approx. 2.5 cm) shows no clear temporal trend (table 1) through the sequence (rs = −0.462, p = 0.297).
Retouched points and backed microliths form parts of composite tools used directly for hunting and gathering; both implements likely served as the tips or barbs of spears, darts or arrows, but also provided edges useful for cutting and a range of other tasks [63]. At Nasera, point frequency ranges from approximately 4–15% in the Kisele, Mumba and Nasera industries, declining to and remaining less than or equal to 1% in the Lemuta and overlying industries. Mean point size declines approximately from 4.5 to 3 cm in length (table 1), though the temporal trend is not statistically supported (rs = −0.817, p = 0.072). Estimates of tip cross-sectional area (table 1) and comparisons with ethnographic examples from North America and Australasia suggest that these may have tipped either hand-cast spears or darts used with spearthrowers [62,64].
Backed microliths are small (less than 3 cm) flakes, blades or bladelets with one edge blunted or ‘backed’ through retouch, often produced in large quantities in relatively standardized sizes or shapes. Backed microlith frequency increases (relative to other retouched tools) through the sequence ( p < 0.001); they are infrequent (0–6.5%) in the Kisele, Mumba and Nasera industries, but abundant (more than 29%) in the overlying LSA strata, beginning with the Lemuta industry that dates to the Last Glacial Maximum (LGM, table 1). The rare (n = 2) measurable backed pieces in the Kisele and Mumba industries are larger (3.6–5.5 cm) than those of the Nasera, Lemuta and Silale industries, which vary from approximately 2.0–2.4 cm.
Scrapers are used for hideworking, woodworking, and tasks related to maintaining and making other tools. They can be hafted and retouched extensively prior to discard. Unlike points or backed microliths, endscrapers are present throughout the entire stratigraphic sequence at Nasera. Endscraper length at Nasera changes considerably (table 1), progressively declining among the record of Pleistocene–Holocene aceramic hunter–gatherers (rs = −0.943, p = 0.002), consistent with the general pattern of miniaturization seen among points and backed microliths. This trend of decreasing endscraper length with time reverses among the Holocene ceramic Olmoti (Kansyore) and PN strata (table 1), an observation we return to below.
(c). Faunal assemblages and habitat change
Available descriptions of the ungulate fauna are restricted to taxonomic identifications largely based on dentitions [14], listed in table 2. Fauna are not reported from the MSA Kisele industry deposits, and some of those reported from the overlying MSA/LSA Mumba industry are mixed with strata attributed to the Nasera industry. Within these limits, equids (Equus spp.), Alcelaphini (e.g. C. taurinus) and Antilopini (E. thomsonii), are dominant throughout the sequence (77–92% of wild ungulates), suggesting grassy conditions similar to the present. The lowermost fossil-bearing deposits (Mumba/Nasera industries) are unique in the sequence for including rare reedbuck (Reduncini), bushbuck or kudu (Tragelaphus) and duiker (Cephalophini), though representatives of these taxa (e.g. Redunca fulvorufula and R. redunca, T. scriptus and T. imberbis and Sylvicapra grimmia) are known from the Serengeti ecosystem today [65]. The Pleistocene assemblages include the highest frequencies of oryx (Oryx beisa), Grevy's zebra (Equus grevyi) and Damaliscus—possibly the extinct grassland species D. hypsodon, typically associated with oryx and Grevy's zebra—all taxa suggestive of habitats that are drier than today [66,67].
Table 2.
Wild ungulates specimens (NISP) through the Nasera sequence.
| Nasera/Mumba | Nasera | Lemuta | Silale | PN | Recent | |
|---|---|---|---|---|---|---|
| Alcelaphus | 0 | 0 | 6 | 0 | 1 | 1 |
| Bovini | 0 | 0 | 3 | 0 | 0 | 0 |
| Connochaetes | 0 | 6 | 12 | 3 | 3 | 3 |
| Damaliscus | 1 | 0 | 7 | 0 | 0 | 0 |
| Equus grevyi | 2 | 3 | 11 | 0 | 2 | 0 |
| Equus quagga | 2 | 5 | 3 | 0 | 5 | 6 |
| Equus sp. | 6 | 50 | 70 | 7 | 10 | 11 |
| Eudorcas | 0 | 3 | 8 | 0 | 0 | 1 |
| Cephalophini | 0 | 1 | 0 | 0 | 0 | 0 |
| Oreotragus? | 0 | 0 | 1 | 0 | 0 | 0 |
| Oryx beisa? | 0 | 3 | 6 | 0 | 0 | 0 |
| Phacochoerus | 0 | 0 | 5 | 2 | 1 | 2 |
| Reduncini | 1 | 2 | 0 | 0 | 0 | 0 |
| Rhinocerotidae | 0 | 1 | 2 | 1 | 0 | 1 |
| Taurotragus | 0 | 2 | 4 | 0 | 2 | 2 |
| Tragelaphus | 0 | 1 | 0 | 0 | 0 | 0 |
Correspondence analysis (CA) provides a means to ordinate and visualize species abundance data and quantify temporal variation in ungulate taxonomic composition at Nasera (figure 2). Domesticates (cattle and ovicaprids) are excluded as they do not provide a reliable environmental signal and impose a chronological structure to the dataset (they are absent from lower strata) that is unrelated to environmental trends. Habitat preferences for the ungulates are drawn largely from Spencer [68] for the Bovidae, as well as other sources [69–72]. CA axis 1 (37.5% of the variation), which separates the LGM Lemuta industry (negative scores on axis 1) from all others (positive scores on axis 1), distinguishes relatively xeric grasslands from more mesic ones, exemplified by the contrast between Grevy's zebra and oryx (negative scores on axis 1), and plains zebra and wildebeest (positive scores on axis 1). Across stratigraphic units, there is a significant correlation between axis 1 scores and the abundance of wildebeest and plains zebra (r = 0.898, p = 0.015), mesic grassland species typical of the Serengeti grasslands today. CA axis 2 (29.8% of the variation) is strongly influenced by the rare presence of Reduncini, Cephalophini and Tragelaphus in the Nasera/Mumba and Nasera MSA assemblages, perhaps suggesting a minor closed-habitat component prior to the LGM, though it too is tracking aridity, as indicated by a significant inverse correlation between axis 2 scores and the abundance of arid-adapted Grevy's zebra and oryx across strata (r = −0.859, p = 0.029). Thus, aridity seems to be an important factor underlying faunal change at Nasera. The abundance of grassland indicators (Equus, Alcelaphini and Antilopini) relative to other ungulates remains stable through the sequence (χ2 = 1.723, p = 0.886), but the abundance of arid-adapted Grevy's zebra and oryx relative to other ungulate species decreases significantly ( p = 0.020), while plains zebra and wildebeest increase (
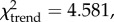 p = 0.032). The overall pattern at Nasera is one characterized by a replacement of dry grasslands in the Pleistocene, with the LGM showing the more open signal (no Tragelaphus or Cephalophini), by more mesic grasslands in the Holocene, consistent with global and regional climate signals [73]. Based on the relationship between environmental parameters and recent foragers, increasingly humid conditions, suggested by the decline of arid-adapted ungulates and increase in mesic-adapted ungulates, particularly during the Holocene, should be associated with increased population density and reduced mobility.
Figure 2.
Plot of the first two axes of a correspondence analysis of the Nasera fauna.
4. Assessing changes in residential mobility and environment at Nasera
(a). Artefact accumulation rates and occupation intensity
Recognizing that precise measures are unavailable, our estimates of artefact accumulation rates are characterized by tremendous variation spanning several orders of magnitude, from very low rates (2–9 artefacts m−3 kyr) in the Kisele and Mumba industries to 86–1808 artefacts m−3 kyr in the overlying strata (table 1). The temporal increase is highly significant (rs = −0.905, p = 0.002). These differences indicate a shift from low to higher occupation intensity beginning with strata containing the Nasera industry dating to approximately 25–37 ka.
(b). Retouched tools, artefact volumetric density and occupation duration
Log-transformed artefact volumetric density and retouched tool frequency at Nasera show a strong negative relationship (r = −0.811, p = 0.015), consistent with modelled changes in occupation duration and seen at Pleistocene sites across Eurasia [52,53]. The tool abundance : artefact volumetric density ratio decreases up the stratigraphic sequence (rs = −0.881, p = 0.007) indicating a general decrease in the relative frequency of formal (retouched) tools, and thus increased occupation duration over time.
At Nasera, the larger quantities of flake debris that appear throughout the upper parts of the sequence, interpreted here as increased occupation duration, may be accentuated by increased use of bipolar percussion which produces large amounts of small-sized shatter. Shatter abundance rather than core abundance may be the most reliable indicator of bipolar technology [12], but flake size data needed to estimate the abundance of shatter are currently unavailable from Nasera. However, the abundance of bipolar cores is strongly correlated with the tool abundance : artefact volumetric density ratio (r = −0.890, p = 0.002), providing support for this hypothesis.
(c). The occupation span index
Log-transformed values of the occupation span index (OSI) and artefact volumetric density are strongly, significantly and positively correlated (r = 0.802, p = 0.017), indicating that these independent measures are tracking substantial changes in site use (cf. [51]). The OSI among the different artefact industries at Nasera are generally low (17.98–36.31) for the Kisele and Mumba industries (approx. 50–73 ka), two to four times higher for the overlying strata (60.49–96.58) from the Nasera industry (approx. 25–37 ka) to the Olmoti ceramic LSA deposits (approx. 5 ka), with a return to lower values (24.85) among the PN deposits dating to the last 2 kyr.
(d). Reduction intensity
Although the size of Levallois and other (non-bipolar) core types decrease over time, core size at discard shows no significant relationship with the ratio of local : non-local raw materials among cores (r = −0.605, p = 0.150). Thus, changes in core size do not appear to be related to increased use of local or non-local raw materials. That average non-bipolar core size converges over time to the average size of both bipolar cores and backed microliths (approx. 2.0–2.5 cm) suggests that this trend in artefact miniaturization reflects deliberate selection for smaller sized flakes for use as tools.
There is a strong, significant inverse relationship between the ratio of tools made of local and non-local raw materials and endscraper length (r = −0.841, p = 0.009). Within the limits of our data, endscrapers are smaller when more locally available quartz is used. These data show that endscraper miniaturization is related to raw material availability, but that the relationship is opposite to that predicted by our model. It may be that endscraper size does not reflect increased reduction intensity, but rather initial selection for and use of smaller endscrapers, again reflecting a general pattern of artefact miniaturization throughout the Late Pleistocene–Holocene. However, if the trend towards smaller endscrapers does represent more intensive use prior to discard, these data may record increased investment in maintenance tools such as scrapers and their intensive use during production and repair sessions at residential camps, typical of some groups with low residential mobility [45,46]. The shift towards increased endscraper size among the PN strata at Nasera provides indirect support for this hypothesis, as these groups necessarily had high residential mobility in order to avoid overgrazing and were regularly provisioned with raw material such that endscraper length shows little relationship with raw material source distance [74].
(e). Environmental changes
For those strata providing faunal samples, we use the principal axis scores (axis 1 and axis 2) generated by the CA (figure 2) to quantify faunal composition, and by extension, past environments. Several archaeological variables in our dataset track environmental change. Bipolar core abundance is positively correlated with CA axis 1 scores (r = 0.948, p = 0.014), with bipolar cores more common in the mesic grasslands of the Holocene. Bipolar technology is considered a relatively simple approach to flake production common in areas with abundant stone raw material and among populations with low residential mobility [75]. As noted above, at Nasera, the retouched tool : artefact volumetric density ratio is positively correlated with bipolar core abundance, suggesting that bipolar cores are increasingly used as residential mobility declines. At the nearby site of Mumba, Eren et al. [12] also link the appearance of bipolar technology with the onset of more mesic environmental conditions, which they suggest promoted larger populations, a more stable resource base, and increased territoriality, in turn requiring a more efficient mode of flake production to offset the costs of territoriality (e.g. time, resource risk).
CA axis 2 scores are positively correlated with artefact accumulation rates (r = 0.953, p = 0.012) and backed microlith abundance (r = 0.940, p = 0.017), and negatively correlated with Levallois core abundance (r = −0.938, p = 0.018). Thus, the loss of non-migratory resident fauna, including those suggestive of closed habitats (Tragelaphus and Cephalophini) and reedbucks (Reduncini), is associated with the replacement of Levallois technology by backed microliths—a defining feature of the MSA–LSA transition. This shift co-occurs with greater occupation intensity, perhaps signalling either larger group sizes or longer visits to the site.
5. Discussion
Our interpretation of the Nasera record and attempts to understand its broader significance begins with the fundamental observation that our inferences of changes in residential mobility cannot be interpreted as a trend towards sedentism. Rather, they likely reflect more intensive use of this position on the landscape through longer occupations that may have been coupled with brief forays out from the shelter. Faunal evidence suggests occupation during wet season animal migrations; water sources are ephemeral, and artefacts that may signal plant harvesting or processing, including grindstones (n = 1) or bored-stone digging stick weights (n = 0) are rare or absent at Nasera. These observations suggest that, using Marean's [40] terminology, changes in site use may track a trend towards seasonal grassland hunting, where particular places on the landscape (particularly topographic areas like Nasera that overlook a narrow valley) become important focal points to target migratory prey.
Based on artefact volumetric density, artefact accumulation rates, retouched tools : artefact volumetric density, and the occupation span index, our analyses suggest that from approximately 50–73 ka (the MSA Kisele and MSA/LSA Mumba industries), forager occupation intensity and duration at Nasera rockshelter was low. Tools (including points and rare backed microliths) made of non-local (more than 20 km) chert and obsidian are relatively abundant. Levallois technology is one strategy used for flake production, and as Levallois flakes maximize utility (edge length) while minimizing weight [76], they are considered to be have been useful for residentially mobile foragers [50,77]. Bipolar technology becomes increasingly abundant over time, particularly in the more mesic Holocene grasslands. There is a major inflection in all lithic indices towards increased occupation intensity and duration, and a reduction in the use of non-local raw materials, beginning with the MSA/LSA Nasera industry (approx. 25–37 ka). There are no major technological changes relative to preceding strata, and associated fauna continue to contain migratory grassland fauna, arid-adapted ungulates, as well as resident taxa. Overlying strata show a strong if irregular pattern of increasing occupation intensity and duration, the use of more local raw materials, and the proliferation of backed microliths. With the appearance of the PN (approx. 2 ka), all indices suggest a return towards more ephemeral site use and the increased incorporation of non-local raw materials.
Combined, our analyses suggest declining residential mobility among foragers throughout the Late Pleistocene and Holocene. With the exception of our estimate of artefact accumulation rates, which increase with the loss of resident fauna, archaeological indicators of residential mobility crosscut a complex pattern of habitat change recorded in the fossil fauna and regional palaeoenvironmental archives, with more open and xeric grasslands documented from the MSA/LSA Mumba and Nasera industries to the LGM Lemuta industry, followed by a shift to more mesic habitats during the warmer Holocene. The pronounced reduction in residential mobility in the Late Pleistocene beginning with the Nasera industry and continuing into the arid LGM is at odds with data from recent and historic foragers that predicts decreased residential mobility and home range size under conditions comparable to the Holocene [41,42] rather than prior to it. This suggests causal factors other than environmental change, of which increased population density is one possibility.
If reduced residential mobility is a signal of increased population density [37] at Nasera, we would expect increased territoriality as a group's home range becomes increasingly defined through the repeated and predictable use of particular places, ultimately resulting in a more closely packed landscape of bounded territories that are defined or defended in highly variable ways [41,43]. Assuming that our inferences of reduced residential mobility and increased population density are correct, many of the technological changes at Nasera can be interpreted as a sequence of behavioural strategies to deal with changes in relative abundance and predictability of critical resources, which at Nasera was likely seasonally available migratory game.
With larger human populations targeting seasonally available migratory herds, the negative consequences of unsuccessful foraging bouts increase because of the greater number of individuals being provisioned. As Bousman and others have suggested [46,63], complex composite tools incorporating backed microliths are useful in situations where failure-to-procure costs are high. We noted above the positive and significant relationship between backed microlith abundance and CA axis 2, which tracks the loss of closed-habitat resident fauna with small home ranges. Across the sequence, these taxa are replaced by increasing frequencies of plains zebra and wildebeest, gregarious ungulates that migrate seasonally over long distances. The replacement of Levallois technology with backed microliths, which may have been used as components of new forms of projectile weapons such as the bow and arrow [78–81], may be related to a greater emphasis on targeting mobile migratory prey. Backed microliths first become prominent during the LGM Lemuta industry. Though wildebeest and plains zebra are rare at this time, Thompson's gazelle, a key member of the contemporary Serengeti migratory ecosystem, is more common than at other times in the sequence, as are fossils attributed to Damaliscus, which may belong to the potentially migratory D. hypsodon [40,66]. If indeed backed microliths are components of arrows, use of the bow may also reflect a technological shift in response to decreased ground cover and the utility of long-range projectile weapons when targeting easily alerted, fast-moving herds of prey (e.g. [82]).
Technological adaptations that increase hunting efficacy are one possible response to resource scarcity; storage is another. During the mid-to-late Holocene, backed microliths are augmented first by ceramics, used by Kansyore foragers, and subsequently by domestic stock (cattle, sheep, and goats) among diverse groups attributed to the PN. Pottery is the material manifestation, and thus intensification, of storage and boiling, practices that likely have older antecedents [83], and both of which serve to manage scarcity by either broadening the resource base (through plant detoxification), increasing nutrient returns through boiling (e.g. grease extraction) or facilitating storage to buffer against variable returns [84–86]. East African pastoralism provides ‘storage on the hoof’, [87] and a means to regulate daily uncertainty in food availability and facilitates scheduled consumption for ritual or social purposes [88].
6. Conclusion
The Middle-to-Later Stone Age transition is an archaeological shorthand that synthesizes a number of behavioural and technological changes in Africa during the Late Pleistocene that has been linked to the origin and dispersal of modern humans, ultimately driven by some combination of changes in human cognition, environmental context and demography. Testing among these competing hypotheses in East Africa has been hampered in part by poorly resolved chronologies and sparse site-specific palaeoenvironmental records. Using lithic and faunal data from Nasera rockshelter (Tanzania), we document a number of proxies that strongly suggest decreased residential mobility over time that crosscut environmental shifts, suggesting increased population density among local forager populations. Increased population density changed the calculus of resource abundance, and at Nasera the most important resource was likely always seasonally available migratory game. The sequential adoption and increased use of backed microliths, ceramics and domesticates reflect alternative strategies to reduce the costs of failure to procure food when available. From this perspective, the MSA–LSA transition is a ‘point of inflection’ along a broader trend, to borrow the terminology of Gamble & Roebroeks [89].
The data from Nasera provide the strongest empirical evidence for changes in residential mobility and technology that can be plausibly linked with increases in local population density within the context of environmental shifts from a Late Pleistocene–Holocene East African site. We note, however, that data analysed here were initially collected by Mehlman [14] for other purposes, and our analyses are meant to prompt further investigation rather than reflect a definitive statement on the issue. Assuming that our inferred chronology for Nasera is correct, the demographic changes we record occurred during and after the broad time interval when fossil and genetic evidence indicates population expansion and differentiation, suggesting that human dispersal and local technological shifts to accommodate increased population density are complementary responses to increases in population size. However, trends at Nasera require more robust confirmation, and as Klein [90] correctly notes, demonstrating demographic change is not the same as explaining why it occurred, and data from Nasera are at present insufficient to address this.
In the short term, we can propose several directions for future research. One possibility is a re-examination of the succession of fauna from GvJm-22 at Lukenya Hill, as MSA and LSA strata are now recognized from a sequence formerly considered only LSA [8]. Additional analyses of the GvJm-22 fauna may reveal shifts in human predation patterns, but taxonomic differences are few among the MSA and LSA strata at GvJm-22, which like Nasera, is probably a site used only during wet-season migrations and thus unlikely to provide a signal of increased dietary breadth. An alternative is to begin to understand how Nasera fits into the broader settlement pattern of the foragers who used it, as our conclusions are based on how a single place on the landscape was used over time; the reported presence of shared tephra deposits at Nasera and the upper Ndutu and Naisiusiu Beds at Olduvai Gorge [14] provide the possibility of exploring how the behavioural signal at Nasera rockshelter compares with open-air sites at Olduvai [91,92], a link further strengthened linked by the possible use of a shared chert raw material source.
Finally, our interpretations have been restricted primarily to subsistence technology because of the data available at Nasera; for example Mehlman recovered only a single ostrich eggshell bead, and thus we do not comment on the importance of the appearance of items of personal adornment across the MSA–LSA transition. From the perspective of subsistence-related lithic technology, the Nasera evidence clearly shows a pattern of prolonged and incremental change across an MSA–LSA transition spanning approximately 25–50 kyr. However, the timing and tempo of the origin of other types of artefacts such as ostrich eggshell beads, whose appearance may reflect major changes in cognition, personal or group identity, or expanded social networks, cannot be determined at Nasera, and these behaviours may have a different evolutionary trajectory (cf. [6,7]). It is worth noting that ostrich eggshell beads are extremely rare at MSA–LSA sites that were probably used during the wet season to capture migratory game (GvJm-22 and Nasera) [8,14], but are extremely abundant at MSA–LSA sites at ecotones that may have facilitated longer term occupation (Enkapune ya Muto, Mumba and Kisese II) [14,17,18,93]. This suggests a spatial and temporal structure to the archaeological preservation of key signals of social and perhaps cognitive change, one that can be addressed only through the pursuit and development of fine-scale, highly resolved excavation and analysis across East Africa.
Acknowledgements
We thank Rob Foley, Marta Lahr, Chris Stringer, Lawrence Martin, the Royal Society, and the British Academy for their invitation to be a part of a fantastic conference. Kathryn Ranhorn, Curtis Marean and an anonymous reviewer provided valuable comments and suggestions that substantially improved our initial draft, as did discussions with Mark Collard and Justin Pargeter. We thank Rhonda Kauffman, Violet Tryon, Cornel Faith and John and Jack Faith for their patience during its completion.
Authors' contributions
C.A.T. designed the research and collected the data; C.A.T., J.T.F. analysed and interpreted data and both authors contributed to the manuscript.
Competing interests
We have no competing interests.
Funding
Research support was provided by the American School for Prehistoric Research and Harvard University.
References
- 1.Ambrose SH. 2002. Small things remembered: origins of early microlithic industries in sub-Saharan Africa. In Thinking small: global perspectives on microlithization (eds Elston RG, Kuhn SL), Archaeological papers of the American Anthropological Association No. 12, pp. 9–29. Washington, DC: American Anthropological Association. [Google Scholar]
- 2.Ambrose SH. 2010. Coevolution of composite-tool technology, constructive memory, and language: implications for the evolution of modern human behavior. Curr. Anthropol. 51, S135–S147. ( 10.1086/650296) [DOI] [Google Scholar]
- 3.Tryon CA, Faith JT. 2013. Variability in the Middle Stone Age of Eastern Africa. Curr. Anthropol. 54, S234–S254. ( 10.1086/673752) [DOI] [Google Scholar]
- 4.Merrick HV, Brown FH. 1984. Obsidian sources and patterns of source utilization in Kenya and northern Tanzania: some initial findings. Afr. Archaeol. Rev. 2, 129–152. ( 10.1007/BF01117229) [DOI] [Google Scholar]
- 5.Merrick HV, Brown FH, Nash WP. 1994. Use and movement of obsidian in the Early and Middle Stone Ages of Kenya and northern Tanzania. In Society, culture, and technology in Africa (ed. Childs ST.), pp. 29–44. Philadelphia, PA: MASCA. [Google Scholar]
- 6.Villa P, et al. 2012. Border Cave and the beginning of the Later Stone Age in South Africa. Proc. Natl Acad. Sci. USA 109, 13 208–13 213. ( 10.1073/pnas.1202629109) [DOI] [PMC free article] [PubMed] [Google Scholar]
- 7.d'Errico F, Backwell L, Villa P, Degano I, Lucejko JJ, Bamford MK, Higham TFG, Colombini MP, Beaumont PB. 2012. Early evidence of San material culture represented by organic artifacts from Border Cave, South Africa. Proc. Natl Acad. Sci. USA 109, 13 214–13 219. ( 10.1073/pnas.1204213109) [DOI] [PMC free article] [PubMed] [Google Scholar]
- 8.Tryon CA, Crevecoeur I, Faith JT, Ekshtain R, Nivens J, Patterson D, Mbua EN, Spoor F. 2015. Late Pleistocene age and archaeological context for the hominin calvaria from GvJm-22 (Lukenya Hill, Kenya). Proc. Natl Acad. Sci. USA 112, 2682–2687. ( 10.1073/pnas.1417909112) [DOI] [PMC free article] [PubMed] [Google Scholar]
- 9.Domínguez-Rodrigo M, Mabulla A, Luque L, Thompson JW, Rink J, Bushozi P, Díez-Martin F, Alcala L. 2008. A new archaic Homo sapiens fossil from Lake Eyasi, Tanzania. J. Hum. Evol. 54, 899–903. ( 10.1016/j.jhevol.2008.02.002) [DOI] [PubMed] [Google Scholar]
- 10.Hammer MF, Woerner AE, Mendez FL, Watkins JC, Wall JD. 2011. Genetic evidence for archaic admixture in Africa. Proc. Natl Acad. Sci. USA 108, 15 123–15 128. ( 10.1073/pnas.1109300108) [DOI] [PMC free article] [PubMed] [Google Scholar]
- 11.Diez-Martin F, Domínguez-Rodrigo M, Sanchez P, Mabulla AZP, Tarriño A, Barba R, Prendergast ME, de Luque L. 2009. The Middle to Later Stone Age technological transition in East Africa. New data from Mumba rockshelter Bed V (Tanzania) and their implications for the origin of modern human behavior. J. Afr. Archaeol. 7, 147–173. ( 10.3213/1612-1651-10136) [DOI] [Google Scholar]
- 12.Eren MI, Diez-Martin F, Dominguez-Rodrigo M. 2013. An empirical test of the relative frequency of bipolar reduction in Beds VI, V, and III at Mumba Rockshelter, Tanzania: implications for the East African Middle to Late Stone Age transition. J. Archaeol. Sci. 40, 248–256. ( 10.1016/j.jas.2012.08.012) [DOI] [Google Scholar]
- 13.Gliganic LA, Jacobs Z, Roberts RG, Domínguez-Rodrigo M, Mabulla AZP. 2012. New ages for Middle and Later Stone Age deposits at Mumba rockshelter, Tanzania: optically stimulated luminescence dating of quartz and feldspar grains. J. Hum. Evol. 62, 533–547. ( 10.1016/j.jhevol.2012.02.004) [DOI] [PubMed] [Google Scholar]
- 14.Mehlman MJ. 1989. Late Quaternary archaeological sequences in Northern Tanzania. PhD thesis, University of Illinois, USA. [Google Scholar]
- 15.Marks AE, Conard NJ. 2008. Technology vs. typology: the case for and against a transition from the MSA to the LSA at Mumba Cave, Tanzania. In Space and time: which diachronies, which synchronies, which scales? Typology vs technology (eds Aubry T, Almeida F, Araújo AC, Tiffagom M), pp. 123–131. Oxford, UK: Archaeopress. [Google Scholar]
- 16.Tryon CA, Lewis JE, Laird M, Mabulla A, Kwekason A, Gidna A, Ranhorn KL, Ehrhardt CL, Marean CW. 2015. Renewed investigation of the Late Pleistocene-Holocene archaeological and paleoenvironmental sequence from Kisese II rockshelter, Tanzania. PaleoAnthropology 2015, A34. [Google Scholar]
- 17.Inskeep RR. 1962. The age of the Kondoa rock paintings in the light of recent excavations at Kisese II rock shelter. In Actes du IVe Congrès Panafrican de Préhistoire et de l'ectude du Quaternaire (eds Mortelmans G, Nenquin J), pp. 249–256. Tervuren, Belgium: Annales de Musée Royal de l'Afrique Centrale 40. [Google Scholar]
- 18.Ambrose SH. 1998. Chronology of the Later Stone Age and food production in East Africa. J. Archaeol. Sci. 25, 377–392. ( 10.1006/jasc.1997.0277) [DOI] [Google Scholar]
- 19.Gramly RM. 1976. Upper Pleistocene archaeological occurrences at site GvJm/22, Lukenya Hill, Kenya. Man 11, 319–344. ( 10.2307/2800274) [DOI] [Google Scholar]
- 20.Tryon CA, Faith JT, Peppe DJ, Fox DL, McNulty KP, Jenkins K, Dunsworth H, Harcourt-Smith W. 2010. The Pleistocene archaeology and environments of the Wasiriya Beds, Rusinga Island, Kenya. J. Hum. Evol. 59, 657–671. ( 10.1016/j.jhevol.2010.07.020) [DOI] [PubMed] [Google Scholar]
- 21.Faith JT, Tryon CA, Peppe DJ, Beverly EJ, Blegen N, Blumenthal S, Chritz KL, Driese SG, Patterson D. 2015. Paleoenvironmental context of the Middle Stone Age record from Karungu, Lake Victoria Basin, Kenya, and its implications for human and faunal dispersals in East Africa. J. Hum. Evol. 83, 28–45. ( 10.1016/j.jhevol.2015.03.004) [DOI] [PubMed] [Google Scholar]
- 22.Blegen N, Tryon CA, Faith JT, Peppe DJ, Beverly EJ, Li B, Jacobs Z. 2015. Distal tephras of the eastern Lake Victoria basin, Equatorial East Africa: correlations, chronology, and a context for early modern humans. Quat. Sci. Rev. 122, 89–111. ( 10.1016/j.quascirev.2015.04.024) [DOI] [Google Scholar]
- 23.Klein RG. 2009. The human career, 3rd edn Chicago, IL: University of Chicago Press. [Google Scholar]
- 24.Ambrose SH. 1998. Late Pleistocene human population bottlenecks, volcanic winter and differentiation of modern humans. J. Hum. Evol. 34, 623–651. ( 10.1006/jhev.1998.0219) [DOI] [PubMed] [Google Scholar]
- 25.McBrearty S, Brooks A. 2000. The revolution that wasn't: a new interpretation of the origin of modern human behavior. J. Hum. Evol. 39, 453–563. ( 10.1006/jhev.2000.0435) [DOI] [PubMed] [Google Scholar]
- 26.Henshilwood CS, Marean CW. 2003. The origin of modern human behavior: critque of the models and their test implications. Curr. Anthropol. 44, 627–651. ( 10.1086/377665) [DOI] [PubMed] [Google Scholar]
- 27.Powell A, Shennan S, Thomas MG. 2009. Late Pleistocene demography and the appearance of modern human behavior. Science 324, 1298–1301. ( 10.1126/science.1170165) [DOI] [PubMed] [Google Scholar]
- 28.Mackay A, Stewart BA, Chase BM. 2014. Coalescence and fragmentation in the late Pleistocene archaeology of southernmost Africa. J. Hum. Evol. 72, 26–51. ( 10.1016/j.jhevol.2014.03.003) [DOI] [PubMed] [Google Scholar]
- 29.Faith JT. 2008. Eland, buffalo, and wild pigs: were Middle Stone Age humans ineffective hunters? J. Hum. Evol. 55, 24–36. ( 10.1016/j.jhevol.2007.11.005) [DOI] [PubMed] [Google Scholar]
- 30.Klein RG, Steele TE. 2013. Archaeological shellfish size and later human evolution in Africa. Proc. Natl Acad. Sci. USA 110, 10 910–10 915. ( 10.1073/pnas.1304750110) [DOI] [PMC free article] [PubMed] [Google Scholar]
- 31.Wadley L. 2015. Those marvellous millennia: the Middle Stone Age of Southern Africa. Azania 50, 155–226. ( 10.1080/0067270X.2015.1039236) [DOI] [Google Scholar]
- 32.Soares P, et al. 2012. The expansion of mtDNA haplogroup L3 within and out of Africa. Mol. Biol. Evol. 29, 915–927. ( 10.1093/molbev/msr245) [DOI] [PubMed] [Google Scholar]
- 33.Rito T, Richards MB, Fernandes V, Alshamali F, Cerny V, Pereira L, Soares P. 2013. The first modern human dispersals across Africa. PLoS ONE 8, e80031 ( 10.1371/journal.pone.0080031) [DOI] [PMC free article] [PubMed] [Google Scholar]
- 34.Gunz P, Bookstein FL, Mitteroecker P, Stadlmayr A, Seidler H, Weber GW. 2009. Early modern human diversity suggests subdivided population structure and a complex out-of-Africa scenario. Proc. Natl Acad. Sci. USA 106, 6094–6098. ( 10.1073/pnas.0808160106) [DOI] [PMC free article] [PubMed] [Google Scholar]
- 35.Blome MW, Cohen AS, Tryon CA, Brooks AS, Russell J. 2012. The environmental context for the origins of modern human diversity: a synthesis of regional variability in African climate 150 000–30 000 years ago. J. Hum. Evol. 62, 563–592. ( 10.1016/j.jhevol.2012.01.011) [DOI] [PubMed] [Google Scholar]
- 36.French JC. 2015. Demography and the Palaeolithic archaeological record. J. Archaeol. Method Theory 23, 150–199. ( 10.1007/s10816-014-9237-4) [DOI] [Google Scholar]
- 37.Binford L. 2001. Constructing frames of reference: an analytical method for archaeological theory building using hunter-gatherer and environmental data sets. Berkeley, CA: University of California Press. [Google Scholar]
- 38.Nelson MC. 1991. The study of technological organization. In Archaeological method and theory, vol. 3 (ed Schiffer M.), pp. 57–100. Tucson, AZ: University of Arizona Press. [Google Scholar]
- 39.McCall GS. 2015. Before modern humans: new perspectives on the African stone age. Walnut Creek, CA: Left Coast Press, Inc. [Google Scholar]
- 40.Marean CW. 1997. Hunter-gatherer foraging strategies in tropical grasslands: model-building and testing in the East African Middle and Later Stone Age. J. Anthropol. Archaeol. 16, 189–225. ( 10.1006/jaar.1997.0309) [DOI] [Google Scholar]
- 41.Kelly RL. 2013. The lifeways of hunter-gatherers. Cambridge, UK: Cambridge University Press. [Google Scholar]
- 42.Marlowe FW. 2005. Hunter-gatherers and human evolution. Evol. Anthropol. 14, 54–67. ( 10.1002/evan.20046) [DOI] [PubMed] [Google Scholar]
- 43.Dyson-Hudson R, Smith EA. 1978. Human territoriality: an ecological reassessment. Am. Anthropol. 80, 21–41. ( 10.1525/aa.1978.80.1.02a00020) [DOI] [Google Scholar]
- 44.Ambrose SH, Lorenz KG. 1990. Social and ecological models for the Middle Stone Age in southern Africa. In The emergence of modern humans: an archaeological perspective (ed. Mellars P.), pp. 3–33. Edinburgh, UK: Edinburgh University Press. [Google Scholar]
- 45.Bousman CB. 1993. Hunter-gatherer adaptations, economic risk and tool design. Lithic Technol. 18, 59–86. ( 10.1080/01977261.1993.11720897) [DOI] [Google Scholar]
- 46.Bousman CB. 2005. Coping with risk: later Stone Age technological strategies at Blydefontein Rock Shelter, South Africa. J. Anthropol. Archaeol. 24, 193–226. ( 10.1016/j.jaa.2005.05.001) [DOI] [Google Scholar]
- 47.Porter CC, Marlowe FW. 2007. How marginal are forager habitats? J. Archaeol. Sci. 34, 59–68. ( 10.1016/j.jas.2006.03.014) [DOI] [Google Scholar]
- 48.Barut S. 1994. Middle and Later Stone Age lithic technology and land use in East African savannas. Afr. Archaeol. Rev. 12, 44–70. ( 10.1007/BF01953038) [DOI] [Google Scholar]
- 49.Dogandžić T, McPherron SP. 2013. Demography and the demise of Neandertals: a comment on ‘Tenfold population increase in Western Europe at the Neandertal-to-modern human transition’. J. Hum. Evol. 64, 311–313. ( 10.1016/j.jhevol.2013.01.005) [DOI] [PubMed] [Google Scholar]
- 50.Kuhn SL. 1995. Mousterian lithic technology: an ecological perspective. Princeton, NJ: Princeton University Press. [Google Scholar]
- 51.Surovell TA. 2009. Toward a behavioral ecology of lithic technology. Tucson, AZ: University of Arizona Press. [Google Scholar]
- 52.Riel-Salvatore J, Barton CM. 2004. Late Pleistocene technology, economic behavior, and land-use dynamics in Southern Italy. Am. Antiquity 69, 257–274. ( 10.2307/4128419) [DOI] [Google Scholar]
- 53.Barton CM, Riel-Salvatore J. 2014. The formation of lithic assemblages. J. Archaeol. Sci. 46, 334–352. ( 10.1016/j.jas.2014.03.031) [DOI] [Google Scholar]
- 54.Marks AE, Shokler J, Zilhão J. 1991. Raw material usage in the Paleolithic: the effects of local availability on selection and economy. In Raw material economies among prehistoric hunter-gatherers (eds Montet-White A, Holen S), University of Kansas Publications in Anthropology 19, pp. 127–139. Lawrence, KA: University of Kansas. [Google Scholar]
- 55.Morrow JE. 1997. End scraper morphology and use-life: an approach for studying Paleoindian lithic technology and mobility. Lithic Technol. 22, 70–85. [Google Scholar]
- 56.Clarkson C. 2002. An index of invasiveness for the measurement of unifacial and bifacial retouch: a theoretical, experimental, and archaeological verification. J. Archaeol. Sci. 29, 65–75. ( 10.1006/jasc.2001.0702) [DOI] [Google Scholar]
- 57.Clarkson C. 2013. Measuring core reduction using 3D flake scar density: a test case of changing core reduction at Klasies River Mouth, South Africa. J. Archaeol. Sci. 40, 4348–4357. ( 10.1016/j.jas.2013.06.007) [DOI] [Google Scholar]
- 58.van Breugel P, et al. 2015 Potential Natural Vegetation Map of Eastern Africa: an interactive vegetation map for Ethiopia, Kenya, Malawi, Rwanda, Tanzania, Uganda and Zambia. Version 2.0. Forest and Landscape (Denmark) and World Agroforestry Centre (ICRAF). http://vegetationmap4africa.org . [Google Scholar]
- 59.Vincent AS. 1985. Plant foods in savanna environments: a preliminary report of tubers eaten by the Hadza of northern Tanzania. World Archaeol. 17, 131–148. ( 10.1080/00438243.1985.9979958) [DOI] [PubMed] [Google Scholar]
- 60.Mehlman MJ. 1977. Excavations at Nasera Rock, Tanzania. Azania 12, 111–118. ( 10.1080/00672707709511250) [DOI] [Google Scholar]
- 61.Pargeter J, Redondo M. In press Contextual approaches to studying unretouched bladelets: a Late Pleistocene case study at Sehonghong Rockshelter, Lesotho. Quat. Int. ( 10.1016/jquaint.2015.08.038) [DOI] [Google Scholar]
- 62.Shea JJ. 2006. The origins of lithic projectile point technology: evidence from Africa, the Levant, and Europe. J. Archaeol. Sci. 33, 823–846. ( 10.1016/j.jas.2005.10.015) [DOI] [Google Scholar]
- 63.Hiscock P. 2006. Blunt and to the point: changing technological strategies in Holocene Australia. In Archaeology of Oceania: Australia and the Pacific Islands (ed. Lilley I.), pp. 69–95. Malden, MA: Blackwell Publishing. [Google Scholar]
- 64.Newman K, Moore MW. 2013. Ballistically anomalous stone projectile points in Australia. J. Archaeol. Sci. 40, 2614–2620. ( 10.1016/j.jas.2013.01.023) [DOI] [Google Scholar]
- 65.Sinclair ARE, Packer C, Mduma SAR, Fryxell JM. 2008. Serengeti III: human impacts on ecosystem dynamics. Chicago, IL: University of Chicago Press. [Google Scholar]
- 66.Faith JT, Potts R, Plummer TW, Bishop LC, Marean CW, Tryon CA. 2012. New perspectives on middle Pleistocene change in the large mammal faunas of East Africa: Damaliscus hypsodon sp. nov. (Mammalia, Artiodactyla) from Lainyamok, Kenya. Palaeogeogr. Palaeoclimatol. Palaeoecol. 361–362, 84–93. ( 10.1016/j.palaeo.2012.08.005) [DOI] [Google Scholar]
- 67.Faith JT, Tryon CA, Peppe DJ, Fox DL. 2013. The fossil history of Grevy's zebra (Equus grevyi) in Equatorial East Africa. J. Biogeogr. 40, 359–369. ( 10.1111/j.1365-2699.2012.02796.x) [DOI] [Google Scholar]
- 68.Spencer LM. 1995. Morphological correlates of dietary resource partitioning in the African Bovidae. J. Mammal. 76, 448–471. ( 10.2307/1382355) [DOI] [Google Scholar]
- 69.Cerling TE, Harris JM, Passey BH. 2003. Diets of East African Bovidae based on stable isotope analysis. J. Mammal. 84, 456–470. ( 10.1644/1545-1542(2003)084%3C0456:DOEABB%3E2.0.CO;2) [DOI] [Google Scholar]
- 70.Kingdon J, Hoffman M. 2013. Mammals of Africa. Volume VI: pigs, hippopotamuses, chevrotain, giraffes, deer and bovids. New York, NY: Bloomsbury. [Google Scholar]
- 71.Kingdon J, Hoffman M. 2013. Mammals of Africa. Volume V: carnivores, pangolins, equids and rhinoceroses. New York, NY: Bloomsbury. [Google Scholar]
- 72.Estes RD. 1991. The behavior guide to African mammals including hoofed mammals, carnivores, primates. Berkeley, CA: University of California Press. [Google Scholar]
- 73.Tierney JE, Russell JM, Huang Y. 2010. A molecular perspective on Late Quaternary climate and vegetation change in the Lake Tanganyika basin, East Africa. Quat. Sci. Rev. 29, 787–800. ( 10.1016/j.quascirev.2009.11.030) [DOI] [Google Scholar]
- 74.Goldstein ST. 2014. Quantifying endscraper reduction in the context of obsidian exchange among early pastoralists in southwestern Kenya. Lithic Technol. 39, 3–19. ( 10.1179/0197726113Z.00000000029) [DOI] [Google Scholar]
- 75.Parry WA, Kelly RL. 1987. Expedient core technology and sedentism. In The organization of core technology (eds Johnson JK, Morrow CA), pp. 285–304. Boulder, CO: Westview Press. [Google Scholar]
- 76.Eren MI, Lycett SJ. 2012. Why Levallois? A morphometric comparison of experimental ‘preferential’ Levallois flakes versus debitage flakes. PLoS ONE 7, e29273 ( 10.1371/journal.pone.0029273) [DOI] [PMC free article] [PubMed] [Google Scholar]
- 77.Wallace IA, Shea JJ. 2006. Mobility patterns and core technologies in the Middle Paleolithic of the Levant. J. Archaeol. Sci. 33, 1293–1309. ( 10.1016/j.jas.2006.01.005) [DOI] [Google Scholar]
- 78.Clark JD, Phillips JL, Staley PS. 1974. Interpretations of prehistoric technology from ancient Egyptian and other sources. Part I: Ancient Egyptian bows and arrows and their relevance for African prehistory. Paléorient 2, 323–388. ( 10.3406/paleo.1974.1057) [DOI] [Google Scholar]
- 79.Clark JD. 1975–1977 Interpretations of prehistoric technology from ancient Egyptian and other sources. Part II: Prehistoric arrow forms in Africa as shown by surviving examples of the traditional arrows of the San Bushman. Paléorient 3, 127–150. ( 10.3406/paleo.1975.4193) [DOI] [Google Scholar]
- 80.Lombard M, Pargeter J. 2008. Hunting with Howiesons Poort segments: pilot experimental study and the functional interpretation of archaeological tools. J. Archaeol. Sci. 35, 2523–2531. ( 10.1016/j.jas.2008.04.004) [DOI] [Google Scholar]
- 81.Lombard M. 2011. Quartz-tipped arrows older than 60 ka: further use-trace evidence from Sibudu, KwaZulu-Natal, South Africa. J. Archaeol. Sci. 38, 1918–1930. ( 10.1016/j.jas.2011.04.001) [DOI] [Google Scholar]
- 82.Marks SA. 1977. Hunting behavior and strategies of the Valley Bisa in Zambia. Hum. Ecol. 5, 1–36. ( 10.1007/BF01880256) [DOI] [Google Scholar]
- 83.Speth JD. 2015. When did humans learn to boil? PaleoAnthropology 2015, 54–67. ( 10.4207/PA.2015.ART96) [DOI] [Google Scholar]
- 84.Morgan C. 2012. Modeling modes of hunter-gatherer food storage. Am. Antiquity 77, 714–736. ( 10.7183/0002-7316.77.4.714) [DOI] [Google Scholar]
- 85.Carmody RN, Wrangham RW. 2009. The energetic significance of cooking. J. Hum. Evol. 57, 379–391. ( 10.1016/j.jhevol.2009.02.011) [DOI] [PubMed] [Google Scholar]
- 86.Stahl AB. 1984. Hominid dietary selection before fire. Curr. Anthropol. 25, 151–168. ( 10.1086/203106) [DOI] [Google Scholar]
- 87.Clutton-Brock J. 1989. The walking larder. London, UK: Unwin Hyman. [Google Scholar]
- 88.Marshall F, Hildebrand E. 2002. Cattle before crops: the beginnings of food production in Africa. J. World Prehist. 16, 99–143. ( 10.1023/A:1019954903395) [DOI] [Google Scholar]
- 89.Gamble C, Roebroeks W. 1999. The Middle Palaeolithic: a point of inflection. In The Middle Palaeolithic occupation of Europe (eds Roebroeks W, Gamble C), pp. 3–21. Leiden, The Netherlands: University of Leiden. [Google Scholar]
- 90.Klein RG. 2003. Comment on C.S. Henshilwood and C.W. Marean, ‘The origin of modern human behavior: critque of the models and their test implications’. Curr. Anthropol. 44, 627–651. [DOI] [PubMed] [Google Scholar]
- 91.Leakey MD, Hay RL, Thurber DL, Protsch R, Berger R. 1972. Stratigraphy, archaeology, and age of the Ndutu and Naisusu Beds, Olduvai Gorge, Tanzania. World Archaeol. 3, 328–341. ( 10.1080/00438243.1972.9979514) [DOI] [Google Scholar]
- 92.Eren MI, Durant AJ, Prendergast M, Mabulla AZP. 2014. Middle Stone Age archaeology at Olduvai Gorge, Tanzania. Quat. Int. 322–323, 292–313. ( 10.1016/j.quaint.2013.12.042) [DOI] [Google Scholar]
- 93.Leakey M. 1983. Africa‘s vanishing art: the rock paintings of Tanzania New York, NY: Doubleday. [Google Scholar]