

Abstract
Recently, it has become commonplace to interpret major transitions and other patterns in the Palaeolithic archaeological record in terms of population size. Increases in cultural complexity are claimed to result from increases in population size; decreases in cultural complexity are suggested to be due to decreases in population size; and periods of no change are attributed to low numbers or frequent extirpation. In this paper, we argue that this approach is not defensible. We show that the available empirical evidence does not support the idea that cultural complexity in hunter–gatherers is governed by population size. Instead, ethnographic and archaeological data suggest that hunter–gatherer cultural complexity is most strongly influenced by environmental factors. Because all hominins were hunter–gatherers until the Holocene, this means using population size to interpret patterns in the Palaeolithic archaeological record is problematic. In future, the population size hypothesis should be viewed as one of several competing hypotheses and its predictions formally tested alongside those of its competitors.
This article is part of the themed issue ‘Major transitions in human evolution’.
Keywords: Palaeolithic archaeology, cultural change, cultural complexity, hunter–gatherer technology, population size, demography
1. Introduction
Current evidence suggests that a number of major transitions occurred in the evolution of hominin cultural behaviour during the Plio-Pleistocene [1]. Examples include the origin of flaked stone technology, the appearance of the prepared core technique and the development of symbolic culture, which is usually associated with the appearance of Homo sapiens. For much of the twentieth century, Palaeolithic archaeologists sought to account for these transitions in terms of cognitive enhancement [2]. In the last 15 years, however, researchers have increasingly relied on population size to explain these and other patterns in the Palaeolithic archaeological record. In this paper, we show that this ‘demographic turn’ is not warranted.
The idea at the heart of the demographic turn is that change in population size causes cultural change. This hypothesis derives from formal and simulation models [3–5]. In the modelling work, population size has been defined in a number of ways. For example, Shennan [3] defines it as the number of ‘cultural parents' in a population, whereas Henrich [4] defines it as the number of interacting social learners in a population. Because these variables are difficult to measure in the real world, attempts to test the hypothesized link between population size and cultural change with empirical data have tended to use census population size or density as proxies [5–7]. In the context of the demographic turn, cultural change mainly refers to change in the number and/or elaborateness of artefacts and cultural practices, but it also covers change in the number of types of material used to make artefacts and in the intricacy of chaînes opératoires. The population size hypothesis contends that increases in population size lead to increases in these parameters (e.g. more types of artefacts), whereas decreases in population size lead to the reverse. Cultural repertoires that have more items and/or more difficult-to-manufacture items are deemed to be more complex than cultural repertoires with fewer items and/or less difficult-to-manufacture items. Consequently, the population size hypothesis is often framed in terms of the impact of population size on cultural complexity, with increases in population size leading to greater cultural complexity and decreases in population size resulting in reduced cultural complexity.
The population size hypothesis has been used to explain a number of patterns that have long interested Palaeolithic archaeologists. For example, several authors have suggested that the appearance of indicators of behavioural modernity may result from an increase in population size [3,5,8–11]. Others have used population size decrease to explain instances of the loss of a technology, such as the abandonment of the bow-and-arrow in Northern Europe during the Late Glacial period [12,13]. Still others have invoked population size to explain cases of long-term material culture stability. Hopkinson et al. [14] exemplify this with their suggestion that small population size and/or limited between-group interaction explains the Acheulean's conservatism. In a similar vein, Premo & Kuhn [15] contend that the absence of directional technological change in the Middle Palaeolithic and Middle Stone Age is a function of a high rate of extirpation of small, isolated groups. Such has been the growth of interest in the population size hypothesis within Palaeolithic archaeology that the author of a recent review describes the demographic approach as having ‘changed how archaeologists think about socio-cultural change in the Palaeolithic,’ [16, p 146] and calls demography a ‘key explanation’ for such change [p 150].
Importantly, most of the foregoing studies did not actually test the population size hypothesis. Instead, they simply interpreted patterns in the Palaeolithic archaeological record in the light of the population size hypothesis. We will show that this approach—using the population size hypothesis to explain a given cultural change or period of stability as opposed to testing its predictions—is not defensible. Because all hominins were hunter–gatherers until the Holocene, the current approach to the population size hypothesis within Palaeolithic archaeology is only justifiable if the available evidence for hunter–gatherers supports the population size hypothesis. We will demonstrate that it does not. Some data are consistent with the population size hypothesis, but they relate to food-producers not hunter–gatherers. The hunter–gatherer data—the majority of which pertain to the technology of Holocene groups—do not support the hypothesis. Given this, there is no justification for using population size to interpret patterns in the Palaeolithic archaeological record.
The remainder of the paper is divided into five parts. We begin by outlining the most influential of the models that underpin the population size hypothesis. Next, we present a critique of the empirical studies presented by Henrich [4] and Powell et al. [5]. We do so because these studies have had a major impact on the willingness of Palaeolithic archaeologists' to embrace the demographic approach [16]. Subsequently, we review the results of studies in which ethnographic and archaeological data have been used to test the population size hypothesis alongside competing hypotheses. We show that, collectively, these studies do not support the idea that population size governs cultural complexity in hunter–gatherers. Instead, they suggest that hunter–gatherer cultural complexity is most strongly influenced by environmental factors. In §4, we discuss some possible reasons why the population size hypothesis is not supported by the available hunter–gatherer data. Lastly, we outline how we think Palaeolithic archaeologists should engage with the population size hypothesis in future.
2. The mechanics of the population size hypothesis
Several models have been developed to show that population size can cause cultural change. Given space constraints, we will discuss only the most influential ones—those of Shennan [3], Henrich [4] and Powell et al. [5].
Shennan's [3] goal was to improve understanding of how cultural change in general occurs. The two models he presents are based on a population genetics model that was developed by Peck et al. [17] to assess the relative benefits of sexual and asexual reproduction. In Peck et al.'s model, mutations can be either beneficial or deleterious; there is a correlation between an allele's fitness prior to mutation and its post-mutation fitness; and most mutations produce only small changes in fitness. Shennan began by altering Peck et al.'s model so that transmission was only possible from one ‘cultural parent’ to one ‘cultural offspring’. Subsequently, he modified Peck et al.'s model to allow oblique transmission, i.e. transmission between individuals belonging to different generations where the older individual is not the biological parent of the younger individual. In simulation trials of the first model, there was a 10 000-fold increase in the mean fitness value of the population as effective population size increases from 5 to 50. In simulation trials of the second model, the population's mean fitness value increased a 1000-fold as effective population size increased from 5 to 25, and then increased by around five times as effective population size increased from 25 to 75. Thus, Shennan's models suggest the mean fitness of a population increases as effective population size increases.
Henrich [4] developed his model to explain a putative loss of cultural complexity on Tasmania after it became an island around 12 000 BP. Henrich's model differs from Shennan's [3] in that it concerns the transmission of skills rather than cultural traits. Henrich's model starts with a parental generation of n individuals. Each individual in this population has a skill level that expresses how proficient he/she is at performing a skill. The offspring generation, also consisting of n individuals, learns the skill from the most-skilled parent in the parental generation, but this copying process is inaccurate, and crucially, some offspring are better at learning than others. To determine a particular learner's copy error, a random number is drawn from a normal, Gumbel or logistic probability distribution centred on the mean/mode copy error (figure 1). It is at this point that population size becomes important. Larger populations are more likely to contain a learner whose error is drawn at the extreme right of the distribution, which means that his/her skill level will be as high as—or even higher than—that of the parent he/she is imitating. Conversely, smaller populations are at risk of lacking such gifted learners, which means that even their best individual will probably perform worse than the parent he or she learns from. As a result, over multiple generations, the population's average skill level will decrease.
Figure 1.

The transmission process modelled by Henrich [4], for a population of size n = 5. A generation of offspring (O) learns from the best parent in the previous generation, P3, which has a skill level, z, of 1.0. The skill in question is complex to the extent c, which corresponds to the average error rate of learners attempting to imitate P3. To determine the individual error of each offspring, a random number is drawn from the distribution. The larger the population, the more likely that an offspring will perform as good as or better than P3 (i.e. end up in the green area). The best offspring will serve as the cultural parent for the next generation. (Adapted from Vaesen et al. [18].)
Powell et al. [5] created their model to explain the variable timing of the appearance of the ‘package’ of practices and technologies that are often argued to distinguish modern humans from other hominins (e.g. art, projectile technology) in different parts of the world. Powell et al.'s model is an extension of Henrich's. The key difference between the models is that Powell et al.'s involves a two-stage cultural transmission process. Offspring first learn from their same-sex biological parent. Then, they have the opportunity to improve their skill level by selecting another cultural parent. Offspring only update their skill level if the new cultural parent's skill level exceeds their existing one. A second difference from Henrich's model concerns the population. Henrich's model assumes individuals belong to a single, unstructured population, whereas Powell et al.'s one assumes a metapopulation consisting of subpopulations that are connected by migration. Using simulations, Powell et al. showed that their extended transmission process yields equivalent results to those obtained by Henrich. They also showed that migration has the same effect as increasing the size of a single isolated population.
Several other models have been developed to explore the impact of population size on cultural change since Powell et al.'s study appeared. Most of these involve minor adjustments to Henrich's model and yield similar results to his [19–21]. One that does not take Henrich's model as its starting point was presented by Premo & Kuhn [15]. These authors use an agent-based model to show that local group extinction can reduce cultural complexity.
3. Deconstructing the putative role of population size in the appearance of modern human behaviour and the supposed decline of cultural complexity in Tasmania
The most important empirical studies in terms of encouraging Palaeolithic archaeologists' to accept the population size hypothesis were reported by Henrich [4] and Powell et al. [5]. These studies have been repeatedly cited by Palaeolithic archaeologists as evidence that population size affects cultural change [8,16]. In this section, we will show that this is not correct. We will begin with Powell et al.'s study because its shortcomings are more straightforward to explicate.
As we mentioned earlier, Powell et al.'s goal was to explain the inter-regional variation in the timing of the appearance of the modern human behavioural ‘package’. Having developed their model and shown that it links cultural complexity to population size, they carried out a two-step analysis. First, they used molecular data to estimate when different regions of the world would have reached the same population density as Europe at the start of the Upper Palaeolithic, which is when the ‘package’ arrives in Europe. They then compared the population estimates with the timing of the appearance of the ‘package’ in the other regions of the world. The rationale here is that, if the start of the Upper Palaeolithic in Europe represents a substantial increase in cultural complexity as most archaeologists believe, and if cultural complexity is dependent on population size, then the ‘package’ should appear in other regions when they have reached the same population density as Europe at the start of the Upper Palaeolithic.
Powell et al. claimed that their empirical results support the population size hypothesis, but their results are actually mixed. They found a correspondence between the crossing of the density threshold and the appearance of the ‘package’ in sub-Saharan Africa, North Africa and the Levant, but there was a marked gap between the crossing of the density threshold and the appearance of the ‘package’ in southern, northern and central Asia. In addition, they found that the temporary absence of the ‘package’ in sub-Saharan Africa 75–40 ka was not associated with a decline in population density below the threshold. Thus, Powell et al.'s results are more ambiguous with regard to the population size hypothesis than they claimed.
Furthermore, population estimates obtained in a recent multi-locus study [22] give rise to a different set of mismatches to those obtained by Powell et al. [5] (figure 2). For example, the new population estimates suggest that the ‘package’ arrived in Europe when population size was at a historic low. They also suggest the ‘package’ first appeared in Africa at a time when populations were shrinking (90–75 ka). This implies that Powell et al.'s empirical results are not reliable.
Figure 2.
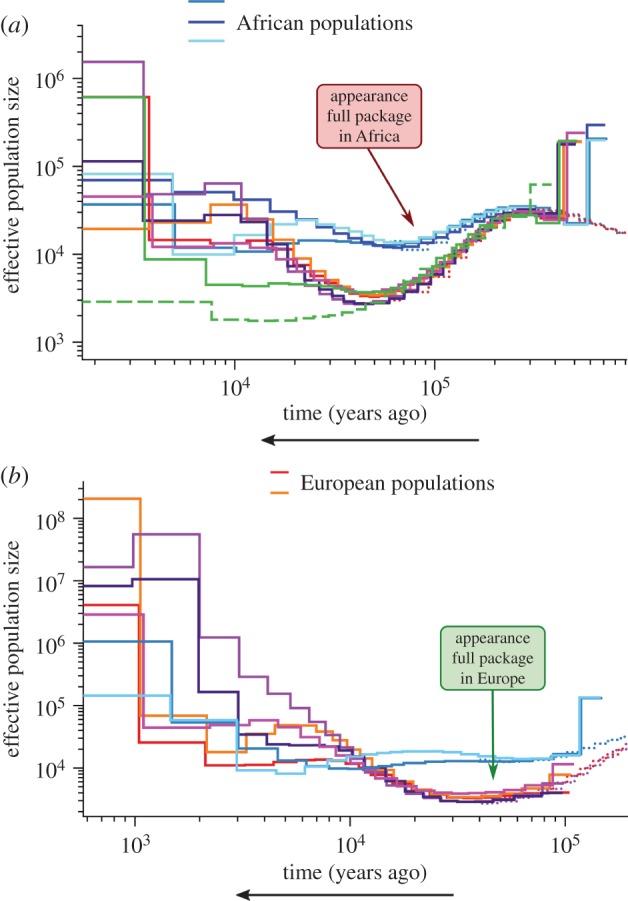
Inference of population size from whole-genome sequences (adapted from [22]). Population size estimates from (a) four haplotypes (two phased individuals) and (b) eight haplotypes (four phased individuals) from each of nine populations. Based on (a), the supposed package of modern behaviour would first appear in Africa when populations were shrinking (90–75 ka). Based on (b), the package would arrive in Europe at the start of a long period of historically low populations numbers. Copyright © 2014, Macmillan Publishers Ltd.
Significantly, it is not just a question of choosing between different sets of genetic data-derived population size estimates. Klein & Steele [23] used a widely accepted proxy for tracking changes in human population density in the distant past—the average size of shellfish species—to investigate whether changes in population size can account for the sporadic occurrence of more complex behaviours in the South African Middle Stone Age. They found that shellfish size did not change until the Later Stone Age and therefore rejected population size change as an explanation. Similarly, Vermeersch & Van Neer's [24] reconstruction of the demography of Upper Egypt during the Pleistocene indicates that the Upper Palaeolithic appeared when population density was very low. Thus, archaeological data also do not support a link between population size and the modern human behavioural ‘package’.
In short, then, Powell et al.'s model does not convincingly account for the archaeological pattern it was developed to explain. At the moment, there is no clear link between the appearance of the modern human behavioural ‘package’ and population size.
To reiterate, Henrich [4] developed his model to explain the putative loss of cultural complexity on Tasmania after it became an island around 12 000 BP. The idea that Tasmanian Aborigines experienced a decline in cultural complexity during the Holocene was first put forward by the Australian archaeologist Rhys Jones in the 1970s [25]. Excavating shell middens in the island's northwest in the 1960s, Jones noted an absence of fish bones after about 3500 BP, as well as a disappearance of bone points from about the same time onward—an observation that subsequently was repeated in other parts of Tasmania. Jones suggested that Tasmanians may have forgotten how to catch fish and lost the use of many of their tools and even the ability to make fire as a consequence of their small population size and several millennia of isolation.
Henrich [4] presented an expanded version of the cultural decline hypothesis. He averred that by the time of contact with Europeans, Tasmanians had not only lost the ability to fish, but also stopped making or failed to develop a whole range of items that would have made their lives easier. To illustrate just how diminished the Tasmanian cultural repertoire had become by the time Europeans arrived on the island, Henrich compared the Tasmanians' toolkit with the toolkits of contemporaneous mainland Aborigines. ‘In all’, he writes, ‘the entire Tasmanian toolkit consisted of only about 24 items, which contrasts starkly with [A]boriginal Australians just across the Bass Strait who possessed almost the entire Tasmanian toolkit plus hundreds of additional specialized tools' [p 198]. Recently, Henrich [26, p 221] claimed that the Tasmanian toolkit was not just simpler than those of historically documented Aboriginal groups on the mainland but simpler than those of ‘many ancient Paleolithic societies’. The tools they did make, he continued, were no more complex than those made by ‘many Neanderthals and even by more ancient members of our genus' [p 221]. Thus, according to Henrich, the Tasmanians became badly under-equipped after the inundation of the Bass Plain because they lost the ability to make certain technologies and failed to invent new technologies.
This hypothesis does not withstand scrutiny. Contrary to what Henrich suggested, the Tasmanians' technological repertoire at the time of contact with Europeans was not dramatically less complex than those of other Aboriginal populations. Henrich's [4] claim that the Tasmanians had a toolkit of just a couple of dozen items while mainland Aboriginal populations had most of the same tools plus ‘hundreds' of other tools (p 198) is not supported by the publications he cited in connection with the claim. Instead, Henrich [pers. comm.] has confirmed that the relevant figures were taken from Jones [25]. Importantly, Jones [25] did not carry out a systematic, like-for-like comparison. He simply compared the number of tools used by the Tasmanians with a ‘guesstimate’ of the combined tally for multiple tribes from southeastern Australia. Currently, systematically-collected data are available for the subsistence toolkits of five populations of Aborigines—the Arrernte (also known as the Arenda, Aranda or Arunta), Groote-Eylandt (also known as the Ingura), Pitapita, Tiwi and Tasmanians [27,28]. Numbers of tools in this sample range from 11 to 16. Thus, none of the populations came close to having hundreds of tools. Equally significantly for present purposes, the Tasmanians were not especially poorly equipped. They had fewer tools than the Groote-Eylandt (13 tools), Pitapita (15 tools) and Arrernte (16 tools), but the same as the Tiwi (11 tools). Focusing on the number of tool-parts does not change the situation. The Arrernte's toolkit included 42 tool parts, the Groote-Eylandt's 32, the Pitapita's 63, the Tiwi's 14 and the Tasmanians' 15. Thus, there is also not a big difference in toolkit complexity between the Tasmanians and other Aboriginal populations when complexity is measured in terms of tool parts. In short, the Tasmanians were at the low end of the range of variation in toolkit complexity but they were not outliers.
The fishing-related part of the cultural decline hypothesis is also problematic. To begin with, the idea of an abandonment of fishing is contested. For example, Taylor [29] challenged the claim that the Tasmanians did not eat fish at the time of contact with Europeans. She highlighted historical records that suggest at least some Tasmanians consumed fish when Europeans arrived on the island. Bassett [30] questioned the hypothesis from a different direction. He argued that the size and taxonomic composition of the fish bones examined by Jones are such that they were probably in the digestive tracts of seals caught by Tasmanians and therefore do not tell us anything about the latter's fishing abilities. Neither of these arguments is free of problems, but they clearly demonstrate that the idea that the Tasmanians lost the ability to fish cannot be taken to be a fact, contrary to what Henrich implied.
Another important problem with the fishing-related part of the cultural decline hypothesis concerns the assumption that a failure to eat fish is maladaptive. Henrich presented this as self-evident, and to be another good reason to think that something must have been preventing the Tasmanians from doing it—that something being their small population size. For example, at one point in his paper, he discussed one of the obvious potential implications of Bassett's [30] ‘seal butchery by-product’ hypothesis, namely that the Tasmanians did not ever fish. Henrich suggested that this would not undermine his argument about the importance of reduced population size, because a failure to develop fishing would be as much of a puzzle as a loss of fishing.
However, this ignores two issues. One is that there are economic reasons why the Tasmanians may have reduced their reliance on fishing. For example, Andersson & Read [31] have pointed out that the Tasmanians' non-consumption of fish could have been due to the fact that fish were not needed for protein because of the ready availability of shellfish and seals, and are not a source of carbohydrates. Under these conditions, they aver, the investment required to obtain fish may actually have been maladaptive. An alternative economic explanation for the Tasmanians' decision to fish less often has been outlined by Hiscock [32]. The implication of these arguments is that, even if it were the case that the Tasmanians did not ever eat fish, we could not infer anything about the impact of population size on cultural complexity from that fact. The other issue is that it is not uncommon for stable or expanding populations to avoid fish despite having ready access to them. For instance, stable isotope evidence indicates that the first farmers in Britain did not consume marine resources even when they lived close to the sea [33]. Given that the population of Britain seems to have expanded dramatically in the early Neolithic [34], this also clearly indicates that a failure to fish cannot be assumed to be maladaptive.
In contrast to the situation with regard to fishing, we can be confident that the Tasmanians stopped producing bone tools sometime after Tasmania was separated from the mainland. But this also does not support the cultural decline hypothesis. As Andersson & Read [31] have pointed out, the only tools that the Tasmanians are definitely known to have stopped producing in the course of the Holocene are bone points (figure 3). Bone points have been recovered at several sites that date to the Late Pleistocene or Early Holocene, including Rocky Cape, Flowery Gully and the Oatlands Lagoon Shelter [25,35–40], but bone points were not among the tools used by Tasmanians at the time of contact with Europeans. Hence, there is little doubt that sometime in the last few thousand years (probably ca 4000 BP) the Tasmanians stopped making bone points. However, the bone points would not have been difficult to make. Their production would have involved a few simple actions including fracturing long bones and rubbing the broken ends on an abrasive surface. So, while it is true that the Tasmanians stopped making bone tools, it is not the case that this represents the loss of a complex technology.
Figure 3.
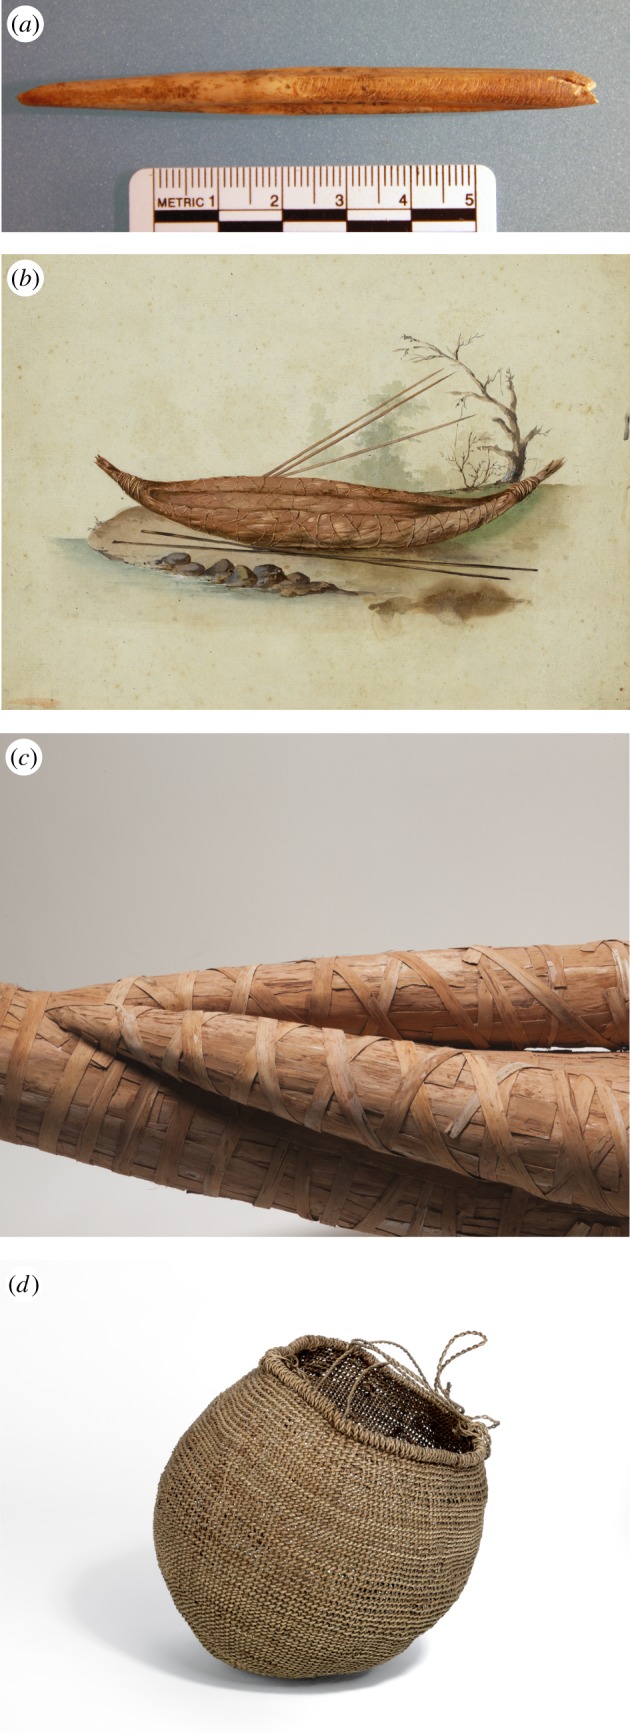
Artefacts produced by Tasmanian Aborigines. (a) Bone point from the site of Oatlands Shelter, Tasmania. Made on the fibula of a macropod. It dates to 6057 ± 59 calBP (Wk-42002). (Photograph: Richard Cosgrove.) (b) Bark canoe, drawn in 1802 by Charles-Alexandre Lesueur, a member of the Baudin expedition. (Image: courtesy of the Muséum d'Histoire Naturelle du Havre, Le Havre, France.) (c) Detail of a replica bark canoe made by Rex Greeno on the basis of early historical information. The canoe is 4.7 m long. This photograph illustrates the complexity of construction of Tasmanian bark canoes. (Photograph: George Serras, National Museum of Australia.) (d) Twined basket, collected ca 1845–1851. The basket is 19 cm high. (Photograph: Copyright © The Trustees of the British Museum.)
Henrich's argument cannot be rescued by appealing to ‘relative complexity’ (i.e. the bone tools represent the loss of a technology that is complex relative to other technologies). This is because the bone tools would have been easier to produce than some of the other tools that the Tasmanians continued to make or invented during the Holocene. These more-difficult-to-manufacture tools include some stone tools [41] as well as necklaces constructed from modified human skeletal remains and pierced shell beads [42]. More dramatically, the more-difficult-to-manufacture tools include woven baskets, bark canoes and waterproof shelters (figure 3). That the Tasmanians made objects like these at the time of contact with Europeans undercuts the argument that they stopped making bone tools because they were too complex. Following the logic of Henrich's model, if the population was large enough to preserve the knowledge required to make complex objects like canoes, it must have been big enough to preserve the knowledge required to make simpler items like bone points. The corollary of this is that the impact of reduced population size on skill cannot explain the fact that Tasmanians stopped making bone points. An obvious alternative explanation is that environmental conditions changed in such a way that the tasks bone points were used for were no longer necessary. The production of clothing has been suggested to be one such task [31,43,44].
In summary, neither Powell et al.'s analysis nor the one presented by Henrich provides strong support for the population size hypothesis. The best that can be said of Powell et al.'s results is that they provide partial, tentative support for the hypothesis. The Tasmanian case study discussed by Henrich does not even provide that level of support.
4. Other hunter–gatherer studies also do not support the population size hypothesis
Henrich and Powell et al. are not the only researchers who have brought data to bear on the question of whether or not population size drives cultural complexity. In this section, we show that the other studies do not support the use of the population size hypothesis to explain patterns in the Palaeolithic archaeological record.
The literature dealing with the impact of demographic factors on cultural evolution has increased in recent years, but there are still relatively few studies in which the population size hypothesis has been adequately tested. Other factors have been proposed to impact cultural complexity. The most prominent of these is environmental risk [45–50]. This idea is rooted in the work of Torrence [45], who argued that risk of resource failure affects the complexity of subsistence toolkits, because people create more specialized tools when risk of resource failure is high and more specialized tools tend to be more complex. Recently, it has been suggested that Torrence's argument can be extended to overall technological complexity, because humans use technology to moderate more risks than just the risk of resource failure [47]. Given that other factors have been argued to drive cultural complexity, an adequate test of the population size hypothesis is one in which the effects of population size are evaluated alongside the effects of at least one other putative driver. So far, eight studies meet this criterion [6,7,46–51].
The results of two of these studies have been argued to support the population size hypothesis. In the first, Kline & Boyd [6] examined the effect of population size on the complexity of the marine hunting toolkits of 10 recent farming groups from Oceania. They found that population size had a significant effect on both the number of tools and the average number of parts per tool. This held even when they controlled for ethnographic research intensity and risk of resource failure.
In the other study, Collard et al. [7] applied regression analysis to data from 40 farming and pastoralist groups to test the population size hypothesis. They found that both the number of tools and the number of tool parts were positively associated with population size even when proxies for risk of resource failure were included in the analysis.
In contrast, the other six studies refute the population size hypothesis. Collard et al. [46] included population size as a potential explanatory factor in a study designed to shed light on the drivers of toolkit complexity among contact-era hunter–gatherers. The other potential explanatory factors they examined were risk of resource failure, diet and mobility. Collard et al. collated data for a worldwide sample of 20 recent hunter–gatherer groups and then subjected them to regression analysis. They found that the only significant predictors of toolkit complexity were their proxies for risk of resource failure. Population size was not associated with any of the toolkit variables.
Read [49] re-assessed the relative merits of the population size, mobility and risk hypotheses using several types of multiple regression. Read employed the same data as Collard et al. [46] but used additional toolkit variables and another proxy for risk of resource failure, length of the growing season. He found that in the majority of his analyses the toolkit complexity measures were most strongly influenced by the proxies for risk of resource failure but were also affected by the mobility variables. Like the analyses carried out by Collard et al., Read's analyses indicated that population size was not associated with any of the toolkit variables.
Codding & Jones [51] evaluated the ability of the population size hypothesis and a competing hypothesis to explain a decrease in fishing intensity on the central coast of California during the middle–late transition period (MLT), which begins ca 950 BP and ends ca 700 BP. During the MLT, there was a switch from net fishing to hook-and-line fishing. Fishing with a net is more efficient (i.e. it yields more calories per unit time) than fishing with a hook and line, so this switch appears paradoxical. Why would a population adopt a less efficient fishing practice? Codding and Jones argued that there are two possible explanations. One is that MLT-period Californians lost the skills needed to net-fish as a result of a reduction in population size. The other possibility they outlined is that ecological and demographic conditions changed in such a way that the economic payoff for net-fishing, which is a cooperative endeavour, dropped below that for hook-and-line fishing, which is an individual activity. Subsequently, Codding and Jones evaluated the predictions of the hypotheses in relation to data on population density, tempo of technological change and the type of hooks that were adopted. They found that population density declined; that the change in technology was rapid; and that the hooks were novel. The first of these results is consistent with both hypotheses, but the other two allow them to be differentiated. Codding and Jones reasoned that the population size hypothesis predicts a slow change to a pre-existing technology, whereas the economic hypothesis predicts a rapid shift to a novel technology. Accordingly, they concluded that the economic hypothesis is a better explanation for the de-intensification of fishing practices during the MLT.
Collard et al. [47] tested the population size hypothesis as part of a study that focused on the drivers of technological complexity among 85 recent hunter–gatherer groups from western North America. They were interested in whether overall number of technological traits is associated with population size or with proxies for environmental risk. Collard et al. found that variation in the total number of material items and techniques among the populations was correlated with proxies for environmental risk but not with population size.
Collard et al. [48] reported a study that used data from a sample of 49 contact-era hunter–gatherer groups to test the population size hypothesis. They carried out analyses at three geographical scales. They began with the entire sample, which included populations from several different continents. They then analysed populations just from North America. Subsequently, they narrowed the focus further still, and concentrated on populations from the Pacific Northwest. The results of the analyses did not support the hypothesis. Population size was correlated with some toolkit variables in the global sample, but these relationships disappeared when risk of resource failure and mobility were controlled for. Population size was not correlated with the toolkit variables in the North American sample or the sample from the Pacific Northwest. The only variables that influenced toolkit complexity in the regression analyses were proxies for risk of resource failure.
Most recently, Buchanan et al. [50] investigated whether temporal changes in the number of point types in Texas between 13 000 and 400 BP are better explained by environmental risk or population size. Bivariate correlations and a generalized linear model indicated that temporal changes in point-type richness in Texas were significantly associated with variation in one of the proxies for environmental risk—global temperature. There was no relationship between temporal changes in point-type richness and variation in population size.
That more than two-thirds of the tests of the population size hypothesis that have been carried out to date do not support the hypothesis casts doubt on its use to explain patterns in the archaeological record. Interpreting a pattern in the archaeological record as the result of a given process is only justifiable if such patterns have been found to be (i) repeatedly produced by the process in other relevant contexts and (ii) caused by the process in question more often than they are caused by other processes. Given that not even a majority of studies indicate that population size is the dominant driver of cultural complexity, there are no grounds for invoking population size to explain patterns in the archaeological record.
The situation is actually more problematic with respect to explaining major transitions in hominin behavioural evolution in terms of changes in population size. Because the Palaeolithic archaeological record reflects the actions of hunter–gatherers not food-producers, studies in which the population size hypothesis has been tested with data from hunter–gatherers are more relevant than studies in which it has been tested with data from food-producers. Significantly, the two studies that support the population size hypothesis focus on food-producers [6,7], whereas the six studies that do not support it focus on hunter–gatherers [46–51]. Thus, none of the tests that are most relevant for Palaeolithic archaeology support the population size hypothesis.
5. Why do the empirical hunter–gatherer studies refute the population size hypothesis?
Not surprisingly, proponents of the population size hypothesis have argued that there is something wrong with the hunter–gatherer studies. Most prominently, Henrich [52] has questioned the population size estimates used in the contact-era hunter–gatherer studies.
Even leaving aside the fact that it ignores the archaeological studies that also refute the hypothesis, there are two reasons to reject this criticism. One is that most of the hunter–gatherer population size estimates [46–49] were obtained in the same way as the ones for the food-producers [6,7]. Given that the latter support the hypothesis, there is no reason to think that the former are biased against finding an association between population size and technological complexity. Significantly, proponents of the population size hypothesis have repeatedly cited the results of the food-producer studies in a positive manner [26,53].
The other reason to reject Henrich's criticism relates to the fact that several of the hunter–gatherer studies indicate that technological complexity is negatively associated with environmental productivity [46–50]. Because the population size hypothesis predicts a positive association between toolkit complexity and population size, Henrich's criticism only works if the ‘real’ population size estimates track the negative relationship between toolkit complexity and environmental productivity. That is, for Henrich's criticism to work, hunter–gatherer population sizes need to be negatively associated with environmental productivity just like toolkit complexity. Obviously, this is counterintuitive. Based on first principles, we expect to see larger populations in more productive environments. Indeed, this is the relationship that has been identified. Keeley [54], for example, showed that hunter–gatherer population density is positively associated with environmental productivity. Thus, Henrich's criticism also fails on this count.
If the failure of the hunter–gatherer studies to support the population size hypothesis is not due to problems with the studies, then, logically, the models that underpin the population size hypothesis must be missing something important about the evolution of cultural complexity among hunter–gatherers. Models are only as good as their components, i.e. their assumptions, simplifications, definitions, mathematics, etc. As such, the models that underpin the population size hypothesis do not tell us that population size drives cultural complexity in all circumstances. Rather, they tell us that population size has the potential to impact cultural complexity if the circumstances match the ones assumed by the models. So, the question is ‘Which of the components of the models are problematic?’ We are not yet in a position to provide a complete answer to this question, but we can point to some problems with two of the most influential models—those developed by Henrich [4] and Powell et al. [5]. Owing to space limitations, we can only briefly describe the problems. They are discussed in more detail in Vaesen et al. [18].
One problem that is common to Henrich's and Powell et al.'s models concerns the mode of cultural transmission they assume. As we explained earlier, in Henrich's model offspring always learn from the most-skilled individual in the population, whereas in Powell et al.'s model, offspring first learn from their same-sex biological parent and then have the option of increasing their skill level by copying another member of the parental generation providing there is a payoff for doing so. We will refer to these as BEST and PAYOFF, respectively. The problem here is that it is clear that the choice of transmission mode determines whether or not an association between population size and cultural complexity is found. Simulations reported by Vaesen [55] and Vaesen et al. [18] identify two modes of transmission that do not support the association—vertical transmission and conformist transmission. Furthermore, under unbiased transmission, the association fails to hold uniformly. Thus, the mode of transmission is important. Critically, the available ethnographic data do not support the idea that hunter–gatherers can be assumed to employ BEST or PAYOFF. A number of studies have found vertical transmission to be the dominant mode of transmission among hunter–gatherers [56–62]. Other studies provide evidence for non-vertical transmission, especially after childhood, but do not specify the sort of transmission (i.e. unbiased, conformist, anti-conformist, prestige biased, similarity biased or payoff-biased) [59–63]. Henrich & Broesch [64] have reported evidence for payoff transmission among Fijian farmer-fishers. But, in other populations, cultural learners do not restrict themselves to only one learning strategy when engaging in non-vertical transmission. For example, Jordan's work [65] on hunter–gatherers from Northwest Siberia indicates that, after a period of vertical transmission, individuals fine-tune their skills via horizontal transmission, conformist transmission and/or payoff-biased transmission, as well as by individual learning. In a similar vein, a recent study by MacDonald [66] documents the existence of considerable cross-cultural variation in types of transmission among hunter–gatherers. An implication of Jordan's and MacDonald's findings is that neither BEST nor PAYOFF can be assumed to be a universal transmission mechanism for hunter–gatherers.
Another obvious problem with the models of Henrich [4] and Powell et al. [5] is that they assume an individual's skill level is dictated by the skill level of the individual from whom they copied the behaviour plus some amount of copying error or luck. This is inconsistent with the large body of literature on skill acquisition (for a review, see [67]). The work in question indicates that skill level is heavily influenced by practice time. In fact, there is now a consensus that, across a wide range of activities, differences between the performance of experts and individuals of average ability are primarily a consequence of differences in the intensity and/or duration of practice: the former practice considerably more than the latter. A corollary of this is that, contrary to what Henrich's and Powell et al.'s models assume, an individual's skill level is not just dictated by the skill level of the individual being copied plus copying error or luck. It is also heavily influenced by the amount of time the individual practices the behaviour in question. This is important, because practice time can be increased or decreased if circumstances allow. And that means a population can potentially react to the effects of changes in population size on average skillfulness by altering the amount of time they devote to practicing different behaviours. Given this, and the fact that practice time has been found to be an important influence on skill level across a wide range of behaviours, its absence from Henrich's and Powell et al.'s models is a major shortcoming.
A third problem with the models of Henrich [4] and Powell et al. [5] is that they do not take into account the fact that cultural complexity has costs as well as benefits. The models are called selection models, but they are not selection models in the usual sense of the term ‘selection’. In both cases, the selection is not selection by an environmental factor. Instead, it is selection by a learner for a cultural parent with a particular skill level. This is important, because the tools that form the basis of the datasets used in the hunter–gatherer studies would have been used to carry out tasks like catching fish. Their performance would therefore have been under selection in relation to environmental factors. We know that complexity can affect the performance of tools. Depending on the circumstances, a tool can be too complex for optimal performance or not complex enough. In addition, the degree of complexity of a tool affects its cost of manufacture and its cost of maintenance. Support for the idea that the absence of interaction with the environment in the models of Henrich and Powell et al. is important comes from a recent study by Vegvari & Foley [68]. These authors used agent-based modelling to investigate the impact of selection and population density on cultural complexity. Importantly for present purposes, their model included interaction with the environment. They found that high selection pressure in the form of resource pressure resulted in increased cultural complexity even when population size was small and innovation costs were high. The fact that the models of Henrich and Powell et al. do not incorporate interaction with the environment means they are of questionable relevance to tools. Given that tools are the focus of most of the empirical tests of the population size hypothesis and that the vast majority of items recovered from the Palaeolithic archaeological record are tools, this is a particularly serious limitation.
It should be clear from the foregoing, we hope, that there are several reasons to be sceptical that the models of Henrich [4] and Powell et al. [5] capture the process of cultural change among hunter–gatherers. There is another important point to consider here. Neither Henrich's model nor Powell et al.'s model nor any of the other models that underpin the ‘demographic turn’ was designed to test the population size hypothesis. Rather, they were created to demonstrate the feasibility of population size having an effect on cultural complexity. That is, they were developed to show that population size can, in principle, impact cultural complexity. Palaeolithic archaeologists have treated the models of Henrich and Powell as evidence in favour of the population size hypothesis [16], but this is not appropriate. The results of formal and simulation models are not data; they are aids to reasoning.
6. Concluding remarks
We have demonstrated that studies using hunter–gatherer data do not support the population size hypothesis, and we have shown that there is an obvious explanation for this—namely that some of the key features of the main models that underpin the hypothesis are problematic with respect to hunter–gatherers. All that remains for us to do now is to explain how we think Palaeolithic archaeologists should respond to this challenge to the demographic turn.
Needless to say, we do not think ignoring the challenge is sensible. However, we also do not think that abandoning the population size hypothesis and simply interpreting the Palaeolithic archaeological record in terms of some other factor (e.g. adaptation to environmental risk) is a good idea. Instead, we would like to see Palaeolithic archaeologists change their approach to analysing change and stability. In our view, the big problem with the demographic turn in Palaeolithic archaeology is not the interest in population size as an explanatory factor. Even though the available evidence suggests that population size probably was not the main driver of change and stability during the Palaeolithic, treating population size as a potential explanation for any given instance of change or stability is reasonable. But ‘potential’ is the operative word here. The big problem with the demographic turn in Palaeolithic archaeology is a methodological one. As we explained earlier, in most cases, population size has simply been claimed to explain patterns in the Palaeolithic archaeological record, rather than predictions of the population size hypothesis having been tested in relation to the patterns. It is this that needs to change. Population size needs to be treated as one of several potential explanatory factors for a given change or period of stability, and formal tests of the competing hypotheses' predictions carried out. We recognize that carrying out tests like this with archaeological data is difficult, but it is not impossible. This is demonstrated by the studies of Buchanan et al. [50] and Codding & Jones [51] discussed earlier. Mackay et al.'s [69] and Tryon & Faith's [70] recent studies also help to illustrate how such tests can be implemented. The approach we advocate was formalized by Chamberlin [71] and is known as the ‘method of multiple working hypotheses’. In our view, its application is the best way for Palaeolithic archaeologists to avoid going down a demographic turn-like blind alley again.
Acknowledgements
M.C. is grateful to Rob Foley, Marta Lahr, Lawrence Martin and Chris Stringer for inviting him to participate in the Major Transitions in Human Evolution meeting. We thank the following people for their assistance with this paper: Claes Andersson, Jean-Marc Argentin, Raymond Corbey, Andre Costopoulos, Helen Eaton, Rob Foley, Denis French, Lola Greeno, Rex Greeno, Huw Groucutt, Peter Hiscock, Curtis Marean, Jim O'Connell, Dwight Read, Eleanor Scerri, George Serras, Christian Tryon, Pierre Vermeersch, Patrick at the Sawtooth ARI Gallery in Launceston, Tasmania and two anonymous reviewers. We also thank the Tasmanian Museum and Art Gallery Aboriginal Reference Group for permission to work on the material from Oatlands Shelter, Tasmania. Lastly, we thank the National Museum of Australia and the La Havre Museum for giving permission to reproduce some of the images used in this paper.
Competing interests
We declare we have no competing interests.
Funding
M.C.'s work is supported by the Social Sciences and Humanities Research Council of Canada, the Canada Research Chairs Program, the Canada Foundation for Innovation, the British Columbia Knowledge Development Fund and Simon Fraser University. K.V. received support from the Netherlands Organization for Scientific Research (VIDI-grant 016.144312). R.C. and W.R. are supported by the Australian Research Council (discovery grants nos DP120100580 and DP150100586).
References
- 1.Klein RG. 2009. The human career: human biological and cultural origins, 3rd edn Chicago, IL: Chicago University Press. [Google Scholar]
- 2.Mithen S. 2005. The singing Neanderthals: the origins of music, language, mind and body. London, UK: Weidenfeld and Nicholson. [Google Scholar]
- 3.Shennan SJ. 2001. Demography and cultural innovation: a model and some implications for the emergence of modern human culture. Cam. Arch. J. 11, 5–16. ( 10.1017/s0959774301000014) [DOI] [Google Scholar]
- 4.Henrich J. 2004. Demography and cultural evolution: why adaptive cultural processes produced maladaptive losses in Tasmania. Am. Antiq. 69, 197–218. ( 10.2307/4128416) [DOI] [Google Scholar]
- 5.Powell A, Shennan SJ, Thomas MG. 2009. Late Pleistocene demography and the appearance of modern human behavior. Science 324, 1298–1301. ( 10.1126/science.1170165) [DOI] [PubMed] [Google Scholar]
- 6.Kline MA, Boyd R. 2010. Population size predicts technological complexity in Oceania. Proc. R. Soc. B 277, 2559–2564. ( 10.1098/rspb.2010.0452) [DOI] [PMC free article] [PubMed] [Google Scholar]
- 7.Collard M, Ruttle A, Buchanan B, O'Brien MJ. 2013. Population size and cultural evolution in non-industrial food-producing societies. PLoS ONE 8, e72628 ( 10.1371/journal.pone.0072628) [DOI] [PMC free article] [PubMed] [Google Scholar]
- 8.Brumm A, Moore MW. 2005. Symbolic revolutions and the Australian archaeological record. Cam. Arch. J. 15, 157–175. ( 10.1017/S0959774305000089) [DOI] [Google Scholar]
- 9.James HVA, Petraglia M. 2005. Modern human origins and the evolution of behaviour in the later Pleistocene of South Africa. Curr. Anthropol. 46, S3–S27. ( 10.1086/444365) [DOI] [Google Scholar]
- 10.O'Connell JF, Allen J. 2007. Pre-LGM Sahul (Pleistocene Australia-New Guinea) and the archaeology of early modern humans. In Rethinking the human revolution (eds Mellars P, Boyle K, Bar-Yosef O, Stringer C), pp. 395–410. Cambridge, UK: McDonald Institute for Archaeological Research. [Google Scholar]
- 11.Langley MC, Clarkson C, Ulm S. 2011. From small holes to grand narratives: the impact of taphonomy and sample size on the modernity debate in Australia and New Guinea. J. Hum. Evol. 61, 197–208. ( 10.1016/j.jhevol.2011.03.002) [DOI] [PubMed] [Google Scholar]
- 12.Riede F. 2008. The Laacher See-eruption (12,920 BP) and material culture change at the end of the Allerød in Northern Europe. J. Arch. Sci. 35, 591–599. ( 10.1016/j.jas.2007.05.007) [DOI] [Google Scholar]
- 13.Dev S, Riede F. 2012. Quantitative functional analysis of Late Glacial projectile points from northern Europe. Lithics 33, 40–55. [Google Scholar]
- 14.Hopkinson T, Nowell A, White M. 2013. Life histories, metapopulation ecology, and innovation in the Acheulian. Paleoanthropology 2013, 61–76. [Google Scholar]
- 15.Premo LS, Kuhn SL. 2010. Modeling effects of local extinctions on culture change and diversity in the Paleolithic. PLoS ONE 5, e15582 ( 10.1371/journal.pone.0015582) [DOI] [PMC free article] [PubMed] [Google Scholar]
- 16.French JC. 2016. Demography and the Palaeolithic archaeological record. J. Arch. Meth. Theor. 23, 150–199. ( 10.1007/s10816-014-9237-4) [DOI] [Google Scholar]
- 17.Peck JR, Barreau G, Heath SC. 1997. Imperfect genes, Fisherian mutation, and the evolution of sex. Genetics 145, 1171–1199. [DOI] [PMC free article] [PubMed] [Google Scholar]
- 18.Vaesen K, Collard M, Cosgrove R, Roebroeks W. 2016. Population size does not explain past changes in cultural complexity. Proc. Natl Acad. Sci. USA 113, E2241–E2247. ( 10.1073/pnas.1520288113) [DOI] [PMC free article] [PubMed] [Google Scholar]
- 19.Mesoudi A. 2011. Variable cultural acquisition costs constrain cumulative cultural evolution. PLoS ONE 6, e18239 ( 10.1371/journal.pone.0018239) [DOI] [PMC free article] [PubMed] [Google Scholar]
- 20.Kobayashi Y, Kenichi A. 2012. Innovativeness, population size and cumulative cultural evolution. Theor. Popul. Biol. 82, 38–47. ( 10.1016/j.tpb.2012.04.001) [DOI] [PubMed] [Google Scholar]
- 21.Nakahashi W. 2014. The effect of cultural interaction on cumulative cultural evolution. J. Theor. Biol. 352, 6–15. ( 10.1016/j.jtbi.2014.02.032) [DOI] [PubMed] [Google Scholar]
- 22.Schiffels S, Derbin R. 2014. Inferring human population size and separation history from multiple genome sequences. Nat. Genet. 46, 919–925. ( 10.1038/ng.3015) [DOI] [PMC free article] [PubMed] [Google Scholar]
- 23.Klein RG, Steele T. 2013. Archaeological shellfish size and later human evolution in Africa. Proc. Natl Acad. Sci. USA 110, 10 910–10 915. ( 10.1073/pnas.1304750110) [DOI] [PMC free article] [PubMed] [Google Scholar]
- 24.Vermeersch PM, Van Neer W. 2015. Nile behaviour and Late Palaeolithic humans in Upper Egypt during the Late Pleistocene. Quat. Sci. Rev. 130, 155–167. ( 10.1016/j.quascirev.2015.03.025) [DOI] [Google Scholar]
- 25.Jones R. 1977. The Tasmanian paradox. In Stone tools as cultural markers: change, evolution and complexity (ed. Wright RVS.), pp. 189–204. Canberra, Australia: Australian Institute of Aboriginal Studies. [Google Scholar]
- 26.Henrich J. 2016. The secret of our success: how culture is driving human evolution, domesticating our species, and making us smarter. Princeton, NJ: Princeton University Press. [Google Scholar]
- 27.Oswalt WH. 1973. Habitat and technology: the evolution of hunting. New York, NY: Holt, Rinehart, & Winston. [Google Scholar]
- 28.Oswalt WH. 1976. An anthropological analysis of food-getting technology. New York, NY: Wiley. [Google Scholar]
- 29.Taylor R. 2007. The polemics of eating fish in Tasmania: the historical evidence revisited. Aborig. Hist. 31, 1–26. [Google Scholar]
- 30.Bassett E. 2004. Reconsidering evidence of Tasmanian fishing. Environ. Arch. 9, 135–142. ( 10.1179/env.2004.9.2.135) [DOI] [Google Scholar]
- 31.Andersson C, Read D. in press The evolution of cultural complexity: not by the treadmill alone. Curr. Anthropol. ( 10.1086/686317) [DOI] [Google Scholar]
- 32.Hiscock P. 2008. Archaeology of ancient Australia. London, UK: Routledge. [Google Scholar]
- 33.Richards MP, Schulting RJ, Hedges REM. 2003. Archaeology: sharp shift in diet at onset of Neolithic. Nature 425, 366 ( 10.1038/425366a) [DOI] [PubMed] [Google Scholar]
- 34.Collard M, Edinborough K, Shennan SJ, Thomas MG. 2010. Radiocarbon evidence indicates that migrants introduced farming to Britain. J. Arch. Sci. 37, 866–870. ( 10.1016/j.jas.2009.11.016) [DOI] [Google Scholar]
- 35.Jones R. 1965. Archaeological reconnaissance in Tasmania, summer 1963–64. Oceania 35, 191–201. ( 10.1002/j.1834-4461.1965.tb00852.x) [DOI] [Google Scholar]
- 36.Gill ED. 1968. Aboriginal bone implement from fossil bone bed, Tasmania (Records Queen Victoria Museum & Art Gallery No. 31 [New series]). Launceston, Tasmania: Museum Committee, Launceston City Council. [Google Scholar]
- 37.Bowdler S. 1974. Pleistocene data for man in Tasmania. Nature 252, 697–698. ( 10.1038/252697a0) [DOI] [PubMed] [Google Scholar]
- 38.Kiernan K, Jones R, Ranson D. 1983. New evidence from Fraser Cave for glacial age man in southwest Tasmania. Nature 301, 28–32. ( 10.1038/301028a0) [DOI] [Google Scholar]
- 39.Ranson D, Allen J, Jones R. 1983. Australia's prehistory uncovered. Aus. Nat. Hist. 21, 82–87. [Google Scholar]
- 40.Webb C, Allen J. 1990. A functional analysis of Pleistocene bone tools from two sites in southwest Tasmania. Arch. Oceania 25, 75–78. ( 10.1002/j.1834-4453.1990.tb00236.x) [DOI] [Google Scholar]
- 41.Cosgrove R. 2015. Raw material movement and past Tasmanian Aboriginal interaction: implications for understanding isolated human population dynamics. Arch. Oceania 50( Suppl.1), 69–81. ( 10.1002/arco.5049) [DOI] [Google Scholar]
- 42.Jones R. 1967. Middens and man in Tasmania. Aus. Nat. Hist. 18, 359–364. [Google Scholar]
- 43.Gilligan I. 2007. Clothing and modern human behaviour: prehistoric Tasmania as a case study. Arch. Oceania 42, 102–111. ( 10.1002/j.1834-4453.2007.tb00023.x) [DOI] [Google Scholar]
- 44.Jones R. 1971. Rocky Cape and the problem of the Tasmanians. PhD thesis, Australian National University, Australia. [Google Scholar]
- 45.Torrence R. 1989. Re-tooling: towards a behavioral theory of stone tools. In Time, energy and stone tools (ed. Torrence R.), pp. 57–66. Cambridge, UK: Cambridge University Press. [Google Scholar]
- 46.Collard M, Kemery M, Banks S. 2005. Causes of toolkit variation among hunter–gatherers: a test of four competing hypotheses. Can. J. Arch. 29, 1–19. [Google Scholar]
- 47.Collard M, Buchanan B, O'Brien MJ, Scholnick J. 2013. Risk, mobility or population size? Drivers of technological richness among contact-period western North American hunter–gatherers. Phil. Trans. R. Soc. B 368, 20120412 ( 10.1098/rstb.2012.0412) [DOI] [PMC free article] [PubMed] [Google Scholar]
- 48.Collard M, Buchanan B, O'Brien MJ. 2013. Population size as an explanation for patterns in the Paleolithic archaeological record: more caution is needed. Curr. Anthropol. 54, S388–S396. ( 10.1086/673881) [DOI] [Google Scholar]
- 49.Read D. 2008. An interaction model for resource implement complexity based on risk and number of annual moves. Am. Antiq. 73, 599–625. [Google Scholar]
- 50.Buchanan B, O'Brien MJ, Collard M. In press. Drivers of technological richness in prehistoric Texas: an archaeological test of the risk and population size hypotheses. Arch. Anthropol. Sci. (doi:10.1007%2Fs12520-015-0245-4) [Google Scholar]
- 51.Codding BF, Jones TL. 2010. Levels of explanation in behavioral ecology: understanding seemingly paradoxical behavior along the central coast of Alta California. Cal. Arch. 2, 77–91. ( 10.1179/cal.2010.2.1.77) [DOI] [Google Scholar]
- 52.Henrich J. 2010. The evolution of innovation-enhancing institutions. In Innovation in cultural systems: contributions from evolutionary anthropology (eds Shennan SJ, O'Brien MJ), pp. 99–120. Cambridge, MA: MIT Press. [Google Scholar]
- 53.Muthukrishna M, Shulman BW, Vasilescu V, Henrich J. 2014. Sociality influences cultural complexity. Proc. R. Soc. B 281, 20132511 ( 10.1098/rspb.2013.2511) [DOI] [PMC free article] [PubMed] [Google Scholar]
- 54.Keeley LH. 1988. Hunter–gatherer economic complexity and ‘population pressure’: a cross-cultural analysis. J. Anthropol. Arch. 7, 373–411. ( 10.1016/0278-4165(88)90003-7) [DOI] [Google Scholar]
- 55.Vaesen K. 2012. Cumulative cultural evolution and demography. PLoS ONE 7, e40989 ( 10.1371/journal.pone.0040989) [DOI] [PMC free article] [PubMed] [Google Scholar]
- 56.Hewlett BS, Cavalli-Sforza L-L. 1986. Cultural transmission among Aka pygmies. Am. Anthropol. 88, 922–934. ( 10.1525/aa.1986.88.4.02a00100) [DOI] [Google Scholar]
- 57.Shennan S, Steele J. 1999. Cultural learning in hominids: a behavioural ecological approach. In Mammalian social learning (eds Box HO, Gibson KR), pp. 367–388. Cambridge, UK: Cambridge University Press. [Google Scholar]
- 58.Ohmagari F, Berkes K. 1997. Transmission of indigenous knowledge and bush skills among the western James Bay Cree women of subarctic Canada. Hum. Ecol. 25, 197–222. ( 10.1023/A:1021922105740) [DOI] [Google Scholar]
- 59.Aunger R. 2000. The life history of culture learning in a face-to-face society. Ethos 28, 445–481. ( 10.1525/eth.2000.28.3.445) [DOI] [Google Scholar]
- 60.Reyes-García V, et al. 2009. Cultural transmission of ethnobotanical knowledge and skills: an empirical analysis from an Amerindian society. Evol. Hum. Behav. 30, 274–285. ( 10.1016/j.evolhumbehav.2009.02.001) [DOI] [Google Scholar]
- 61.Demps K, Zorondo-Rodríguez F, García C, Reyes-García V. 2012. Social learning across the life cycle: cultural knowledge acquisition for honey collection among the Jenu Kuruba, India. Evol. Hum. Behav. 33, 460–470. ( 10.1016/j.evolhumbehav.2011.12.008) [DOI] [Google Scholar]
- 62.Tehrani J, Collard M. 2009. An integrated analysis of inter-individual and inter-group cultural transmission in Iranian tribal populations. Evol. Hum. Behav. 30, 286–300. ( 10.1016/j.evolhumbehav.2009.03.002) [DOI] [Google Scholar]
- 63.Kline MA, Boyd R, Henrich J. 2013. Teaching and the life history of cultural transmission in Fijian villages. Hum. Nat. 24, 351–374. ( 10.1007/s12110-013-9180-1) [DOI] [PubMed] [Google Scholar]
- 64.Henrich J, Broesch J. 2011. On the nature of cultural transmission networks: evidence from Fijian villages for adaptive learning biases. Phil. Trans. R. Soc. B 366, 1139–1148. ( 10.1098/rstb.2010.0323) [DOI] [PMC free article] [PubMed] [Google Scholar]
- 65.Jordan PD. 2014. Technology as human social tradition: cultural transmission among hunter–gatherers. Oakland, CA: University of California Press. [Google Scholar]
- 66.MacDonald K. 2007. Cross-cultural comparison of learning in human hunting: implications for life history evolution. Hum. Nat. 18, 386–402. ( 10.1007/s12110-007-9019-8) [DOI] [PubMed] [Google Scholar]
- 67.Ericsson KA, Charness N. 1994. Expert performance: its structure and acquisition. Am. Psychol. 49, 725–747. ( 10.1037/0003-066X.49.8.725) [DOI] [Google Scholar]
- 68.Vegvari C, Foley RA. 2014. High selection pressure promotes increase in cumulative adaptive culture. PLoS ONE 9, e86406 ( 10.1371/journal.pone.0086406) [DOI] [PMC free article] [PubMed] [Google Scholar]
- 69.Mackay A, Stewart BA, Chase BM. 2014. Coalescence and fragmentation in the late Pleistocene archaeology of southernmost Africa. J. Hum. Evol. 72, 26–51. ( 10.1016/j.jhevol.2014.03.003) [DOI] [PubMed] [Google Scholar]
- 70.Tryon CA, Faith JT. 2016. A demographic perspective on the Middle to Later Stone Age transition from Nasera rockshelter, Tanzania. Phil. Trans. R. Soc. B 371, 20150238 ( 10.1098/rstb.2015.0238) [DOI] [PMC free article] [PubMed] [Google Scholar]
- 71.Chamberlin TC. 1890. The method of multiple working hypotheses. Science (old series) 15, 92–96. [DOI] [PubMed] [Google Scholar]