

Abstract
Invasive species have an enormous global impact, with international trade being the leading pathway for their introduction. Current multinational trade deals under negotiation will dramatically change trading partnerships and pathways. These changes have considerable potential to influence biological invasions and global biodiversity. Using a database of 47 328 interceptions spanning 10 years, we demonstrate how development and governance socio-economic indicators of trading partners can predict exotic species interceptions. For import pathways associated with vegetable material, a significantly higher risk of exotic species interceptions was associated with countries that are poorly regulated, have more forest cover and have surprisingly low corruption. Corruption and indicators such as political stability or adherence to rule of law were important in vehicle or timber import pathways. These results will be of considerable value to policy makers, primarily by shifting quarantine procedures to focus on countries of high risk based on their socio-economic status. Further, using New Zealand as an example, we demonstrate how a ninefold reduction in incursions could be achieved if socio-economic indicators were used to select trade partners. International trade deals that ignore governance and development indicators may facilitate introductions and biodiversity loss. Development and governance within countries clearly have biodiversity implications beyond borders.
Keywords: biological invasions, free trade, interception rates, governance, quarantine regulations
1. Introduction
Biological invaders are a leading cause of biodiversity loss [1] and have been associated with large-scale changes in ecosystem functioning [2]. For example, the introduction of rats onto remote islands by early explorers and traders resulted in the extinction or population decline of dozens of bird species, as well as other vertebrate and invertebrate taxa [3]. Biological invasions are continuing and rates appear largely unabated, with an increasing risk of new introductions worldwide [4,5]. In the United States, exotic species that have become invasive have been estimated to cost around US$120 billion annually [6]. In New Zealand, the eradication of just three small nests of the red imported fire ant cost in excess of NZ$10 million (figure 1) [7].
Figure 1.
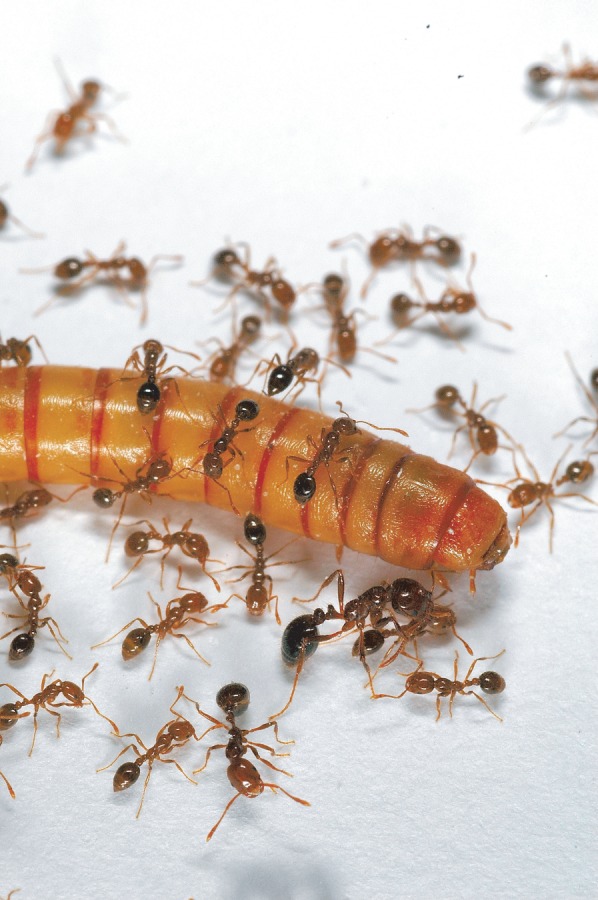
One of the world's worst invasive species: red imported fire ants (Solenopsis invicta). These ants have had three successful incursions into New Zealand, with each incursion consisting of the discovery of a single established ant nest. The resulting incursion responses by the New Zealand government cost the taxpayer approximately NZ$10 million dollars to ensure that ants from these three nests were eradicated. The approximate averted economic impact has been estimated at NZ$665 million over a 23-year period [7]. The ants pictured here are attacking a mealworm (Tenebrio molitor). Photo by Phil Lester.
These invasive species are consequently of increasing concern to policy makers, international bodies, conservationists and public health officials [1,4–8]. A primary facilitator in the movement and introduction of exotic or invasive species is international trade [4]. Globalization continues to facilitate the proliferation of exotic species movement via transport of goods and people around the planet, and it is predicted this trend will continue [8,9]. Several major multinational trade deals are currently under negotiation or have recently concluded, such as the Trans-Pacific Partnership Agreement (TPPA). These agreements will result in increases and shifts in global trade patterns, almost certainly opening new pathways in which exotic species may be entrained.
Internationally, a range of trade institutions and agreements exist in order to regulate the movement of exotic species in trade. These include the World Trade Organization's (WTO) Agreement on the Application of Sanitary and Phytosanitary Measures (SPS agreement). These agreements provide policies regulating trade risks associated with human, animal and plant health. It also provides rules for risk management associated with the risk of exotic species in international trade [10]. The World Organisation for Animal Health (OIE), International Plant Protection Convention (IPPC) and the Codex Alimentarius Commission set international standards for imports of animal, plant and food commodities, respectively. The SPS Agreement advocates use of these standards. WTO members are expected to import and export products with reference to these regulations. Despite the intent and provisions of these regulatory measures, there is almost certainly variation in their implementation. Socio-economic and development factors can have considerable influence on countries' economic growth and environmental standards [11,12], and probably influence their abilities to effect phytosanitary standards and implement sound biosecurity systems. Previous work has suggested that socio-economic factors such as protected land cover or gross domestic product (GDP) indices are correlated with exotic species invasions [4,13], but have not ascertained the importance of factors such as corruption or the ability of governments to formulate and implement sound policies and regulations [5]. Here, we assess the influence of governance and development indicators [14] on the rate of non-native species incursions associated with international trade.
2. Material and methods
(a). Exotic species detections
Exotic species detection data were obtained of all border interceptions in New Zealand, with identifications conducted by the Ministry for Primary Industries. Local biosecurity agents undertook the inspection protocols either (a) pre-border (for instance onboard vessels destined for New Zealand ports) or (b) at New Zealand sea- or airports (see the electronic supplementary material for detailed information). We calculated a yearly per country index of interceptions for all imports into New Zealand from 2002–2011 across three broad commodity trade pathways: vegetable material, timber and vehicles. Vegetable material included cut flowers/foliage, fresh produce, medicine/herbal treatments, nursery stock, other plant material and seeds or grain. Studies have found that vegetable material such as flower cuttings and nursery stock are important vectors of exotic species [15,16]. Timber items included bamboo, cane, rattan items, basketware, timber, wood items and willow. The vehicle pathway included car parts, tyres and used and new vehicles.
We calculated a commodity-specific detection index for countries exporting goods to New Zealand. For countries to be included in our analysis, they needed to have an export value more than NZ$1 million in at least one of the three pathways (vegetable material, timber and vehicles) over the period of analysis (2002–2011). The greater NZ$1 million limitation was to ensure there has been a sufficient volume of trade to provide a robust interception index. Our detection index = log ((interceptions/total trade NZ$) + 1). This index was then rescaled to produce a detection index that varies from 0 (no interception) to 1 (highest observed detection index). This index provides a value of the interception rate per unit of trade (figure 2; see the electronic supplementary material).
Figure 2.

The place of origin and volume of total interceptions associated with vegetable material pathway products arriving in New Zealand. The symbol size represents the interception category or the average yearly number of interceptions into New Zealand from the country of origin. To plot meaningful values the formula (total interceptions/total trade)×10 000 000 was used. The colour of the symbols represents the average corruption index for the period of 2002–2011 [14]. Red symbols represent countries that were rated as above the median corruption score (n = 25), while countries with green symbols are rated as having less corrupt governance as they have values at or below the median corruption score (n = 26).
(b). Development and governance indicators
Governance indicators were obtained from the World Bank World Governance Indicators (WGI) database (www.govindicators.org), and included political stability and freedom from violence, government effectiveness and regulatory quality (for a full list, see table 1). These indicators are based on several hundred variables obtained from 31 different data sources, capturing governance perceptions as reported by survey respondents, non-governmental organizations, commercial business information providers and public sector organizations worldwide [14]. Our indicator list had a focus on factors that we considered likely to influence the ability of governments to implement biosecurity or quarantine programmes. We also included indicators such as GDP, which are suggested to be related to invasion rates [4]. Socio-economic factors such as woodland cover and protected land area have also been suggested as important [13] and we therefore included in our analysis the available related estimates of the area of land under forest and agricultural cover. Development indicators were obtained from the World Bank Development Indicators database (http://data.worldbank.org/indicator), and included the area of forested land, GDP and exports as a percentage of GDP (table 1).
Table 1.
World Bank World Governance Indicators summarized from Kaufmann et al. [14] and the World Bank Development Indicators 2014 from the World Bank Development Indicators database. Terms in brackets and italics are used in table 2 and figure 2.
| Agricultural land (agriculture)b. Agricultural land refers to the share of land area that is arable, under permanent crops and under permanent pastures. |
| Control of corruption (corruption)a. Perceptions of the extent to which public power is exercised for private gain, including both petty and grand forms of corruption, as well as ‘capture’ of the state by private interests. |
| Exports of goods and services (exports)b. Exports of goods and services represent the value of all goods and other market services provided to the rest of the world. |
| Forest area (forest)b. Forest area is land under natural or planted stands of trees of at least 5 m2 in situ, whether productive or not. This is an indicator of each government's natural resource management. |
| Government effectiveness (effectiveness)a. The perceptions of the quality of public services, the quality of the civil service and the degree of its independence from political pressures; the quality of policy formulation and implementation, and the credibility of the government's commitment to such policies. |
| Gross domestic product (GDP)b. GDP per capita is gross domestic product divided by mid-year population. |
| Political stability and freedom from violence/terrorism (stability)a. Capturing perceptions of the likelihood that a government will be destabilized or overthrown by unconstitutional or violent means. |
| Regulatory quality (regulator)a. The ability of the government to formulate and implement sound policies and regulations that permit and promote private sector development. |
| Rule of law (law)a. The extent to which agents have confidence in and abide by the rules of society and in particular the quality of contract enforcement, property rights, the police and the courts, as well as the likelihood of crime and violence. |
| Voice and accountability (voice)a. Perceptions of the extent to which a country's citizens are able to participate in government selection, as well as freedom of expression, freedom of association and media. |
aFrom Kaufmann et al. [14].
bFrom the World Bank Development Indicators (http://data.worldbank.org/indicator).
All indicators used in our risk assessment were rescaled using the function rescale() implemented in the R package scales [17,18] to have a specific minimum (0) and maximum (1). For example, the governance indicator ‘regulatory quality’ originally ranges from −2.5 (low regulatory quality) to 2.5 (high regulatory quality). Therefore, the rescaled data correspond to (0) low regulatory quality and (1) high regulatory quality. Data on international trade volumes were sourced from Statistics New Zealand. Import values for overseas merchandise trade are given on a cost, insurance and freight basis (CIF). CIF is a contract for carriage of goods in which the seller ships goods and pays for the cost of shipping and insurance. Statistics New Zealand organizes its import and export data based on the New Zealand Harmonised System Classification 2012 (NZHSC). The NZHSC is a document based on the World Customs Organization's Harmonized Commodity Description and Coding System (HS). More than 190 countries use the HS as a basis for customs tariffs and for the collection of international trade statistics.
(c). Statistical analyses
All data analyses were performed in R v. 3.2.1 [17]. First, we used a linear mixed-effects model (LMM) implemented in the package lme4 [19] to assess the likelihood of countries exhibiting a range of governance and development indicators to donate exotic species to New Zealand. For each commodity pathway, the detection index was the response variable, and each of the governance and development indices and time (2002–2011) were set as predictors in the model structure. Country was set as a random effect. Second, we performed a parametric bootstrapping procedure for each of the three fitted models (n = 1000 simulations) to provide a robust model estimation and account for any potential influential data and outliers in our dataset. Model coefficients (b) were bootstrapped using the function bootMER() and confidence intervals using the function boot.ci(), both implemented in the package lme4 [19]. Then, we carried out a stepwise model selection to reduce model complexity. Each predictor in the general model was assessed using the function Anova() implemented in the package car [20] and removed from the model structure if p > 0.100. The model fit of the general model was then compared with the restricted model using the generic function anova(). Because the global p-values provided in the stepwise model selection are larger than the simulation-based parameter, we adopted a conservative approach and retained predictors exhibiting p-values less than 0.100 [21]. Alternative analytical approaches, such as using GAMM analyses, provided strikingly similar results to the LMM with the same predictor sets and parameter estimates (see electronic supplementary material and table 2).
Table 2.
The influence of the selected governance and development indicators on the detection index. We used a linear mixed-effects model to perform three sets of analyses, one for each pathway (vegetable material, timber and vehicle). We initially adopted a full model design and then performed a stepwise model selection. The predictors are presented in order of removal from the model structure. The full models and the reduced models are not significantly different, indicating that a similar level of variation is explained but with fewer predictors in the model structure (full model includes all variables; reduced model includes only italicized variables).
| vegetables | χ2 | p-value | timber | χ2 | p-value | vehicles | χ2 | p-value |
|---|---|---|---|---|---|---|---|---|
| law | 0.005 | 0.944 | forest | 0.009 | 0.926 | voice | 0.135 | 0.713 |
| stability | 0.064 | 0.800 | GDP | 0.012 | 0.912 | effectiveness | 0.343 | 0.558 |
| exports | 0.129 | 0.720 | effectiveness | 0.022 | 0.881 | forest | 0.986 | 0.321 |
| voice | 0.148 | 0.701 | regulator | 0.012 | 0.915 | GDP | 0.488 | 0.485 |
| agriculture | 0.773 | 0.379 | agriculture | 0.467 | 0.495 | regulator | 0.763 | 0.382 |
| GDP | 1.170 | 0.279 | exports | 0.593 | 0.441 | agriculture | 1.034 | 0.309 |
| effectiveness | 1.422 | 0.233 | voice | 0.971 | 0.324 | law | 1.452 | 0.228 |
| forest | 2.816 | 0.093 | stability | 1.559 | 0.212 | corruption | 3.653 | 0.056 |
| regulator | 6.477 | 0.011 | corruption | 3.651 | 0.056 | stability | 4.668 | 0.031 |
| corruption | 7.133 | 0.008 | law | 7.422 | 0.006 | exports | 38.043 | <0.001 |
| time | 8.369 | 0.004 | time | 8.838 | 0.003 | time | 9.764 | 0.002 |
| full versus selected | 3.667 | 0.817 | full versus selected | 3.581 | 0.893 | full versus selected | 5.139 | 0.643 |
Finally, using the restricted model, we predicted the exotic species detection index for hypothetical trade partnership scenarios. Each partnership scenario was developed from countries exhibiting either high (top quartile) or low (bottom quartile) governance and development indices selected for each commodity pathway (see electronic supplementary material, figures S1–S3). For the vegetable material pathway, for example, the selected indices were regulator, corruption and forest. Therefore, the hypothetical scenarios derived for this pathway were (i) an optimal scenario, with high corruption, high regulatory quality and low forest cover, and (ii) a worst-case scenario, with low corruption, low regulatory quality and high forest cover. Each trade partnership scenario was derived using a bootstrapping procedure that generated 112 hypothetical countries (5% of the total interceptions for vegetable material; n = 2240). Bootstrapping was performed using the generic function sample(). We assumed that our return data (hypothetical trade scenario) was normally distributed and allowed for resampling. Also, we randomly selected a single given time period of 2003 from the full dataset (2002–2011), which was also used to predict the exotic species detection index. This random selection of a single time was used because of the significant change in time for detection as observed in the main model (table 1). We used the generic function predict() for predictions derived from the restricted models.
3. Results
(a). Interception records
Between 2002 and 2011 there were 47 328 species interceptions recorded by New Zealand quarantine officials associated with these three pathways. We consider these interceptions indicative of global exotic species invasion pressure because phytosanitary and quarantine treatments within each country of export origin are likely to be broadly similar irrespective of trade destinations.
(b). Development and governance indicators predict exotic species detection
Our results demonstrate that exporting countries' development and governance are strongly associated with exotic species interceptions. A significantly higher rate of exotic species interception was observed from countries with weaker regulatory quality, inferior ‘rule of law’, and poorer political stability and freedom from violence (table 2 and figure 2). Corruption, though, was the only predictor able to estimate invasive species interception in all three commodity pathways. Corruption is defined as capturing perceptions of the extent to which public power is exercised for private gain, including both petty and grand forms of corruption, as well as the ‘capture’ of the state by elites and private interests [12]. Across all pathways analysed, a decrease in corruption was linked with an increase in non-native species detections (figure 3), which was the opposite trend to that which we initially predicted.
Figure 3.

Effect of selected indicators on exotic species interception rates. For each export pathway (a–c), we show the bootstrapped coefficients estimated from the linear mixed-effects model. As coefficients were derived from standardized values, they are directly comparable with each other and are presented in order from highest to lowest values. Shaded squares indicate the mean, bold lines the standard errors and non-bolded lines the 95% CIs. Vertical lines mark b = 0, where predictors have no effect. Time was coded to show the changes in non-native species interception from 2002–2011. Significant predictors are labelled with asterisks as per table 2. (Online version in colour.)
The detection rate of exotic species associated with imports decreases as the regulatory quality (regulator) of exporting countries improves for the vegetable material pathway (figure 3). Our analysis indicates that if New Zealand were to change its behaviour to importing from countries with higher regulatory quality, it would experience a twofold decrease in interception rates for vegetable pathways (electronic supplementary material, figure S1). The percentage of forest cover (forest) was positively associated with interceptions on vegetable material.
The indicator of political stability and freedom from violence (stability) captures perceptions of the likelihood that a government will be destabilized or overthrown by unconstitutional or violent means, including politically motivated violence and terrorism [12]. Political stability was the third most important significant predictor of non-native species incursion risk for the vehicle pathway (figure 3). As countries become more stable their exotic species detection index decreases. These results suggest that such change in trade patterns could potentially halve the rate of non-native species associated with vehicle imports (electronic supplementary material, figure S2).
Our analysis also shows that the risk of exotic species associated with commodity trade has significantly changed over time for all three pathways. The direction of this change, however, was different between pathways (figure 3). On vegetable material and timber, quarantine interceptions declined over the 10-year period. On vehicle imports into New Zealand, detections showed an increasing trend. These results demonstrate that biosecurity threats are dynamic, which is probably driven by a range of factors including change in the commodities being imported, their origin and changes in regulations, and their enforcement within the countries of export origin.
(c). Optimal and worst-case import scenarios
To exemplify the potential impacts of highly selective trading patterns, we developed two scenarios incorporating the three significant governance and development indicators for vegetable material imports. The hypothetical scenarios derived for this pathway were (i) an optimal scenario, with high corruption, high regulatory quality and low forest cover, and (ii) a worst-case scenario, with low corruption, low regulatory quality and high forest cover. These contrasting scenarios showed a ninefold difference in the predicted interception rate (figure 4) and demonstrate the potential for carefully selecting trading partners to limit exotic species risk.
Figure 4.
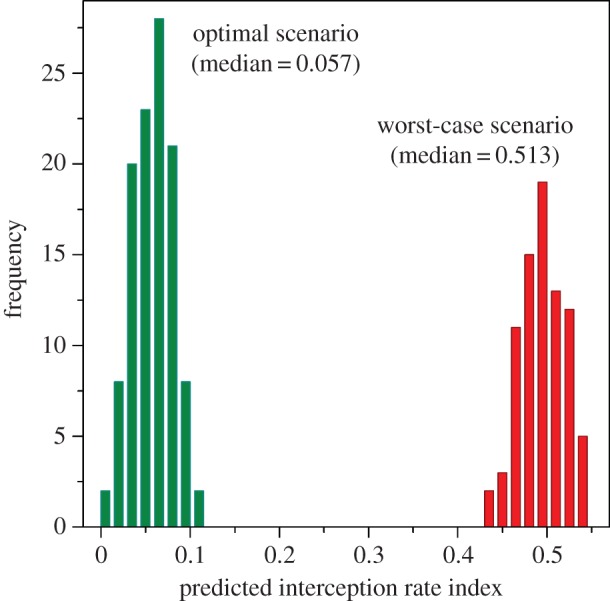
Predicted exotic species interception rate for two hypothetical scenarios incorporating the three selected governance and development indicators from the analysis on vegetable material imports. Indicators of trade partnership scenarios were ranked as either ‘high’ (top quartile) or ‘low’ (lower quartile). The optimal trade scenario (green) simulates a partnership with countries with high corruption, high regulatory quality and low forest cover. The worst-case scenario (red) simulates a partnership with 112 interception values from countries with low corruption, low regulatory quality and high forest cover. The predicted interception index ranged from 0 (no interceptions) to 1 (the maximum possible interception rate). We observed a ninefold reduced index by carefully selecting trading partners. (Online version in colour.)
4. Discussion
International trade is now the leading source of exotic species introductions [4,22,23]. It is well known that different invasion pathways, vectors and invasive species pose different levels of exotic species risk, and vary over time as well as with recipient location [24,25]. Current risk assessment paradigms require detailed information inputs regarding suitable habitats, propagule pressure and current distribution or abundance [25,26]. Here, we use a novel approach to demonstrate that readily available governance and development indicators can be used to predict non-native species incursions in trade. This approach could help to inform international trade policy and decision-making. For example, when purchasing vegetable or timber products, importers could select products from countries with good regulatory quality as this markedly reduces the rate of exotic species detection. In addition, the indicators we have identified can provide empirical evidence for risk managers to prioritize border surveillance measures. We view our approach as complementary to current risk assessment procedures in that high-resolution risk assessments can be targeted at species from high-risk countries based on governance and development indicators as strong predictors of incursion risk. Further, export phytosanitary capacity is often lacking in countries with poor regulation and stability. Although our data are only drawn from New Zealand interceptions, the indicators and trade pathways used in our analyses are likely to apply at a global scale.
The relationship with most development and governance indicators varied with interception rates in a logical manner. For example, the percentage of forest cover (forest) was positively associated with interceptions on vegetable material. This was unsurprising, as forest areas are typically associated with high biodiversity [27]. It seems likely that areas with high biodiversity, such as forests, simply have more species with relatively high abundance able to be entrained in the vegetable material export pathway. Similarly demonstrating a logical relationship were predictors such as regulatory quality or the ability of governments to formulate and implement sound policies and regulations that permit and promote private sector development. Previous work has suggested that the efficacy of regulations designed to protect the environment or targeted specifically at invasive species is mixed [28,29], and, perhaps in agreement with these previous studies, regulatory ability was only statistically significant for the vegetable pathway.
Not all the development and governance predictors demonstrated an expected relationship with exotic species interceptions. Our initial expectation was that increasing levels of corruption would be associated with an increasing interception rate, yet we found the opposite trend. One potential explanation for this result is the possibility that organizations in New Zealand importing goods from highly corrupt countries are implementing phytosanitary protocols independent of involvement by the exporting country's government. This implementation would help ensure market access as recipient nations' biosecurity authorities will trust the importer more than the corrupt exporting nation's regulatory authority. An alternative explanation is that this relationship is explainable in terms of economic activity. A lack of corruption is associated with high economic activity [30]. The volume of commodity demand, length and variety of transport networks, and number of ports of entry interact to change the risk of unintentional exotic species incursions [6]. High levels of economic activity in donor nations, which is associated with low levels of corruption, may be driving our observed negative relationship between corruption and incursions.
Our results will be of considerable value to policy makers, primarily by enabling a shift in the focus of quarantine procedures towards countries of high risk based on their socio-economic status. Government authorities have limited resources for biosecurity. Any method that enables efficient targeting of quarantine procedure will be of considerable value for reducing biological invasions. Such a targeting process would be implementing a version of geographical profiling or horizon scanning that is recognized as promising new tools in biological invasion management [5]. Our results, however, also suggest that selecting trading partners based on socio-economic indicators could potentially result in a ninefold decrease in non-native species interception rates. Our data indicate that it would be relatively simple to halve incursion rates associated with commodities such as vehicles by importing only from countries with high measures of political stability and freedom from violence/terrorism (electronic supplementary material, figure S2). However, a government-enforced policy not to import a brand or, for example, a type of vehicle due to biosecurity risks is unlikely to be acceptable to consumers.
The conclusion of new free trade agreements will dramatically change patterns of trade and movement of exotic species globally. State parties should be aware that such agreements will change the exotic species risk profile of their imports due to differing levels of governance and development of new trade partners or through increased trade with present partners. Our approach represents a novel consideration when assessing exotic species' risk associated with trade, which has historically focused on biological or ecological characteristics of individual taxa (e.g. [31,32]). Our approach presented here is novel and the results will substantially inform risk assessment. This type of analysis would justify targeting quarantine or biosecurity resources towards specific trade partners. Such analyses will also allow importing countries to confront exporters with the costs of their actions [33]. Negotiators of new global free trade agreements should be cognizant of the exotic species risk associated with changing patterns of trade.
Supplementary Material
Acknowledgements
We thank New Zealand's Ministry for Primary Industries for sharing the interception data, and Rebecca Priestley, Tony Brenton-Rule and two anonymous referees for providing valuable comments on the manuscript.
Data accessibility
Data are available from Dryad, http://dx.doi.org/10.5061/dryad.1qq64.
Authors' contributions
E.C.B.-R. and P.J.L. conceived the project and designed the research. All authors carried out the research, analysed the data and were involved in writing the manuscript.
Competing interests
We have no competing interests.
Funding
This work was funded by Victoria University of Wellington. P.J.L. was supported by an RSNZ James Cook Fellowship.
References
- 1.Vitousek PM, D'Antonio CM, Loope LL, Rejmanek M, Westbrooks R. 1997. Introduced species: a significant component of human-caused global change. N. Z. J. Ecol. 21, 1–16. [Google Scholar]
- 2.Ehrenfeld JG. 2010. Ecosystem consequences of biological invasions. Annu. Rev. Ecol. Syst. 41, 59–80. ( 10.1146/annurev-ecolsys-102209-144650) [DOI] [Google Scholar]
- 3.Towns DR, Atkinson IAE, Daugherty CH. 2006. Have the harmful effects of introduced rats on islands been exaggerated? Biol. Invasions 8, 863–891. ( 10.1007/s10530-005-0421-z) [DOI] [Google Scholar]
- 4.Hulme P. 2009. Trade, transport and trouble: managing invasive species pathways in an era of globalization. J. Appl. Ecol. 46, 10–18. ( 10.1111/j.1365-2664.2008.01600.x) [DOI] [Google Scholar]
- 5.Essl F, et al. 2015. Crossing frontiers in tackling pathways of biological invasions. BioScience 65, 769–782. ( 10.1093/biosci/biv082) [DOI] [Google Scholar]
- 6.Pimentel D, Zuniga R, Morrison D. 2005. Update on the environmental and economic costs associated with alien-invasive species in the United States. Ecol. Econ. 52, 273–288. ( 10.1016/j.ecolecon.2004.10.002) [DOI] [Google Scholar]
- 7.Goldson SL, et al. 2015. New Zealand pest management: current and future challenges. J. R. Soc. N. Z. 45, 31–58. ( 10.1080/03036758.2014.1000343) [DOI] [Google Scholar]
- 8.Tittensor DP, et al. 2014. A mid-term analysis of progress toward international biodiversity targets. Science 346, 241–245. ( 10.1126/science.1257484) [DOI] [PubMed] [Google Scholar]
- 9.Lodge DM, et al. 2006. Biological invasions: recommendations for U.S. policy and management. Ecol. Appl. 16, 2035–2054. ( 10.1890/1051-0761(2006)016%5B2035:BIRFUP%5D2.0.CO;2) [DOI] [PubMed] [Google Scholar]
- 10.World Trade Organization. 1995. Agreement on the application of sanitary and phytosanitary measures. Geneva, Switzerland: World Health Organization. [Google Scholar]
- 11.Halkos GE, Tzeremes NG. 2013. Carbon dioxide emissions and governance: a nonparametric analysis for the G-20. Energy Econ. 40, 110–118. ( 10.1016/j.eneco.2013.06.010) [DOI] [Google Scholar]
- 12.Gallardo B, Aldridge DC. 2013. The ‘dirty dozen’: socio-economic factors amplify the invasion potential of 12 high-risk aquatic invasive species in Great Britain and Ireland. J. Appl. Ecol. 50, 757–766. ( 10.1111/1365-2664.12079) [DOI] [Google Scholar]
- 13.Vilà M, Pujadas J. 2001. Land-use and socio-economic correlates of plant invasions in European and North African countries. Biol. Conserv. 100, 397–401. ( 10.1016/S0006-3207(01)00047-7) [DOI] [Google Scholar]
- 14.Kaufmann D, Kraay A, Mastruzzi M. 2010. The worldwide governance indicators: methodology and analytical issues. Policy research working paper 5430. Washington, DC: World Bank. See http://ssrn.com/abstract=1682130.
- 15.Liebhold AM, Brockerhoff EG, Garrett LJ, Parke JL, Britton KO. 2012. Live plant imports: the major pathway for forest insect and pathogen invasions of the US. Front. Ecol. Environ. 10, 135–143. ( 10.1890/110198) [DOI] [Google Scholar]
- 16.Sakalidis ML, Slippers B, Wingfield BD, Hardy GESJ, Burgess TI. 2013. The challenge of understanding the origin, pathways and extent of fungal invasions: global populations of the Neofusicoccum parvum—N. ribis species complex. Divers. Distrib. 19, 873–883. ( 10.1111/ddi.12030) [DOI] [Google Scholar]
- 17.R Core Team. 2015. R: a language and environment for statistical computing. Vienna, Austria: R Foundation for Statistical Computing. [Google Scholar]
- 18.Wickham H. 2015. Scales: scale functions for visualization. R package version 0.2.5. See http://CRAN.R-project.org/package=scales.
- 19.Bates D, Maechler M, Bolker B, Walker S. 2015. lme4: linear mixed-effects models using Eigen and S4. R package version 1.1–8. See http://CRAN.R-project.org/package=lme4.
- 20.Fox J, Weisberg S. 2010. An R Companion to applied regression, 2nd edn Thousand Oaks, CA: Sage Publications. [Google Scholar]
- 21.Pinheiro JC, Bates DM. 2000. Mixed-effects models in S and S-PLUS. New York, NY: Springer. [Google Scholar]
- 22.Margolis M, Shogren JF, Fischer C. 2005. How trade politics affect invasive species control. Ecol. Econ. 52, 305–313. ( 10.1016/j.ecolecon.2004.07.017) [DOI] [Google Scholar]
- 23.Ding J, Mack RN, Lu P, Ren M, Huang H. 2008. China's booming economy is sparking and accelerating biological invasions. BioScience 58, 317–324. ( 10.1641/B580407) [DOI] [Google Scholar]
- 24.Kolar C, Lodge D. 2001. Progress in invasion biology: predicting invaders. Trends Ecol. Evol. 16, 199–204. ( 10.1016/S0169-5347(01)02101-2) [DOI] [PubMed] [Google Scholar]
- 25.Marchetti M, Moyle P, Levine R. 2004. Alien fishes in California watersheds: characteristics of successful and failed invaders. Ecol. Appl. 14, 587–596. ( 10.1890/02-5301) [DOI] [Google Scholar]
- 26.Pheloung P, Williams P, Halloy S. 1999. A weed risk assessment model for use as a biosecurity tool evaluating plant introductions. J. Environ. Manage. 57, 239–251. ( 10.1006/jema.1999.0297) [DOI] [Google Scholar]
- 27.Myers N, Mittermeier RA, Mittermeier CG, da Fonseca GAB, Kent J. 2000. Biodiversity hotspots for conservation priorities. Nature 403, 853–858. ( 10.1038/35002501) [DOI] [PubMed] [Google Scholar]
- 28.Kleijn D, Sutherland W. 2003. How effective are European agri-environment schemes in conserving and promoting biodiversity? J. Appl. Ecol. 40, 947–969. ( 10.1111/j.1365-2664.2003.00868.x) [DOI] [Google Scholar]
- 29.Hulme P, et al. 2008. Grasping at the routes of biological invasions: a framework for integrating pathways into policy. J. Appl. Ecol. 45, 403–414. ( 10.1111/j.1365-2664.2007.01442.x) [DOI] [Google Scholar]
- 30.Mauro P. 1995. Corruption and growth. Q. J. Econ. 110, 681–712. ( 10.2307/2946696) [DOI] [Google Scholar]
- 31.Stohlgren TJ, Schnase JL. 2006. Risk analysis for biological hazards: what we need to know about invasive species. Risk Anal. 26, 163–173. ( 10.1111/j.1539-6924.2006.00707.x) [DOI] [PubMed] [Google Scholar]
- 32.Lester PJ. 2006. Determinants for the successful establishment of exotic ants in New Zealand. Divers. Distrib. 11, 279–288. ( 10.1111/j.1366-9516.2005.00169.x) [DOI] [Google Scholar]
- 33.Perrings C, Dehnen-Schmutz K, Touza J, Williamson M. 2005. How to manage biological invasions under globalization. Trends Ecol. Evol. 20, 212–215. ( 10.1016/j.tree.2005.02.011) [DOI] [PubMed] [Google Scholar]
Associated Data
This section collects any data citations, data availability statements, or supplementary materials included in this article.
Supplementary Materials
Data Availability Statement
Data are available from Dryad, http://dx.doi.org/10.5061/dryad.1qq64.