

Abstract
Metastatic breast tumors undergo epithelial-to-mesenchymal transition (EMT), which renders them resistant to therapies targeted to the primary cancers. The mechanistic link between mtDNA (mitochondrial DNA) reduction, often seen in breast cancer patients, and EMT is unknown. We demonstrate that reducing mtDNA content in human mammary epithelial cells (hMECs) activates Calcineurin (Cn)-dependent mitochondrial retrograde signaling pathway, which induces EMT-like reprogramming to fibroblastic morphology, loss of cell polarity, contact inhibition and acquired migratory and invasive phenotype. Notably, mtDNA reduction generates breast cancer stem cells. In addition to retrograde signaling markers, there is an induction of mesenchymal genes but loss of epithelial markers in these cells. The changes are reversed by either restoring the mtDNA content or knockdown of CnAα mRNA, indicating the causal role of retrograde signaling in EMT. Our results point to a new therapeutic strategy for metastatic breast cancers targeted to the mitochondrial retrograde signaling pathway for abrogating EMT and attenuating cancer stem cells, which evade conventional therapies. We report a novel regulatory mechanism by which low mtDNA content generates EMT and cancer stem cells in hMECs.
Keywords: mitochondrial DNA, mitochondrial retrograde signaling, epithelial, mesenchymal transition, breast cancer, ESRP1, cancer stem cells
INTRODUCTION
Mitochondria are the major sites of energy generation contributing to ~80% of cellular ATP in mammalian cells. They also have an important role in maintaining calcium homeostasis and integrating both intrinsic and extrinsic apoptosis pathways.1 Each mammalian cell contains 100–1000 copies of mitochondrial DNA (mtDNA), which codes for 13 polypeptides that are essential components of the electron transport chain, in addition to rRNAs and tRNAs. All other mitochondrial proteins are coded by the nuclear genome.2 Therefore, a coordinated expression of both genomes is essential for mitochondrial biogenesis and function. Mitochondrial functions can be affected by defects in mtDNA, alterations in nuclear DNA-encoded mitochondrial proteins or drug-induced mitochondrial membrane damage. Defects in mtDNA, including mutations and low mtDNA copy number, have been implicated in a wide range of disorders such as neurodegenerative disorders, mitochondrial myopathies, aging and cancer.3,4 Reduction in mtDNA copy number results in disruption of electron transfer chain complexes and loss of membrane potential. As a consequence, there is an elevation of cytosolic Ca2+ levels and activation of calcineurin (Cn)-mediated retrograde signaling to the nucleus.5–7
MtDNA defects including deletions and point mutations have been reported in many human tumors.8–10 The progressive accumulation of mtDNA mutations and deletions observed in some tumors and the heteroplasmic mtDNA mutations reported suggest that these perturbations are associated with tumorigenesis.11,12 Transmitochondrial cybrids in HeLa cells with homoplasmic mtDNA mutations in the mtATP6 gene showed increased cell growth in vitro and higher tumor incidence in nude mice.13
Reduction in mtDNA copy number has been observed in many cancers including hepatocellular carcinomas, astrocytomas, prostate and breast cancers.10,12,14–16 Furthermore, chemically induced mtDNA depletion in colorectal and prostate cancer cells promotes the emergence of aggressive cancers, suggesting a causative role of low mtDNA copy number in tumorigenesis.17,18 In support, mice heterozygous for the mitochondrial transcription factor A (TFAM), resulting in reduced mtDNA copy number, exhibit increased tumor growth in the small intestine when crossed with the adenomatous polyposis coli multiple intestinal neoplasia mouse model.19
In mammary carcinoma patients, mtDNA mutations and low mtDNA copy number are associated with increased metastasis and poor prognosis.12,16 At the onset of metastasis, mammary carcinomas undergo epithelial–mesenchymal transition (EMT), a process that involves genetic and phenotypic reprogramming of epithelial cells to a predominantly mesenchymal phenotype and loss of cell polarity, cell–cell and cell–extracellular matrix adhesions. This transition enables some cells from the primary tumor mass to migrate out, intravasate into the blood stream, survive in the circulation, extravasate from the blood vessels, colonize and form metastases at distant sites.20,21 The cellular reprogramming in metastatic tumors renders them resistant to therapies targeted to the primary cancer and believed to contribute to the high mortality rates in breast cancer patients.22 Therefore, an increased understanding of pathways that promote such reprogramming events is critical for designing therapeutic interventions against tumor metastasis. Involvement of mtDNA defect in promoting breast cancer metastasis was suggested in a study in which the metastatic potential of cancer cell line MDA-MB-231 was reversed by replacing its mtDNA with that from normal cells (mtDNA cybrid), while keeping the nuclear background unaltered.23
Even though low mtDNA copy number is reported in 63–80% breast cancers,16 its contribution toward EMT and breast cancer metastases has not been previously explored. To investigate the causal role of low mtDNA copy number in promoting EMT, we used two alternative models: one in which mtDNA content is selectively reduced by treatment with low doses of ethidium bromide (EtBr), which does not affect nuclear DNA replication,24,25 and second in which mtDNA is depleted by genetic manipulation of TFAM. To delineate the contribution of reduced mtDNA copy number in tumor initiation and metastatic progression through EMT, we selected human mammary epithelial cells of non-carcinoma (MCF10A) and carcinoma (MCF7) origin. We show that the reduction in mtDNA copy number in human mammary epithelial cells activates a Cn-mediated mitochondrial retrograde signaling that induces the process of EMT by upregulation of mesenchymal gene expression, modulation of alternative splicing factor Esrp1 and generation of breast cancer stem cells.
RESULTS
Mitochondrial respiratory stress induced by reduced mtDNA copy number in mammary epithelial cells
We used 50 ng/ml of EtBr, which is the minimal concentration required for partial depletion of mtDNA in these cells. Figure 1 shows the mtDNA contents of MCF7 and MCF10A cells generated by EtBr treatment for five passages. These cells will be referred to as ‘mtDNA-reduced’ cells. Removal of EtBr from the growth medium allowed for the recovery of mtDNA content to about 70–80% of the untreated parental cells (Figure 1a). These cells are referred to as ‘reverted’ cells. We assessed the relative mtDNA copy numbers between parental MCF10A (normal mammary epithelial) and MCF7 (mammary carcinoma epithelial) cells. MCF7 cells contain ~55% mtDNA copy number compared with that in parental MCF10A cells (Supplementary Figure S1A). It is important to note that we have not observed any significant difference in the amplification of the nuclear gene GAPDH (glyceraldehyde-3-phosphate dehydrogenase) between the two cell lines or the respective parental, mtDNA-reduced and reverted cell types (Supplementary Figure S1B), indicating that the nuclear genome copy number remains unchanged.
Figure 1.

Mitochondrial dysfunction in cells with reduced mtDNA content. (a) Relative mtDNA content analyzed by real-time PCR amplification of mtDNA-coded COX I and nuclear-coded COX IV after EtBr treatment in MCF10A (left) and MCF 7 (right). (b, c) Cellular respiration indicated as the OCR of parental, mtDNA-reduced and reverted MCF10A (b) and MCF7 (c) cells measured by Seahorse XF24 analyzer using 50 000 cells in each type. Coupled and maximal respiration were determined by sequential addition of oligomycin (2 μg/ml), 3,5 DNP (75 μM) and rotenone (1 μM), respectively, as indicated in the figure. (d, e) Mitochondrial staining of MCF10A (d) and MCF7 (e) cells stained with cytochrome oxidase (CcoIVi1) antibody, and nuclei were stained with DAPI. Scale bar, 20 μm.
The mitochondrial functions including oxygen consumption rate (OCR) and glycolysis (extracellular acidification rate) in parental, mtDNA-reduced and reverted MCF10A and MCF7 cells were measured in an extracellular flux analyzer (Seahorse Bioscience, Billerica, MA, USA). The complex V inhibitor oligomycin markedly inhibited mitochondrial respiration in parental and reverted cells, indicating an ATP-coupled mitochondrial respiration. In contrast, ATP-coupled respiration was reduced by more than 70% in mtDNA-reduced cells compared with parental cells, indicating dysfunctional mitochondria (Figures 1b and c, and Supplementary Figures S1C and D).
Maximum uncoupled respiration is an indicator of the functional state of mitochondrial electron transport chain complexes. The difference between maximum uncoupled respiration and basal respiration, termed spare respiratory capacity, is used by cells under higher energy demands. Addition of uncoupler dinitrophenol (DNP) resulted in an increase in OCR to the maximal capacity owing to uncoupling of respiration (Figures 1b and c). In parental and reverted cells, DNP increased OCR by 120% over basal rates, indicating a robust spare respiratory capacity. In mtDNA-reduced cells, DNP did not increase the OCR significantly, indicating that the spare respiratory capacity was significantly diminished (Figures 1b and c). Moreover, in response to mitochondrial stress, cells frequently upregulate glycolysis to compensate for decreased oxidative phosphorylation. Accordingly, mtDNA-reduced cells showed the highest rate of glucose-induced extracellular acidification rate (Supplementary Figure S1D). These results show that mtDNA-reduced MCF10A and MCF7 cells exhibit loss of mitochondrial functions that were restored in reverted cells.
Another important indicator of healthy mitochondria is the abundance of filamentous mitochondrial network. Mitochondrial morphology was examined by confocal fluorescence microscopy of cells stained with antibody to mtDNA-encoded CcO IVi1 subunit. Parental MCF10A and MCF7 cells showed an abundant and highly filamentous mitochondrial network, whereas mtDNA-reduced cells had a markedly diminished network and mostly fragmented mitochondrial particles. As expected, the reverted cells showed a more filamentous structure (Figures 1d and e). We further assessed the mitochondrial transmembrane potential of the parental, mtDNA-reduced and reverted cells using a cell-permeant dye tetramethylrhodamine, ethyl ester that accumulates in functional mitochondria while depolarized mitochondria fail to sequester this dye. As shown in Supplementary Figure S2A, mtDNA-reduced cells have ~30–45% lower membrane potential compared with the parental cells.
Reduction in mtDNA content induces cellular morphological changes
Normal mammary epithelial cells are characterized by their well-organized architecture, polarized morphology, abundant cell junction proteins, dense packing with negligible intercellular space and attachment to the basement membrane, whereas epithelial mammary carcinoma cells lose these hallmark epithelial characteristics.26 Consistent with this, parental MCF10A cells exhibit highly ordered ‘cobblestone-shaped’ epithelial cell morphology in two-dimensional (2D) culture conditions. However, mtDNA-reduced MCF10A cells lose this morphology and adopt a spindle-shaped fibroblast-like appearance more typical of mesenchymal cells (Figure 2a, top panel).
Figure 2.

Morphological changes in mtDNA-reduced MCF10A and MCF7 cells. (a, top panel) Representative bright-field images of parental, mtDNA-reduced and reverted MCF10A cells grown in 2D cultures. (a, bottom panel) Phase contrast images (× 20 magnification) of 3D spheroids formed by parental, mtDNA-reduced and reverted MCF10A cells in 2% matrigel. (b) Two-photon confocal images (× 40 magnification) of Texas-Red-conjugated Phalloidin (left panel) and DAPI (center panel) staining of spheroids formed by parental, mtDNA-reduced and reverted MCF10A cells grown for 14 days under 3D culture conditions using 2% matrigel. (c, top panel) Representative bright-field images (× 20 magnification) of parental, mtDNA-reduced and reverted MCF7 cells grown in 2D cultures. MtDNA-reduced MCF7 cells showed loss of contact inhibition and formed piled up colonies. (c, bottom panel) Bright-field images (× 20 magnification) of spheroids formed in 2% matrigel by parental, mtDNA-reduced and reverted MCF7 cells showing irregular spheres formed by cells with reduced mtDNA content.
In three-dimensional (3D) cultures, normal mammary epithelial cells form glandular structures that resemble mammary acini found in vivo.26,27 Phase contrast images of parental MCF10A cells grown in 3D cultures show spherical, well-organized architecture typical of ‘normal’ mammary epithelial cells, whereas mtDNA-reduced MCF10A cells formed highly irregular spheroids invading into the surrounding matrigel. Reverted MCF10A cells formed spheroids similar to the parental cells (Figure 2a, bottom panel). Phalloidin staining of the 3D spheroids revealed that parental and reverted cells form well-organized actin filaments forming acinar structures compared with the mtDNA-reduced cells, which had highly irregular actin organization (Figure 2b and Supplementary Figure 3). The irregular 3D clusters of spheroids formed by mtDNA-reduced MCF10A cells are typical of highly invasive cells that have disrupted the cytoskeletal organization.26,27 This supports the idea that mitochondrial stress is a potential contributor to mammary cell invasion and metastasis.
MCF7 cells being carcinoma cells in origin do not organize into a typical cobblestone pattern in monolayer 2D cultures. MtDNA-reduced MCF7 cells exhibited loss of contact inhibition and grew as piled-up colonies, a characteristic of metastatic carcinoma cells (Figure 2c, top panel). Parental MCF7 carcinoma cells grown in 3D cultures formed organized spheroids that were dense and compact and had an epithelium-like structure at the periphery with a necrotic core, which is consistent with their tumorigenic origin (Figure 2c, bottom panel). MtDNA-reduced MCF7 cells, on the other hand, formed multiple spheroids that were largely irregular in architecture with no noticeable necrotic core and had protrusions into the matrigel layers consistent with those observed in metastatic tumors.26 Reverted MCF7 cells more closely resembled the parental cells in morphology and growth patterns. These results confirm that changes in morphology and growth patterns of these cells are directly related to reduction in mtDNA copy number. A similar alteration to fibroblast-like morphology was also observed in mtDNA-reduced human lung adenocarcinoma A549 cells, indicating the generality of mitochondrial stress-induced morphological alteration (Supplementary Figure S6C).
Mitochondrial stress generates breast cancer stem cells with self-renewal capacity
During EMT, disseminated cancer cells acquire a self-renewal capacity and stemness, which enable them to colonize distant tissues and form micro-metastases in vivo.20 We therefore assessed the self-renewal potential of mtDNA-reduced MCF10A and MCF7 cells in a serial-passaging sphere-forming assay (Figure 3, and Supplementary Figures S4A and B). For this purpose, we grew the cells in serum-free medium in low-attachment dishes in mammosphere cultures and counted the spheres (termed as Gen1) formed in each cell type. MtDNA-reduced MCF10A and MCF7 cells had eightfold- and fivefold-higher sphere-forming capacity, respectively, compared with their parental cells (Figures 3a and e). On disseminating these Gen1 spheres and further replating them, we observed that mtDNA-reduced MCF10A and MCF7 cells formed markedly higher number of spheres (termed as Gen 2) that were larger in size (Figures 3a, b and e–g). Notably, parental and reverted cells mostly grew as monolayer cultures in Gen2, losing their sphere-forming capacity. Moreover, the spheroids formed by mtDNA-reduced cells survived for⩾45 days, whereas those from the parental cells survived ≤10 days. In addition, we observed a significantly higher number of viable non-adherent floating population of cells in mtDNA-reduced MCF7 cells compared with the parental cells (Supplementary Figure S4A). These disseminated ‘floater cells’ from the mtDNA-reduced MCF7 mammosphere cultures formed larger spheroids during serial passaging in 3D cultures, whereas those from parental cells did not form such spheres. Our results here show that mitochondrial stress generates cells with the potential for continuous self-renewal during serial passaging through generations.
Figure 3.

Induction of cancer stem cells with ‘self-renewal’ capacity by reducing mtDNA copy number. (a and e) Number of spheres formed by parental, mtDNA-reduced and reverted MCF10A (a) and MCF7 (e) cells when grown on low attachment surface. The primary spheres (Gen1) were disintegrated by pipetting and replated further, and secondary spheres (Gen 2) formed by the parental, mtDNA-reduced and reverted cells were counted. (b) Bright-field images of mammospheres formed after 14 days in 3D culture (2% matrigel) by parental, mtDNA-reduced and reverted MCF10A and MCF10A cells. Scale bar, 10 μm. (c, h) CD44 and CD24 expression levels in MCF10A (c) and MCF7 (h) parental, mtDNA-reduced and reverted cells quantified by flow cytometry analysis. (d, i) Immunofluorescence images (× 40 magnification) showing expression levels of CD44 and CD24 in parental, mtDNA-reduced and reverted mtDNA-MCF10A (d) and MCF7 (i) cells. Scale bar, 20 μm. (f) Bright-field images of spheres formed by parental, mtDNA-reduced and reverted MCF7 cells grown on low attachment surface for two generations. Parental and reverted cells lose their sphere-forming capacity in Gen2 and grow as monolayers. Scale bar, 10 μm. (g) Hematoxylin and eosin staining of the spheres formed by parental and mtDNA-reduced MCF7 cells as described in f above. Scale bar, 10 μm.
We assessed the levels of cell surface markers CD44 and CD24 that are altered in metastatic breast cancer stem cells.20,28 Protein levels of CD44 were markedly higher in mtDNA-reduced MCF10A cells compared with the parental and reverted cells (Supplementary Figure S4C). Flow cytometry analysis demonstrated that mtDNA-reduced MCF10A and MCF7 cells (Figures 3c and h, respectively) contain 10-fold-higher CD44+/CD24− population, which are characteristic of breast cancer stem cells. Moreover, 60–70% of mtDNA-reduced MCF10A and MCF7 cells (Supplementary Figures S4D and E, respectively) express CD44, with only ≤10% cells expressing CD24. In contrast, parental cells have only 10–20% expression of CD24 and CD44. Reverted MCF10A and MCF7cells have CD44 and CD24 levels similar to the parental cells. This demonstrates that mitochondrial respiratory stress generates breast cancer stem cells with self-renewal capacity. Immunostaining patterns of CD24 and CD44 in parental, mtDNA-reduced and reverted MCF10A and MCF7 cells (Figures 3d and i, respectively) further confirm the data from flow cytometry analysis that mtDNA-reduced cells exhibit higher expression of CD44 with correspondingly lower levels of CD24.
Acquired migratory potential, invasiveness and metastatic potential in cells with reduced mtDNA content
Carcinoma cells undergoing EMT acquire an increased migratory capacity that enables them to detach from the basement membrane and invade other tissues to promote metastasis.20,21 We assessed the migratory capacity of MCF10A cells (Figures 4a–d) as a function of metastatic potential by using an established scratch-wound healing assay. Unlike MCF7 cells, parental MCF10A cells grow as a confluent monolayer in 2D culture, which is ideal for the collective cell migration assay. In this assay, MCF10A cells with reduced mtDNA content were highly motile and migrated into the ‘scratched’ area within 10 h of plating, whereas the parental and reverted cells showed no migration during this time period. After 20 h of plating, the mtDNA-reduced cells completely covered the ‘scratched’ area, whereas the parental and reverted cells only partially migrated toward the cleared region (Figure 4a and time-lapse videos). Moreover, the migration patterns of the three MCF10A cell types were distinct. The parental and reverted cells migrated only along the leading edge in an unidirectional ordered manner, mostly owing to higher cell division, whereas those with mitochondrial stress were faster and had unorganized trajectory typical of cells with high metastatic potential. These cells also showed pseudopodia-like projections characteristic of metastatic carcinoma cells (Figure 4a and time-lapse videos). The total path, overall displacement and the velocity of mtDNA-reduced MCF10A cells were increased significantly (Figures 4b and c). Windrose plots of cell movement, where all cell tracks are placed at the same starting point, clearly demonstrated the markedly different pattern of motion between parental and mtDNA-reduced cells (Figure 4d).
Figure 4.

Acquired migratory and invasive potential in epithelial cells with reduced mtDNA copy number. (a) Cell migration patterns of parental, mtDNA-reduced and reverted MCF10A cells assessed by scratch-wound healing assay. Representative images shown here were extracted at three time points (0, 10 and 20 h) from the time-lapse recordings (Supplementary Information, Supplementary movie file) captured at 5-min intervals for 20-h duration. (b, c) Individual cells in each category were tracked using the Volocity software (Perkin Elmer) to estimate the maximum velocity of their migration (left panel) and the maximum distance covered during the 20-h migration. Data are expressed as an average of 10 cells tracked. (d) Winrose plot showing the directionality of migration of four representative MCF10A cells in each category as indicated. Individual cells tracked are indicated by different colors. (e) Transwell Matrigel invasion patterns of parental, mtDNA-reduced and reverted MCF10A (top panel) and MCF7 (bottom panel) cells after 24 h of plating. Cells were stained with Hematoxylin and Eosin and imaged under a bright-field microscope (× 10 magnification). (f) Lung sections from PuMA using parental, mtDNA-reduced and reverted MCF10A cells (top two panels) and MCF7 cells (bottom two panels) stained with hematoxylin and eosin. Arrows indicate the human epithelial cells in the lumen of the capillaries. Images were taken at × 40 magnification using a Nikon E600 microscope. Scale bar, 40 μm.
The capacity of cells to migrate across a growth-factor-reduced matrigel basement membrane in vitro is an indicator of their in vivo invasive potential.29 In agreement with previous reports,29,30 we observed the inability of parental MCF7 and MCF10A cells to invade the matrigel membrane in a transwell invasion assay. However, mtDNA-reduced MCF7 and MCF10A cells readily invaded the Matrigel membrane within 24 h (Figure 4e). Moreover, the relative inability of reverted cells to invade the Matrigel membrane supports a direct link between mitochondrial respiratory stress and increased invasiveness.
We assessed the metastatic potential of MCF10A and MCF7 cells in an ex vivo pulmonary metastatic assay (PuMA) in the native 3D collagen network of the mouse lung. This assay mimics the tumor cell microenvironment and stromal interactions that occur in vivo during metastasis.31 As shown in Figure 4f, at the initial time point (day 0), the mtDNA-reduced MCF10A and MCF7 epithelial cells had ‘homed-in’ the lung capillaries with very few parental (MCF10A) and reverted cells and had the histologic appearance of normal human epithelial cells (larger nucleus:cytoplasmic ratio). Differences in the metastatic phenotype between the parental, mtDNA-reduced and reverted MCF7 and MCF10A cells became evident by day 7 (Figure 4f and Supplementary Figure S5a) and became prominent for MCF10A cells by day 14 in PuMA, with the lung sections injected with mtDNA-reduced cells having numerous epithelial cells in the lumen of the capillaries of all sections examined. However, in lung explants from mice injected with parental cells, there was rarely any cell in multiple sections examined. Lung sections from mice injected with reverted cells had fewer epithelial cells in the capillaries compared with mtDNA-reduced cells (Figure 4f and Supplementary Figure S5A). The normal mouse lung epithelial cells can be seen lining the bronchioles (indicated by arrows, Supplementary Figure S5B).
Activation of mitochondrial retrograde signaling in human mammary epithelial cells with reduced mtDNA content
Previously, we reported in C2C12 and A549 cells that mitochondrial retrograde signaling in response to disruption of mitochondrial membrane potential (Δψm) involves the activation of calcium-dependent phosphatase CnA.5,6,32,33 We therefore tested the role of this pathway by mtDNA depletion, which also disrupts Δψm6,34 in the activation of the EMT marker genes in breast epithelial cells. The parental MCF10A and MCF7 cells had low Cn activity, whereas mtDNA-reduced MCF10A and MCF7 cells had a 4–7-fold increase in Cn activity. The Cn activity in reverted cells was similar to parental cells, confirming that the observed CnA activation is in response to reduced mtDNA content (Figure 5a). In addition, we observed an increase in steady-state levels of CnAα in MCF7 cells (Supplementary Figure S6A).
Figure 5.

Induction of hallmarks of mitochondrial retrograde signaling in mtDNA-reduced MCF10A and MCF7 cells. (a) Calcineurin activity in parental, mtDNA-reduced and reverted MCF10A and MCF7 cells. (b, c) Immunoblot showing IGF1 receptor, phospho-Akt (Ser473) and total Akt expression levels in total cell extracts (50 μg) of parental, mtDNA-reduced and reverted MCF10A (b) and MCF7 (c) cells. Beta actin was used to assess equal protein loading. (d, e) Percentage of apoptosis in parental, EtBr-treated mtDNA-reduced and Tfam-silenced mtDNA-reduced MCF10A and MCF7 cells treated with either DMSO or picropodophyllin.
Some of the hallmarks of retrograde signaling include IGF1R, PI-3Kinase and Akt kinase activation, which are critical for the propagation of the signaling cascade.32,35 We observed that mtDNA-reduced MCF10A and MCF7 cells have more than threefold increased IGF1R (Figures 5b and c, top panels). We reported that Akt1 is transcriptionally activated and expressed at a higher steady-state level in response to mitochondrial retrograde signaling.35 Notably, Akt1 kinase is an important driver of the EMT process.36 MtDNA-reduced MCF10A cells had fivefold-higher induction of Akt, whereas MCF7 cells had only a modest increase in Akt levels (1.5-fold). This modest increase over control in the latter cell type is not surprising, as MCF7 cells are carcinoma cells with higher endogenous Akt levels. We also observed higher phospho-Akt (Ser 473) levels in mtDNA-reduced cells, indicating activation of Akt kinase in these cells (Figures 5b and c). Notably, the IGF1R and Akt levels in reverted MCF10A and MCF7 cells are markedly lower than mtDNA-reduced cells. To assess the functional relevance of higher IGF1R expression in mtDNA-reduced cells, we treated parental and mtDNA-reduced cells with a specific IGF1R inhibitor picropodophyllin. Inhibition of the IGF1 receptor resulted in a significant increase in cellular apoptosis in mtDNA-reduced MCF10A and MCF7 cells without any noticeable effect in parental cells (Figures 5d and e), suggesting that the IGF1R is essential for survival of mtDNA-reduced cells. These results indicate that the key propagators of mitochondrial retrograde signaling pathway, Cn-IGF1R-Akt, are activated in mtDNA-reduced MCF10A and MCF7 cells.
Mitochondrial retrograde signaling induces nuclear genes involved in EMT
We further ascertained the causal role of mitochondrial retrograde signaling in EMT by analyzing marker gene expression in MCF10A and MCF7 cells. Reduction in mtDNA content in MCF10A cells caused a 2–4-fold increase in transcription factors, Snail, Slug and Twist, whereas mtDNA-reduced MCF7 cells showed 5–20–fold-higher mRNA levels for these factors, which are known to transcriptionally repress the epithelial cell adhesion marker e-cadherin (Figures 6a and b). In agreement with these results, we observed that mtDNA-reduced MCF10A and MCF7 cells contain low levels of mRNA for epithelial form of e-cadherin but fourfold-higher mRNA for the mesenchymal form of N-Cadherin (Figures 6a and b). In mtDNA-reduced MCF10A and MCF7 cells, we observed 12- and 5-fold upregulation of matrix metalloprotease MMP-9, a key factor involved in breakdown and remodeling of extracellular matrix during loss of cell-basement membrane attachment and extravasation (Figures 6a and b). In addition, the mesenchymal cell-specific extracellular matrix protein fibronectin and intermediate filament protein vimentin were upregulated in mtDNA-reduced MCF10A and MCF7 cells (Figures 6a and b, and Supplementary Figure S6B). Importantly, the gene expression patterns in reverted cells were closer to the parental cells, further supporting a causal role for the low mtDNA copy number in phenotypic transition to mesenchymal state. Notably, reduction of mtDNA content by 20 or 50% had no appreciable effect in induction of EMT genes (Supplementary Figure S7), suggesting that a certain level of mtDNA copy number reduction is necessary for inducing this transition process. We also observed an induction of genes involved in EMT of mtDNA-depleted human lung adenocarcinoma A549 cells (Supplementary Figure S6D).
Figure 6.
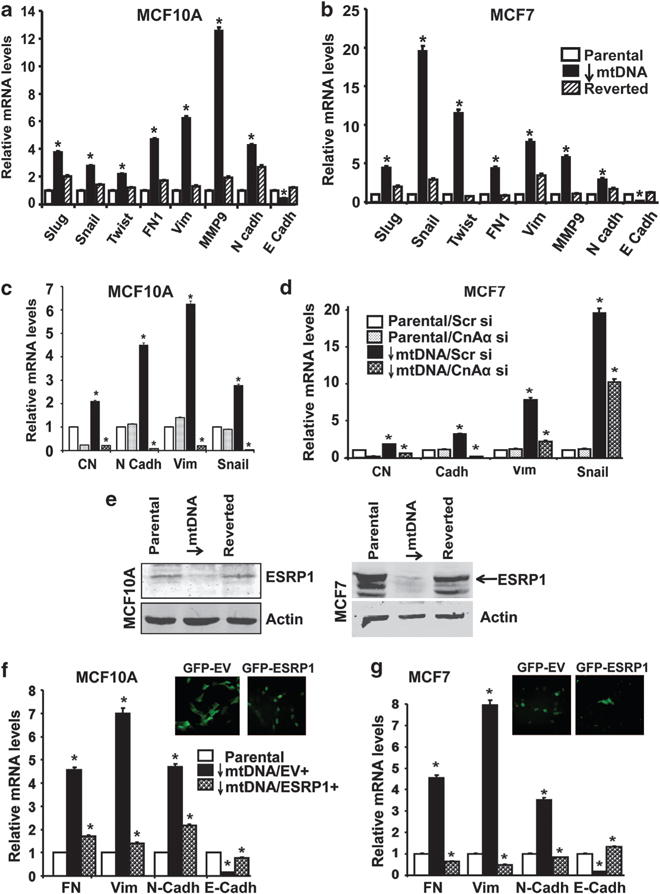
Induction of EMT marker genes in mtDNA-reduced cells. (a, b) Real-time PCR analysis showing the mRNA levels of epithelial and mesenchymal marker genes involved in EMT in parental, mtDNA-reduced and reverted MCF10A (a) and MCF 7 (b) cells. (c, d) Real-Time PCR showing relative mRNA levels of EMT marker genes in parental and mtDNA-reduced MCF10A (c) and MCF7 cells (d) expressing either scrambled siRNA or calcineurin Aa siRNA as indicated. Gapdh was used as endogenous control for normalization. (e) Immunoblot showing ESRP1 expression levels in 50 μg of total extracts from parental, mtDNA-reduced and reverted MCF10A and MCF7 cells. Actin is used as a protein loading control. (f, g, top panel) Immunofluorescence images (× 40 magnification) showing mtDNA-reduced MCF10A cells overexpressing either pMXS-IRES-Puro-EGFP empty vector (GFP-EV) or pMXS-IRES-Puro-Emerald-2xFLAG-ESRP1 (GFP-ESRP1). (f, g, bottom panel) Real-time PCR showing relative mRNA levels (compared with parental cells) of EMT marker genes in mtDNA-reduced MCF10A (f) and MCF7 (g) ectopically expressing either the empty vector or ESRP1. Gapdh was used as endogenous control for normalization.
To ascertain the role of mitochondrial retrograde signaling in EMT, we silenced CnAα (90% mRNA knockdown), which is a key upstream mediator of the retrograde signaling pathway (Figures 6c and d). We observed that silencing CnAα in parental MCF10A and MCF7 cells did not have any significant effect on the levels of mRNAs for N-Cadherin, Vimentin and Snail. This is not surprising, as CnAα is not activated in parental cells, and therefore its mRNA silencing has no effects on the downstream gene expression. In contrast, silencing CnAα in mtDNA-reduced cells resulted in a marked decrease in the levels of all of these key mesenchymal genes, whereas expression of scrambled siRNA had no effect. We therefore conclude that CnAα-mediated mitochondrial retrograde signaling is a driver of the EMT in mtDNA-reduced MCF10A and MCF7 cells.
MtDNA copy number reduction modulates the expression of the splicing regulator ESRP and alternative splicing of EMT genes
It is believed that induction of EMT is regulated by changes in the expression of splicing regulators and alternatively spliced gene products.37 Consequently, the modulation of epithelial-specific splicing regulatory proteins (ESRP), which are expressed only in epithelial cells and downregulated in mesenchymal cells, are important indicators of the EMT process.38,39 MtDNA-reduced MCF7 and MCF10A cells showed loss of ESRP1 expression, indicative of their mesenchymal state (Figure 6e). However, we did not observe any difference in the levels of expression of the ESRP2 isoform (data not shown). Finally, ESRP1 expression in reverted cells was similar to that in parental cells, confirming the role of retrograde signaling in the altered expression of this gene.
To ascertain the contribution of the altered expression of ESRP1 in the mesenchymal transition of mtDNA-reduced cells, we ectopically overexpressed EGFP-ESRP1 in mtDNA-reduced MCF10A and MCF7 cells. ESRP1 overexpression was confirmed by the nuclear GFP (green fluorescent protein) signal in EGFP-ESRP1-expressing cells, in contrast to the cytosolic GFP signal in cells expressing the EGFP empty vector (negative control) (Figures 6f and g top panels and Supplementary Figures S8A and B). We observed a reversal of expression of mesenchymal markers fibronectin, vimentin and N-cadherin with a corresponding increase in the epithelial marker E-cadherin. These results suggest that the mesenchymal phenotype in mtDNA-reduced cells is conferred, at least in part, by reduced ESRP1 expression, possibly by altering the splicing patterns of target genes.
ESRP1 modulates the expression of a wide array of genes involved in EMT progression by acting both as a negative and positive splicing regulator.40 We analyzed the splicing patterns of OSBPL3, ENAH and SLK, which are involved in EMT progression and are known ESRP1 exon-inclusion targets (Supplementary Figure S8C). We observed changes in expression of alternatively spliced isoforms of the three genes in mtDNA-reduced MCF10A cells compared with the parental cells, confirming the role of ESRP1 in EMT.
Induction of retrograde signaling by shRNA-mediated depletion of TFAM
To ascertain the pathophysiological significance of our findings with EtBr-mediated mtDNA depletion and its effect on EMT, we used a more pathophysiologically relevant approach of modulating mtDNA copy number by shRNA-mediated silencing of TFAM (Figure 7). In both MCF10A and MCF7 cells, Tfam mRNA was silenced to ~90% by expressing specific Tfam shRNA compared with parental cells expressing GFP shRNA as a negative control (Figures 7a and f). As TFAM is critical for mtDNA packaging and maintainence,41 silencing this factor resulted in a 70–85% decrease in mtDNA content in both cell types (Figures 7b and g). Similar to EtBr-treated mtDNA-reduced cells, we observed that Tfam-silenced MCF10A cells had aberrant mitochondrial morphology with a markedly reduced mitochondrial network (Figure 7c). Moreover, Tfam-silenced mtDNA-reduced MCF10A and MCF7 cells had significantly lower maximal respiratory capacity compared with the parental cells (Figure 7d). The dysfunctional state of mitochondria in Tfam-silenced cells was further confirmed by growing cells in the presence of galactose, a non-fermentable carbon source. We observed that Tfam-silenced cells have a higher dependence on glucose, as the carbon source and only a small percentage of cells survived in the presence of galactose (Supplementary Figure S9). The key mediator of retrograde signaling, CnAα mRNA, was increased by 2- to 2.5-fold in Tfam-silenced MCF10A and MCF7 cells (Figures 7a and f). The CnAα activity was induced by threefold in Tfam-silenced MCF10A cells compared with cells expressing GFP shRNA (Figure 7b).
Figure 7.

Induction of mitochondrial stress and EMT in TFAM-silenced cells. (a, f) Real-time PCR showing relative mRNA levels of TFAM and calcineurin Aα in MCF10A (a, left panel) and MCF7 (f) cells expressing shRNA against either GFP (negative control) or TFAM. (a, right panel) CnA activity in Tfam-silenced MCF10A cells relative to GFPsh MCF10A cells. (b, g) MtDNA content of MCF10A (b) and MCF7 (g) cells expressing TFAM shRNA compared with the negative control cells expressing GFP shRNA. (c) Mitochondrial staining of MCF10A cells using CcO IVi1 antibody, and nuclei are stained with DAPI. (d) Cellular respiration indicated as the OCR of parental (GFP shRNA), Tfam-silenced MCF7 and MCF10A cells measured by Seahorse XF24 analyzer using 50 000 cells in each type. (e) Bright-field images (× 40 magnification) of MCF10A cells expressing shRNA against GFP or TFAM showing fibroblast-like morphology in TFAM shRNA-expressing cells. (h, i) Real-time PCR analysis showing relative mRNA levels (compared with parental cells) of EMT marker genes in TFAM shRNA-expressing MCF10A (h) and MCF7 (i) cells. Gapdh was used as endogenous control for normalization.
Tfam-silenced cells acquired a fibroblast-like spindle-shaped morphology, whereas those expressing GFP shRNA maintained their characteristic epithelial features (Figure 7e). In addition, in Tfam-silenced cells, the mesenchymal markers Vimentin and N-cadherin are markedly induced with a corresponding loss of E-cadherin, indicative of EMT in these cells (Figures 7h and i). Similar to EtBr-treated mtDNA-reduced cells, Tfam-silenced cells were also dependent on IGF1 receptor activation, and inhibition of IGF1 receptor using picropodophyllin resulted in a marked increase in apoptosis in these cells (Figures 5d and e). These results demonstrate that a reduction in mtDNA copy number by Tfam silencing induces a retrograde signaling and EMT similar to EtBr-treated mammary epithelial cells.
DISCUSSION
Numerous studies support a role for mtDNA defects in a wide range of human cancers. Reduction in mtDNA copy number by increase in ratios of mutant:wild-type mtDNA owing to time-dependent accumulation of mutant DNA or reduction of mtDNA copy number owing to defective replication are hallmarks of age-related diseases. The latter has been shown to be a result of mutations in mtDNA polymerase gamma, the mtDNA helicase TWINKLE and defective TFAM.4,14,42
We demonstrate here that reducing mtDNA copy number below 70–80% either by EtBr treatment or by silencing TFAM induces cellular reprogramming resembling EMT in human mammary epithelial cells. The changes include morphological, metabolic and genetic changes that increase the metastatic potential of tumorigenic MCF7 cells. Interestingly, mtDNA reduction induces tumorigenic markers and promotes EMT in benign MCF10A cells. This is the first mechanistic report establishing the causal role of mitochondrial retrograde signaling involving Cn activation in transforming human mammary epithelial cells to highly invasive phenotype by inducing mesenchymal genes favoring EMT. EMT is a critical process for breast cancer progression and metastasis, as it enables epithelial cells to invade and metastasize. Self-renewal ability, similar to stem cells, is a hallmark of these metastasizing tumor cells.20,28 A key finding here is that low mtDNA copy number generates breast cancer stem cells, which reportedly contribute to high rates of metastases.
We and others have reported that mitochondrial dysfunction, owing to mtDNA depletion (70–80% reduction in mtDNA copy number) and disruption of membrane potential, initiates a Ca2+/Cn-mediated mitochondrial retrograde signaling pathway that modulates Ca2+-sensitive transcription factors and alters nuclear gene expression.5–7,14,17,33,34,43,44 Prior reports suggest that mitochondrial dysfunction can be a contributor in tumor induction.5,6,10,19,45–49 This study supports a role for mitochondrial retrograde signaling in driving multiple stages of tumorigenesis, from initiation to progression through EMT (Figure 8). Notably, using two different mitochondria-specific antioxidants, MitoQ and MitoCP, we confirmed that there was no significant mitochondrial reactive oxygen species produced in cells with reduced mtDNA content, suggesting that the retrograde signaling in these cells is not mediated by reactive free radicals (Supplementary Figure S2B).
Figure 8.
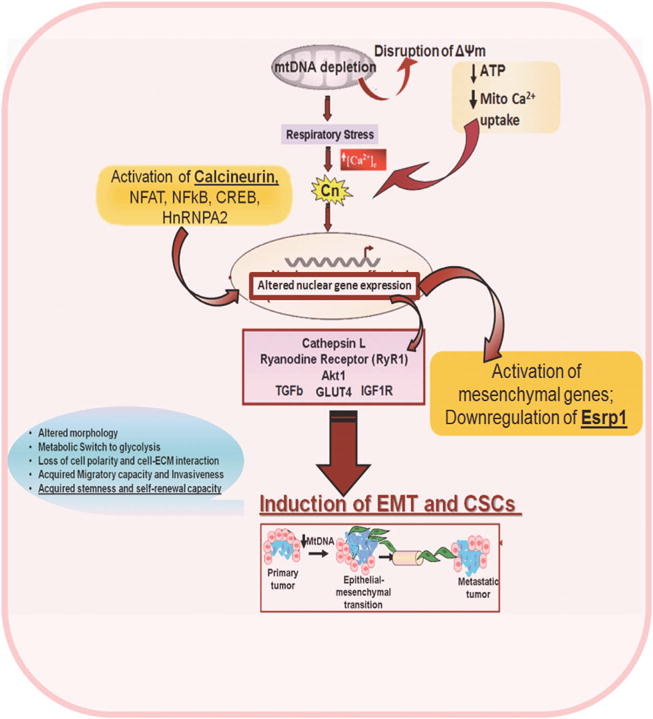
Schematic outline showing that mtDNA copy number reduction in mammary epithelial cells activates Ca2+/Calcineurin-mediated retrograde signaling, which leads to transcriptional activation of mesenchymal genes and induction of epithelial–mesenchymal transition.
EMT can be induced by a wide range of cellular signals involving many different pathways. A number of nuclear transcription factors such as Snail, Twist, Slug, FoxC1, TGFβ and Zeb have been reported to act as EMT inducers and metastasis promoters.50 Despite our current knowledge of a number of nuclear transcription factors and cell adhesion proteins involved in this transition, the mechanisms driving induction of the EMT are not completely understood. The present study indicates that mitochondrial retrograde signaling causes an upregulation of some of the hallmark EMT-inducing signature factors, such as Snail, Slug and Twist, along with mesenchymal markers N-cadherin, matrix metalloprotease MMP-9, fibronectin and vimentin. This is also the first report showing that mitochondrial retrograde signaling is a modulator of epithelial splicing regulatory protein (ESRP)-1 expression, which regulates the alternative splicing of a wide array of gene sets involved in inducing EMT.39 In addition, we show here that mitochondrial retrograde signaling in human mammary epithelial cells induces Akt kinase, which is reported to control EMT-specific alternative splicing events by phosphorylating Serine/Arginine-rich splicing regulator SRSF1.51 Together, our results suggest that mitochondrial retrograde signaling is an upstream effector of EMT, possibly by regulating the expression of nuclear genes involved in cellular reprogramming.
We also demonstrate here that reduced mtDNA copy number and resultant Cn-mediated mitochondrial retrograde signaling have a causal role in driving EMT in human mammary epithelial cancer cells (Figure 8). Our result showing induction of EMT in mtDNA-reduced MCF10A and MCF7 cells is significant in view of reports showing that 63–80% of breast cancer patients exhibit low mtDNA copy number and 30% of patients carry somatic mutations in mtDNA D-Loop regions.16,49,52 Furthermore, breast cancer cell lines lacking mtDNA (rho zero) showed decreased sensitivity to chemotherapeutic drugs such as doxorubicin, vincristine and paclitaxel, suggesting that low mtDNA content is a possible contributor to the poor prognosis of breast cancer patients.53 Together, our results suggest that mtDNA copy number could be a useful prognostic marker, and mitochondrial stress-specific EMT marker genes may represent useful therapeutic targets for the treatment of metastatic breast cancer.
MATERIALS AND METHODS
Cell culture
MCF7 cells were grown in Eagle’s Minimum Essential Medium containing 10% FBS, 0.1% penicillin/streptomycin and 0.01 mg/ml insulin. MCF10A cells were grown in DMEM/F12 (1:1) containing 10% FBS, 0.1% 20 ng/ml EGF, 10 μg/ml insulin, 100 μg/ml hydrocortisone and 10 ng/ml cholera toxin. MtDNA content was reduced (relative to the nuclear DNA) type by EtBr treatment (50 ng/ml) for five passages and cells were grown in the presence of 1 mM sodium pyruvate and 50 μg/ml uridine. MtDNA content measured by Real-Time PCR using specific primers for mtDNA coded Cytochrome Oxidase I and nuclear DNA coded either Cytochrome Oxidase IV gene or GAPDH gene. Three-dimensional cultures of MCF10A and MCF7 cells were grown in 2% growth factor-reduced Matrigel, as described earlier.26 Details of staining procedures for the 3D MCF10A colonies are provided in the Supplementary Materials. For self-renewal assays, MCF10A and MCF7 cells were grown in low-attachment dishes (Corning, Tewksbury, MA, USA) in serum-free growth medium, as described earlier.54 Details on the gene manipulation experiments are presented in the Supplementary methods. For assessing the role of IGF1R, cells were treated with IGF1 receptor-specific inhibitor picropodophyllin (2.5 μM, 2 h), and cell viability was measured using Guava Viacount (Millipore, Billerica, MA, USA) as per the manufacturer’s protocol.
Cellular respiration
Oxygen consumption and extracellular rate of acidification was carried out in a XF24 Seahorse Analyzer (Seahorse Bioscience) using 5 × 10⁴ cells. Oligomycin (2 μg/ml), DNP (75 μM) and Rotenone (1 μM) were added sequentially as indicated in the figures.
Migration (scratch-wound healing) assay
Confluent monolayer of cells were scratched using a pipette tip, and cells migrating into this area were observed at 5-min intervals for 20 h under an inverted bright-field microscope. Still images were extracted at 0, 10 and 20-h time points. For quantitative analysis, individual cells were tracked and their direction of movement, velocity and distance covered in the direction of the wound were measured using Volocity software (Perkin Elmer, Waltham, MA, USA).
Matrigel invasion assay
In vitro invasion assays were carried out as described previously.33,35 Cells (5 × 10⁴) were suspended in 500 μl of growth medium and seeded on top of the Matrigel layer. After 24 h, invasive cells were stained with hematoxylin and eosin and observed with bright-field microscopy.
Pulmonary metastasis assay
The ex vivo evaluation of parental, mtDNA-reduced and reverted MCF10A and MCF7 cells in mouse whole lung cultures was carried out using the (PuMA) as previously described and summarized in the Supplementary Methods.31
Calcineurin activity
Cn activity was measured using a Cn activity assay kit (Enzo Life sciences, Farmingdale, NY, USA) according to the manufacturer’s instructions. Briefly, total phosphatase activity in 5 μg of cell lysates prepared from parental, mtDNA-reduced and reverted MCF10A and MCF7 cells was measured by incubating with Cn-specific RII phosphopeptide substrate in the presence or absence of EGTA. Free phosphate released was measured using malachite green. Phosphatase activity measured in the presence of EGTA was subtracted from total activity to obtain Cn-specific phosphatase activity.
Flow cytometry analysis
CD44 and CD24 expression levels in all cell types were quantified by flow cytometry. Non-confluent cells were trypsinized into single-cell suspensions, counted and washed with phosphate-buffered saline. Cells were stained for 15 min at room temperature using CD24-PE and CD44-APC antibodies (BD Biosciences, San Jose, CA, USA) and counted on a BD FACScalibur. Gating during analysis was set with unstained cells.
Statistical analysis
All assays were carried out in triplicate from three independent experiments. Statistical analysis was carried out using Student’s t-test. P value≤0.001 (indicated as *) was considered highly significant.
Supplementary Material
Acknowledgments
This research was supported by NIH grant CA-22762 and an Endowment from the Harriet Ellison Woodward Trust to NGA. We thank Benjamin Cieply (Carstens laboratory) for providing reagents for the ESRP1 experiments; Drs Brett Kaufman and Jill Kolesar (Kaufman lab) for providing TFAM shRNA constructs; Dr Joseph Baur for the GFP shRNA plasmid; Dr Mauricio Reginato and members of his laboratory for sharing protocols and reagents for immunostaining of the MCF10A 3D spheres; and Drs Christopher Lengner and Qihong Huang for valuable comments on the manuscript. We thank Dr Leslie King for critical comments and editorial help.
ABBREVIATIONS
- mtDNA
mitochondrial DNA
- EMT
epithelial-to-mesenchymal transition
- EtBr
ethidium bromide
- Cn
calcineurin
- ESRP1
epithelial splicing regulatory protein 1
- TFAM
mitochondrial transcription factor A
Footnotes
CONFLICT OF INTEREST
The authors declare no conflict of interest.
AUTHOR CONTRIBUTIONS
MG and NGA designed research and wrote the paper; MG, SS and AK performed the research; GR assisted with imaging studies; MG, AM and CK designed and performed the PuMA experiments; TVM analyzed the histology slides.
Supplementary Information accompanies this paper on the Oncogene website (http://www.nature.com/onc)
References
- 1.Attardi G, Schatz G. Biogenesis of mitochondria. Annu Rev Cell Biol. 1988;4:289–333. doi: 10.1146/annurev.cb.04.110188.001445. [DOI] [PubMed] [Google Scholar]
- 2.Ryan MT, Hoogenraad NJ. Mitochondrial-nuclear communications. Annu Rev Biochem. 2007;76:701–722. doi: 10.1146/annurev.biochem.76.052305.091720. [DOI] [PubMed] [Google Scholar]
- 3.Greaves LC, Reeve AK, Taylor RW, Turnbull DM. Mitochondrial DNA and disease. J Pathol. 2012;226:274–286. doi: 10.1002/path.3028. [DOI] [PubMed] [Google Scholar]
- 4.Kujoth GC, Hiona A, Pugh TD, Someya S, Panzer K, Wohlgemuth SE, et al. Mitochondrial DNA mutations, oxidative stress, and apoptosis in mammalian aging. Science. 2005;309:481–484. doi: 10.1126/science.1112125. [DOI] [PubMed] [Google Scholar]
- 5.Amuthan G, Biswas G, Ananadatheerthavarada HK, Vijayasarathy C, Shephard HM, Avadhani NG. Mitochondrial stress-induced calcium signaling, phenotypic changes and invasive behavior in human lung carcinoma A549 cells. Oncogene. 2002;21:7839–7849. doi: 10.1038/sj.onc.1205983. [DOI] [PubMed] [Google Scholar]
- 6.Biswas G, Adebanjo OA, Freedman BD, Anandatheerthavarada HK, Vijayasarathy C, Zaidi M, et al. Retrograde Ca2 + signaling in C2C12 skeletal myocytes in response to mitochondrial genetic and metabolic stress: a novel mode of inter-organelle crosstalk. EMBO J. 1999;18:522–533. doi: 10.1093/emboj/18.3.522. [DOI] [PMC free article] [PubMed] [Google Scholar]
- 7.Wallace DC. Mitochondria and cancer. Nat Rev Cancer. 2012;12:685–698. doi: 10.1038/nrc3365. [DOI] [PMC free article] [PubMed] [Google Scholar]
- 8.Coller HA, Khrapko K, Bodyak ND, Nekhaeva E, Herrero-Jimenez P, Thilly WG. High frequency of homoplasmic mitochondrial DNA mutations in human tumors can be explained without selection. Nat Genet. 2001;28:147–150. doi: 10.1038/88859. [DOI] [PubMed] [Google Scholar]
- 9.Ishikawa K, Takenaga K, Akimoto M, Koshikawa N, Yamaguchi A, Imanishi H, et al. ROS-generating mitochondrial DNA mutations can regulate tumor cell metastasis. Science. 2008;320:661–664. doi: 10.1126/science.1156906. [DOI] [PubMed] [Google Scholar]
- 10.Lee HC, Yin PH, Lin JC, Wu CC, Chen CY, Wu CW, et al. Mitochondrial genome instability and mtDNA depletion in human cancers. Ann N Y Acad Sci. 2005;1042:109–122. doi: 10.1196/annals.1338.011. [DOI] [PubMed] [Google Scholar]
- 11.Fan W, Lin CS, Potluri P, Procaccio V, Wallace DC. mtDNA lineage analysis of mouse L-cell lines reveals the accumulation of multiple mtDNA mutants and intermolecular recombination. Genes Dev. 2012;26:384–394. doi: 10.1101/gad.175802.111. [DOI] [PMC free article] [PubMed] [Google Scholar]
- 12.Petros JA, Baumann AK, Ruiz-Pesini E, Amin MB, Sun CQ, Hall J, et al. mtDNA mutations increase tumorigenicity in prostate cancer. Proc Natl Acad Sci USA. 2005;102:719–724. doi: 10.1073/pnas.0408894102. [DOI] [PMC free article] [PubMed] [Google Scholar]
- 13.Shidara Y, Yamagata K, Kanamori T, Nakano K, Kwong JQ, Manfredi G, et al. Positive contribution of pathogenic mutations in the mitochondrial genome to the promotion of cancer by prevention from apoptosis. Cancer Res. 2005;65:1655–1663. doi: 10.1158/0008-5472.CAN-04-2012. [DOI] [PubMed] [Google Scholar]
- 14.Correia RL, Oba-Shinjo SM, Uno M, Huang N, Marie SK. Mitochondrial DNA depletion and its correlation with TFAM, TFB1M, TFB2M and POLG in human diffusely infiltrating astrocytomas. Mitochondrion. 2011;11:48–53. doi: 10.1016/j.mito.2010.07.001. [DOI] [PubMed] [Google Scholar]
- 15.Horton TM, Petros JA, Heddi A, Shoffner J, Kaufman AE, Graham SD, Jr, et al. Novel mitochondrial DNA deletion found in a renal cell carcinoma. Genes Chromosomes Cancer. 1996;15:95–101. doi: 10.1002/(SICI)1098-2264(199602)15:2<95::AID-GCC3>3.0.CO;2-Z. [DOI] [PubMed] [Google Scholar]
- 16.Tseng LM, Yin PH, Chi CW, Hsu CY, Wu CW, Lee LM, et al. Mitochondrial DNA mutations and mitochondrial DNA depletion in breast cancer. Genes Chromosomes Cancer. 2006;45:629–638. doi: 10.1002/gcc.20326. [DOI] [PubMed] [Google Scholar]
- 17.Guo J, Zheng L, Liu W, Wang X, Wang Z, Wang Z, et al. Frequent truncating mutation of TFAM induces mitochondrial DNA depletion and apoptotic resistance in microsatellite-unstable colorectal cancer. Cancer Res. 2011;71:2978–2987. doi: 10.1158/0008-5472.CAN-10-3482. [DOI] [PMC free article] [PubMed] [Google Scholar]
- 18.Moro L, Arbini AA, Yao JL, di Sant’Agnese PA, Marra E, Greco M. Mitochondrial DNA depletion in prostate epithelial cells promotes anoikis resistance and invasion through activation of PI3K/Akt2. Cell Death Differ. 2009;16:571–583. doi: 10.1038/cdd.2008.178. [DOI] [PubMed] [Google Scholar]
- 19.Woo DK, Green PD, Santos JH, D’Souza AD, Walther Z, Martin WD, et al. Mitochondrial genome instability and ROS enhance intestinal tumorigenesis in APC(Min/+) mice. Am J Pathol. 2012;180:24–31. doi: 10.1016/j.ajpath.2011.10.003. [DOI] [PMC free article] [PubMed] [Google Scholar]
- 20.Polyak K, Weinberg RA. Transitions between epithelial and mesenchymal states: acquisition of malignant and stem cell traits. Nat Rev Cancer. 2009;9:265–273. doi: 10.1038/nrc2620. [DOI] [PubMed] [Google Scholar]
- 21.Thiery JP, Acloque H, Huang RY, Nieto MA. Epithelial-mesenchymal transitions in development and disease. Cell. 2009;139:871–890. doi: 10.1016/j.cell.2009.11.007. [DOI] [PubMed] [Google Scholar]
- 22.Schonberg MA, Marcantonio ER, Li D, Silliman RA, Ngo L, McCarthy EP. Breast cancer among the oldest old: tumor characteristics, treatment choices, and survival. J Clin Oncol. 2010;28:2038–2045. doi: 10.1200/JCO.2009.25.9796. [DOI] [PMC free article] [PubMed] [Google Scholar]
- 23.Imanishi H, Hattori K, Wada R, Ishikawa K, Fukuda S, Takenaga K, et al. Mitochondrial DNA mutations regulate metastasis of human breast cancer cells. PLoS One. 2011;6:e23401. doi: 10.1371/journal.pone.0023401. [DOI] [PMC free article] [PubMed] [Google Scholar]
- 24.Horwitz HB, Holt CE. Specific inhibition by ethidium bromide of mitochondrial DNA synthesis in physarum polycephalum. J Cell Biol. 1971;49:546–553. doi: 10.1083/jcb.49.2.546. [DOI] [PMC free article] [PubMed] [Google Scholar]
- 25.King MP, Attardi G. Human cells lacking mtDNA: repopulation with exogenous mitochondria by complementation. Science. 1989;246:500–503. doi: 10.1126/science.2814477. [DOI] [PubMed] [Google Scholar]
- 26.Debnath J, Muthuswamy SK, Brugge JS. Morphogenesis and oncogenesis of MCF-10A mammary epithelial acini grown in three-dimensional basement membrane cultures. Methods. 2003;30:256–268. doi: 10.1016/s1046-2023(03)00032-x. [DOI] [PubMed] [Google Scholar]
- 27.Lee GY, Kenny PA, Lee EH, Bissell MJ. Three-dimensional culture models of normal and malignant breast epithelial cells. Nat Methods. 2007;4:359–365. doi: 10.1038/nmeth1015. [DOI] [PMC free article] [PubMed] [Google Scholar]
- 28.Mani SA, Guo W, Liao MJ, Eaton EN, Ayyanan A, Zhou AY, et al. The epithelial-mesenchymal transition generates cells with properties of stem cells. Cell. 2008;133:704–715. doi: 10.1016/j.cell.2008.03.027. [DOI] [PMC free article] [PubMed] [Google Scholar]
- 29.Bae SN, Arand G, Azzam H, Pavasant P, Torri J, Frandsen TL, et al. Molecular and cellular analysis of basement membrane invasion by human breast cancer cells in Matrigel-based in vitro assays. Breast Cancer Res Treat. 1993;24:241–255. doi: 10.1007/BF01833264. [DOI] [PubMed] [Google Scholar]
- 30.Gumireddy K, Sun F, Klein-Szanto AJ, Gibbins JM, Gimotty PA, Saunders AJ, et al. In vivo selection for metastasis promoting genes in the mouse. Proc Natl Acad Sci USA. 2007;104:6696–6701. doi: 10.1073/pnas.0701145104. [DOI] [PMC free article] [PubMed] [Google Scholar]
- 31.Mendoza A, Hong SH, Osborne T, Khan MA, Campbell K, Briggs J, et al. Modeling metastasis biology and therapy in real time in the mouse lung. J Clin Invest. 2010;120:2979–2988. doi: 10.1172/JCI40252. [DOI] [PMC free article] [PubMed] [Google Scholar]
- 32.Guha M, Srinivasan S, Biswas G, Avadhani NG. Activation of a novel calcineurin-mediated insulin-like growth factor-1 receptor pathway, altered metabolism, and tumor cell invasion in cells subjected to mitochondrial respiratory stress. J Biol Chem. 2007;282:14536–14546. doi: 10.1074/jbc.M611693200. [DOI] [PMC free article] [PubMed] [Google Scholar]
- 33.Guha M, Pan H, Fang JK, Avadhani NG. Heterogeneous nuclear ribonucleoprotein A2 is a common transcriptional coactivator in the nuclear transcription response to mitochondrial respiratory stress. Mol Biol Cell. 2009;20:4107–4119. doi: 10.1091/mbc.E09-04-0296. [DOI] [PMC free article] [PubMed] [Google Scholar]
- 34.Butow RA, Avadhani NG. Mitochondrial signaling: the retrograde response. Mol Cell. 2004;14:1–15. doi: 10.1016/s1097-2765(04)00179-0. [DOI] [PubMed] [Google Scholar]
- 35.Guha M, Fang JK, Monks R, Birnbaum MJ, Avadhani NG. Activation of Akt is essential for the propagation of mitochondrial respiratory stress signaling and activation of the transcriptional coactivator heterogeneous ribonucleoprotein A2. Mol Biol Cell. 2010;21:3578–3589. doi: 10.1091/mbc.E10-03-0192. [DOI] [PMC free article] [PubMed] [Google Scholar]
- 36.Larue L, Bellacosa A. Epithelial-mesenchymal transition in development and cancer: role of phosphatidylinositol 3′ kinase/AKT pathways. Oncogene. 2005;24:7443–7454. doi: 10.1038/sj.onc.1209091. [DOI] [PubMed] [Google Scholar]
- 37.Shapiro IM, Cheng AW, Flytzanis NC, Balsamo M, Condeelis JS, Oktay MH, et al. An EMT-driven alternative splicing program occurs in human breast cancer and modulates cellular phenotype. PLoS Genet. 2011;7:e1002218. doi: 10.1371/journal.pgen.1002218. [DOI] [PMC free article] [PubMed] [Google Scholar]
- 38.Warzecha CC, Sato TK, Nabet B, Hogenesch JB, Carstens RP. ESRP1 and ESRP2 are epithelial cell-type-specific regulators of FGFR2 splicing. Mol Cell. 2009;33:591–601. doi: 10.1016/j.molcel.2009.01.025. [DOI] [PMC free article] [PubMed] [Google Scholar]
- 39.Warzecha CC, Jiang P, Amirikian K, Dittmar KA, Lu H, Shen S, et al. An ESRP-regulated splicing programme is abrogated during the epithelial-mesenchymal transition. EMBO J. 2010;29:3286–3300. doi: 10.1038/emboj.2010.195. [DOI] [PMC free article] [PubMed] [Google Scholar]
- 40.Warzecha CC, Shen S, Xing Y, Carstens RP. The epithelial splicing factors ESRP1 and ESRP2 positively and negatively regulate diverse types of alternative splicing events. RNA Biol. 2009;6:546–562. doi: 10.4161/rna.6.5.9606. [DOI] [PMC free article] [PubMed] [Google Scholar]
- 41.Campbell CT, Kolesar JE, Kaufman BA. Mitochondrial transcription factor A regulates mitochondrial transcription initiation, DNA packaging, and genome copy number. Biochim Biophys Acta. 2012;1819:921–929. doi: 10.1016/j.bbagrm.2012.03.002. [DOI] [PubMed] [Google Scholar]
- 42.Sarzi E, Goffart S, Serre V, Chretien D, Slama A, Munnich A, et al. Twinkle helicase (PEO1) gene mutation causes mitochondrial DNA depletion. Ann Neurol. 2007;62:579–587. doi: 10.1002/ana.21207. [DOI] [PubMed] [Google Scholar]
- 43.Biswas G, Anandatheerthavarada HK, Avadhani NG. Mechanism of mitochondrial stress-induced resistance to apoptosis in mitochondrial DNA-depleted C2C12 myocytes. Cell Death Differ. 2005;12:266–278. doi: 10.1038/sj.cdd.4401553. [DOI] [PubMed] [Google Scholar]
- 44.Guha M, Tang W, Sondheimer N, Avadhani NG. Role of calcineurin, hnRNPA2 and Akt in mitochondrial respiratory stress-mediated transcription activation of nuclear gene targets. Biochim Biophys Acta. 2010;1797:1055–1065. doi: 10.1016/j.bbabio.2010.02.008. [DOI] [PMC free article] [PubMed] [Google Scholar]
- 45.Kulawiec M, Safina A, Desouki MM, Still I, Matsui S, Bakin A, et al. Tumorigenic transformation of human breast epithelial cells induced by mitochondrial DNA depletion. Cancer Biol Ther. 2008;7:1732–1743. doi: 10.4161/cbt.7.11.6729. [DOI] [PMC free article] [PubMed] [Google Scholar]
- 46.Magda D, Lecane P, Prescott J, Thiemann P, Ma X, Dranchak PK, et al. mtDNA depletion confers specific gene expression profiles in human cells grown in culture and in xenograft. BMC Genomics. 2008;9:521. doi: 10.1186/1471-2164-9-521. [DOI] [PMC free article] [PubMed] [Google Scholar]
- 47.Naito A, Cook CC, Mizumachi T, Wang M, Xie CH, Evans TT, et al. Progressive tumor features accompany epithelial-mesenchymal transition induced in mitochondrial DNA-depleted cells. Cancer Sci. 2008;99:1584–1588. doi: 10.1111/j.1349-7006.2008.00879.x. [DOI] [PMC free article] [PubMed] [Google Scholar]
- 48.Tang W, Chowdhury AR, Guha M, Huang L, Van WT, Rustgi AK, et al. Silencing of IkBbeta mRNA causes disruption of mitochondrial retrograde signaling and suppression of tumor growth in vivo. Carcinogenesis. 2012;33:1762–1768. doi: 10.1093/carcin/bgs190. [DOI] [PMC free article] [PubMed] [Google Scholar]
- 49.Yu M, Zhou Y, Shi Y, Ning L, Yang Y, Wei X, et al. Reduced mitochondrial DNA copy number is correlated with tumor progression and prognosis in Chinese breast cancer patients. IUBMB Life. 2007;59:450–457. doi: 10.1080/15216540701509955. [DOI] [PubMed] [Google Scholar]
- 50.Moreno-Bueno G, Portillo F, Cano A. Transcriptional regulation of cell polarity in EMT and cancer. Oncogene. 2008;27:6958–6969. doi: 10.1038/onc.2008.346. [DOI] [PubMed] [Google Scholar]
- 51.Blaustein M, Pelisch F, Tanos T, Munoz MJ, Wengier D, Quadrana L, et al. Concerted regulation of nuclear and cytoplasmic activities of SR proteins by AKT. Nat Struct Mol Biol. 2005;12:1037–1044. doi: 10.1038/nsmb1020. [DOI] [PubMed] [Google Scholar]
- 52.Xia P, An HX, Dang CX, Radpour R, Kohler C, Fokas E, et al. Decreased mitochondrial DNA content in blood samples of patients with stage I breast cancer. BMC Cancer. 2009;9:454. doi: 10.1186/1471-2407-9-454. [DOI] [PMC free article] [PubMed] [Google Scholar]
- 53.Yu M, Shi Y, Wei X, Yang Y, Zang F, Niu R. Mitochondrial DNA depletion promotes impaired oxidative status and adaptive resistance to apoptosis in T47D breast cancer cells. Eur J Cancer Prev. 2009;18:445–457. doi: 10.1097/CEJ.0b013e32832f9bd6. [DOI] [PubMed] [Google Scholar]
- 54.Fillmore CM, Kuperwasser C. Human breast cancer cell lines contain stem-like cells that self-renew, give rise to phenotypically diverse progeny and survive chemotherapy. Breast Cancer Res. 2008;10:R25. doi: 10.1186/bcr1982. [DOI] [PMC free article] [PubMed] [Google Scholar]
Associated Data
This section collects any data citations, data availability statements, or supplementary materials included in this article.