

Abstract
The SELEX (Systematic Evolution of Ligands by Exponential Enrichment) process allows for the enrichment of DNA or RNA aptamers from a complex nucleic acid library that are specific for a target molecule. The SELEX process has been adapted from identifying aptamers in vitro using recombinant target protein to cell-based methodologies (Cell-SELEX), where the targets are expressed on the surface of cells. One major advantage of Cell-SELEX is that the target molecules are maintained in a native confirmation. Additionally, Cell-SELEX may be used to discover novel therapeutic biomarkers by performing selections on diseased versus healthy cells. However, a caveat to Cell-SELEX is that testing of single aptamers identified in the selection is laborious, time-consuming, and expensive. The most frequently used methods to screen for aptamer binding and internalization on cells are flow cytometry and quantitative PCR (qPCR). While flow cytometry can directly assess binding of a fluorescently-labeled aptamer to a target, it requires significant starting material and is not easily scalable. qPCR-based approaches are highly sensitive but have non-negligible experiment-to-experiment variability due to the number of sample processing steps. Herein we describe a cell-based aptamer fluorescence binding and internalization (AFBI) assay. This assay requires minimal reagents and has few experimental steps/manipulations, thereby allowing for rapid screening of many aptamers and conditions simultaneously and direct quantitation of aptamer binding and internalization.
Keywords: Aptamer, SELEX, Cell-SELEX, Fluorescence, Microplate reader
1. Introduction
Aptamers are structured single-stranded RNA or DNA oligonucleotides that recognize targets with similar specificity and affinity as antibody-antigen interactions [1,2]. Unlike antibodies, aptamers can be chemically synthesized, allowing for more economical and consistent production. Aptamers are amendable to chemical modifications to improve pharmacodynamics and pharmacokinetics. These modifications and conjugations may include, but are not limited to, modified nucleic acids (e.g. 2′-F, 2′-OMe, LNA) and functional groups to impact bioavailability (e.g. PEG, cholesteryl), therapeutics or diagnostic payloads (e.g. siRNAs, fluorophores). Aptamer development as both a therapeutic moiety and as a diagnostic tool is a rapidly growing field with many aptamers entering the clinical pipeline [3,4].
The discovery process for aptamers involves iterative rounds of positive and negative selection using a process termed SELEX, Systematic Evolution of Ligands by EXponentional enrichment [5,6]. The SELEX aptamer selection process is followed by high-throughput sequencing to identify the enriched aptamer sequences [7,8]. Bioinformatics are commonly used to identify candidate aptamer sequences for empirical validation [7,9–12]. The SELEX process was first developed with recombinant protein, but has been adapted for use with cells in culture [7,13–22]. The key advantage of cell-based SELEX (Cell-SELEX) is in enriching for aptamers that target a cell type and interact with proteins in their native conformation. The Cell- SELEX methodology has been used to identify aptamers specific for a variety of cancer cell types [17–22], red blood cells [13], endothelial cells [14], dendritic cells [16], vascular smooth muscle cells [7] and for a variety of specific cell surface receptor proteins [15–17].
Several rapid and high-throughput methods are available to screen aptamer sequences derived from in vitro selections. These methods include surface plasmon resonance, microfluidic, filter, or chip-based binding assays that may be conducted in large scale and in parallel [23,24]. By contrast, the methods available to test binding and internalization of aptamers identified through Cell-SELEX are much slower with less throughput. Currently used methods include quantitative PCR (qPCR), flow cytometry and fluorescent or confocal microscopy [8,25,26]. While qPCR has exquisite sensitivity, this method requires a large amount of starting material and extensive and time consuming sample processing with multiple steps, which leads to high experiment-to-experiment variability. Furthermore, qPCR is inherently an indirect measure of aptamer binding and internalization. Other methods, such as flow cytometry and fluorescent/confocal microscopy directly observe and measure aptamer interaction with cells, yet these approaches are neither rapid nor high-throughput and lack the sensitivity of qPCR.
We have developed the AFBI assay (Fig. 1A), Aptamer Fluorescence Binding and Internalization assay, to enable rapid and high-throughput testing of aptamers on cells. This method combines the sensitivity of qPCR with the direct measurement of aptamer fluorescence in flow cytometry to quantitate aptamer binding and internalization. Most importantly, this assay requires minimal reagents, requires few processing step and is highly scalable. An AFBI assay experiment may be completed in a single 96-well plate. Our assay is currently optimized for use with 96-well plates, which allows for a greater number of conditions to be tested with more biological replicates per experiment. This methods article details how the AFBI assay may be used to quantitate either aptamer binding (Fig. 1B) or aptamer internalization (Fig. 1C).
Fig. 1.
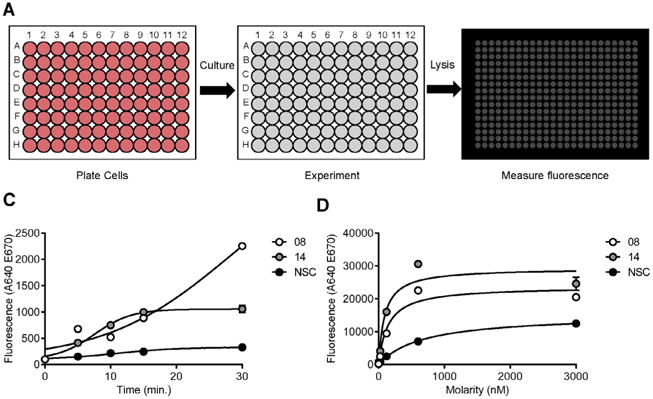
AFBI assay – Aptamer Fluorescence Binding and Internalization assay for cultured cells: A) Schematic of the AFBI assay steps: 1) plating cells, 2) the experiment and 3) measuring aptamer fluorescence. The AFBI assay was used with VSMC-specific aptamers (08 and 14) and control aptamers (NSC) to determine B) an internalization time-course and C) binding affinity with cultured VSMC cells.
2. Equipment, software, reagents and solutions
2.1. Equipment
2.1.1. Microplate plate reader with acquisition software – Synergy Mx, BioTek microplate reader using Gen5 v2.05 acquisition software
2.1.2. Pipettes – Multi-channel: GeneMate 20–200 μL (P-4920-200), GeneMate 5–50 μL (P-4920-50); Single-channel: Gene-Mate 20–200 μL (P-4963-200), GeneMate 2–20 μL(P-4963-20)
2.1.3. 96-well cell culture plates (Costar, 3596)
2.1.4. 384-well fluorescence plates (Thermo Scientific, 264705)
2.1.5. Rocker (Labnet, Rocker 35) in cold room or equivalent
2.1.6. Reservoir (Costar, 4870)
2.1.7. Cutoff spin column (e.g. Amicon 10K, UFC801024)
2.2. Software
2.2.1 Microsoft Excel (version 2010 or later)
2.2.2. GraphPad Prism (version 6.05)
2.3. Reagents
2.3.1. Fluorescently labeled aptamer (Section 3.1) – Experimental aptamer(s) and non-binding/internalizing negative control aptamer
2.3.2. Cells – A7r5 (ATCC, CRL1444)
2.4. Solutions
2.4.1. 10× Binding Buffer – 1.5 M NaCl; 20 mM CaCl2; 200 mM HEPES pH 7.4 in H2O and filter sterilize
2.4.2. Culture media – DMEM (Gibco, 11965-092) with 10% FBS (Atlanta Biologicals, S11550)
2.4.3. PBS (Gibco, 14190-144)
2.4.4. PBS (Gibco, 14190-144) with 0.5 M NaCl
2.4.5. Lysis Buffer – 150 mM NaCl; 10 mM MgCl2; 50 mM Tris HCl pH 9.0; 1% Triton X-100 in H2O
2.4.6. (optional) 10 mg/mL yeast tRNA (Invitrogen, 15401-018) in H2O
3. Methods
3.1. Fluorescently labeled aptamer
Fundamental to using this fluorescent-based methodology is that the aptamer be labeled with a fluorophore. This section covers selecting an appropriate fluorophore, terminal labeling an aptamer with a fluorophore (Fig. 2A) and establishing the lowest range of detection with the fluorescently labeled aptamer.
Fig. 2.
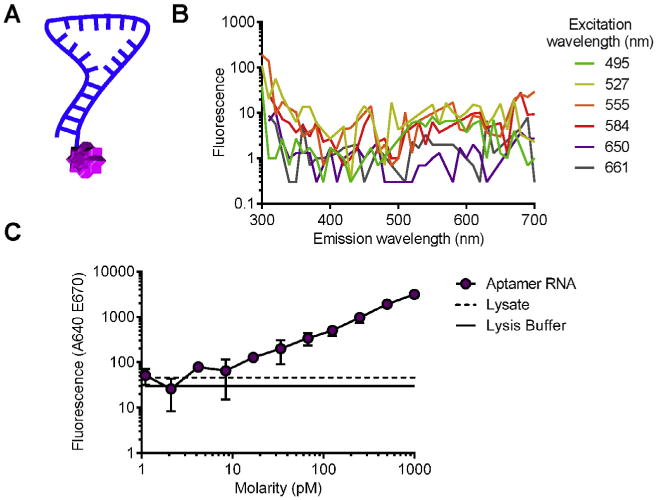
Spectral analysis and minimal detectable aptamer fluorescence: A) Schematic of an aptamer (blue) labeled with a terminal fluorophore (purple) label. B) Spectral analysis of VSMC lysate for multiple excitation wavelengths (495, 527, 555, 594, 650, 661) across a range of emission wavelengths (300–700 nm Δ10 nm). C) The fluorescence of fluorescently labeled aptamer VSMC lysate was measured by a microplate reader and compared to lysate with no aptamer and lysis buffer. These data indicate fluorescently labeled aptamer is detectable at 20 pM.
3.1.1. Spectral analysis to identify optimal fluorophore
A spectral analysis (Fig. 2B) will excite a set of wavelengths and measure the emittance across a range of wavelengths. These data may be used to determine the background fluorescence associated with each excitation wavelength.
3.1.1.1. Generate cell lysate and load 384-well plate
Cultured cells should be collected, washed and counted. Re-pellet the cells and use the appropriate amount of Lysis Buffer (2.4.5) to achieve 500–1000 cells/μL lysate. Load a 384-well plate with 10 μL cell lysate in triplicate. Load 10 μL Lysis Buffer (2.4.5) alone as a background control.
3.1.1.2. Spectral analysis protocol
Open the Gen5 v2.05 microplate reader acquisition software. Select a new protocol and select Nunc 384 flat bottom (Supplemental Fig. 1A) from the dropdown menu. Select “Spectral Scanning” under protocol options (Supplemental Fig. 1B). Select the excitation wavelength(s) (e.g. 405 nm, 458 nm, 488 nm, 514 nm, 561 nm, 633 nm) and select the range of emittance measured at wavelengths 420–720 at ∼ 10 nm intervals (Supplemental Fig. 1C). Place the 384-well plate onto the loading tray of the microplate reader and run the spectral scanning protocol. Export these data from Gen5 acquisition software to Microsoft Excel.
3.1.1.3. Plotting and interpreting spectral analysis data
First average the triplicates and subtract the background fluorescence measured from the Lysis Buffer alone control. For each excitation wavelength dataset, remove data points within ±15–20 nm of the excitation wavelength. Detection of emittance occurs simultaneously with excitation and therefore emittance fluorescence measured near the excitation wavelength is likely due the excitation itself. Plot the measured fluorescence against the emission wavelength for each excitation wavelength (Fig. 2A). Alternatively, only plot data within the wavelengths (±20 nm) where a given fluorophore emits (Table 1). The measured emittance fluorescence represents the background fluorescence associated with excitation wavelength (Fig. 2B). Excitation wavelengths with the lowest fluorescence have the least amount of background fluorescence and optimal fluorophores will excite and emit within this range of wavelengths.
Table 1.
Excitation and emission wavelengths of Alexa fluorophores.
| Fluorophore | Excitation | Emission |
|---|---|---|
| Alexa Fluor 488 | 495 | 517 |
| Alexa Fluor 532 | 527 | 553 |
| Alexa Fluor 546 | 555 | 571 |
| Alexa Fluor 594 | 584 | 616 |
| Alexa Fluor 647 | 650 | 670 |
| Alexa Fluor 660 | 661 | 691 |
3.1.2. Fluorescently labeled aptamer
Efficient labeling of the aptamer with the fluorophore allows for a lower threshold of detection of bound or internalized aptamer. All current methods to fluorescently label aptamer require the aptamer to be chemically synthesized rather than being in vitro enzymatic generated. Chemical synthesis of an aptamer with the fluorophore already conjugated gives the greatest labeling efficiency, but potentially limits synthesis yields and increases cost. Alternatively, an aptamer may be chemically synthesized with a conjugatable chemical group, such as a primary amine (NH2) to enable NHS ester chemistry, which may be used the fluorescently label an aptamer.
3.1.2.1. Chemical synthesis of aptamer
Any aptamer sequence may be chemically synthesized with modified nucleotides. The major limitation of aptamer chemical synthesis is that the efficiency of synthesis decreases with aptamer length, which in turn decreases yield and increases cost. The aptamer sequence needs to be chemically synthesized with either a fluorophore or other conjugatable chemistry (e.g. primary amine) with a carbon linker (e.g. C12). Chemical synthesis of an aptamer with a fluorophore, as compared to a conjugatable chemistry, will likely increase the cost of synthesis due to the cost of the fluorophore itself. Also, the addition of the fluorophore may also decrease yield due to the more complex chemistry. These issues will be dependent on the aptamer sequence and component nucleosides (e.g. DNA, RNA). Several companies offer chemical synthesis of aptamers including TriLink Biotechnologies (San Diego, CA) and Integrated DNA Technologies (Coralville, IA).
3.1.2.2. Labeling aptamer with a fluorophore using NHS ester chemistry
Aptamers chemically synthesized with a primary amine (NH2) may have a fluorophore added using NHS ester chemistry. Most all fluorophores may be acquired with a NHS ester reactive group. These fluorophores will usually have associated protocols for conjugation with amine modified proteins and nucleic acids. A general protocol for conjugating NHS ester compounds to amine modified nucleic acids is available from Thermo Scientific, “Amine-Reactive Probes” [27]. Following NHS ester conjugation of fluorophore to an amine modified aptamer the excess un-conjugated fluorophore should be removed. This may be achieved using a cutoff spin column (2.1.7) of an appropriate cutoff mass to retain the aptamer but pass through the fluorophore. Multiple washes using either water of TE with low EDTA may be necessary to remove all of the excess fluorophore. The concentration of the aptamer should then be determined and the efficiency of the NHS ester chemistry determined by mass spectrometry (Fig. 3A–D). The mass spectrometry will show a shift in mass of un-labeled aptamer with the addition of the fluorophore. The efficiency of labeling may be estimated by calculating and comparing the peaks of labeled material and un-labeled material. Labeling efficiencies may vary between different aptamers. Aptamer(s) labeled with less than 100% efficiency will require a standard curve (3.5.1) to normalize the data.
Fig. 3.
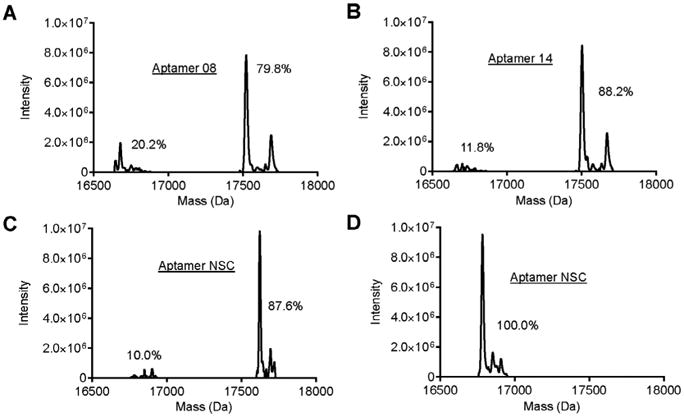
Mass spectrometry of fluorescently labeled aptamer: Mass spectrometry analysis of VSMC-specific aptamer A) 08, B) 14, and C) control aptamer NSC conjugated to an Alexa 647 fluorophore. The Alexa 647 fluorophore was conjugated to each aptamer by NHS ester chemistry. The shift in peaks from ∼16,750 Da to ∼17,750 Da indicates the addition of the Alexa 647 fluorophore to the aptamer. The area of each set of peaks (%) indicates the relative amount of fluorescently-labeled versus unlabeled aptamer and is a measure of the efficiency of the NHS ester chemistry. D) Mass spectrometry of the control aptamer (NSC) not conjugated with the Alexa 647 fluorophore.
3.1.3. Determine the lowest range of detection
Serial dilute (e.g. 1:2 or 1:10) the fluorescently labeled aptamer in cell lysate (3.1.1.1) from nM into low pM or high fM concentrations. Load a 384-well plate (2.1.4) with negative controls that include 10 μL aptamer cell lysate and 10 μL Lysis Buffer alone (2.4.5) in triplicate. Measure the fluorescence with the appropriate excitation and emittance wavelengths for the fluorophore conjugated to the aptamer (Supplemental Fig. 2A–C). Average the triplicates and plot the fluorescently labeled aptamer data against the fluorescence of the negative control cell lysate and lysis buffer alone (Fig. 2C). The lowest threshold of detection is the point just prior to the fluorescently labeled aptamer crossing either the cell lysate alone or lysis buffer alone.
3.2. Plating cells and planning for controls
The appropriate number of cells to give a confluent cell density (80–90%) is ideal with the AFBI assay. This confluency of cells provides a high specific cell-internalization signal while minimizing background due to non-specific interaction of aptamer with apoptotic cells. However, optimal cell density may vary from cell line to cell line and is highly dependent on experimental conditions. Therefore, optimization of cell density may need to be further investigated, which can be accomplished using the AFBI assay. Data obtained from previous experiments on cell plating conditions should be used with the growth area chart (Table 2) to determine the appropriate number of cells to seed for a 96-well plate. We recommend initially plating a range of cell densities in triplicate and observing these cells throughout the time period and experiment conditions that would be conducted. The cells should be observed for morphological changes or detachment during exposure to changes in media and washes. These data will provide confidence in the reproducibility of conditions used with the cells when scaling up the conditions being tested in an experiment.
Table 2.
Growth areas for cell culture plates and flasks.
| Dish/flask/plate | Growth area (cm2) |
|---|---|
| 15 cm dish | 152 |
| 10 cm dish | 55 |
| 6 cm dish | 21 |
| 3.5 cm dish | 9 |
| T75 flask | 75 |
| T25 flask | 25 |
| 6-well plate | 9.5/well |
| 12-well plate | 3.8/well |
| 24-well plate | 1.9/well |
| 48-well plate | 0.95/well |
| 96-well (flat bottom) | 0.32/well |
With each experiment we recommend plating cells with biological replicate of at least 4 for each condition being tested within the experiment (Fig. 4A). Experiments should be planned with appropriate controls that include an aptamer that does not bind/internalize and a cell only with no aptamer as a negative control for background fluorescence.
Fig. 4.
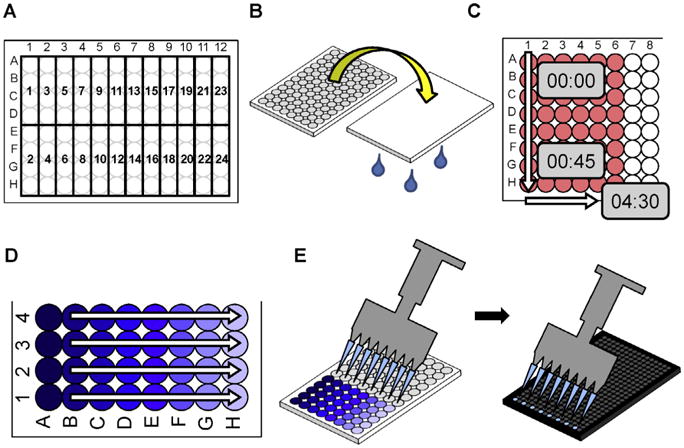
Useful tips for the AFBI assay: A) Plate cells in a 96-well plate in biological replicates of 4. Plating as such allows for 24 conditions to be tested with each 96-well plate. B) Decant a 96-well plate by inverting the plate. C) Determine the pace, using a timer, of working down and across a 96-well plate. Use this pace to determine the maximum number of wells that may be tested within a time point. D) Generate a standard curve of a fluorescent aptamer using a 96-well plate to serial dilute the fluorescent aptamer. E) An eight channel multi-channel pipette may be used to transfer lysate from a 96-well plate to a 384-well plate.
3.3. Fluorescent based binding assay on cells (Fig. 1B)
The AFBI assay allows for the rapid determination of aptamer affinity by measuring the dissociation constant (Kd) on cells. The measurement of aptamer Kd on cells requires equilibrium binding to be established and is therefore conducted at 4 °C to prevent aptamer internalization.
3.3.1. Prepare reagents
All reagents should be prepared prior to the experiment at volumes appropriate for the number of conditions and biological replicates being tested. These volumes should include excess (e.g. +20%) for the reservoir (2.1.6) when using the multi-channel pipette (2.1.2).
3.3.1.1. Cells
Plate and culture cells (2.3.2) in 96-well plates (2.1.3) with a biological replicate of at least 4 for each aptamer concentration (Fig. 4A). The total number of wells should include controls discussed previously under Plating cells and planning for controls section (3.2).
3.3.1.2. Aptamer(s)
Prepare enough fluorescently-labeled aptamer and fluorescently-labeled non-binding negative control aptamer (2.3.1) in 1× Binding Buffer (2.4.1) to allow for 25–50 μL within each well. Aptamer concentration should include a wide enough range to cover both ends of a binding curve (Fig. 1C, pM through nM into low μ.M). Chill on ice.
3.3.1.3. Washing 1× Binding Buffer
Prepare enough 1× Binding Buffer (2.4.1) to allow washing of the cells four times using 200 μL each wash. Chill on ice.
3.3.1.4. Blocking 1× Binding Buffer (optional)
Cells may be blocked with 1× Binding Buffer containing oligonucleotide molecules similar to the aptamer to decrease non-specific binding (e.g. yeast tRNA (2.4.6) may be used as a block with RNA aptamers).
3.3.1.5. Lysis Buffer
Prepare enough Lysis Buffer (2.4.5) to add 15–20 μL to each well with cells. Chill on ice.
3.3.2. Wash cells
Using the multichannel pipette, wash Cells (3.3.1.1) two times with 200 μL Washing 1× Binding Buffer (3.3.1.3). The 1× Binding Buffer may be decanted (Fig. 4B) between washes.
3.3.3. Block cells (optional)
Block cells with 100 μL of the Blocking 1× Binding Buffer (3.3.1.4) for 10–20 min at 4 °C with gently rocking (2–3 rpm).
3.3.4. Aptamer incubation
Remove 1× Binding Buffer and incubate 25–50 μL Aptamer(s) (3.3.1.2) on cells for an amount of time that allows for equilibrium binding to be established (e.g. 15–30 min). Incubate aptamer at 4 °C with gentle rocking (2–3 rpm).
In order to conserve aptamer, the multi-channel may not be desirable to use to pipette the aptamer. Instead, aspirate a column of wells of the 96-well plate and pipette the aptamer to each well (Fig. 4C). Start timing with aspiration/adding aptamer and only have as many samples as appropriate for the incubation time. Using longer incubation times to establish equilibrium binding (e.g. 30 min) will allow for more flexibility in adding aptamer.
3.3.5. Wash unbound aptamer
Decant aptamer (Fig. 4B) and wash cells twice with 200 μL Washing 1× Binding Buffer (3.3.1.3) using the multi-channel pipette. More washes may be used to remove non-specific binding if necessary. After the final wash, decant 1× Binding Buffer and tilt plate for ∼30 s and decant again to fully dry wells. After the final wash, the cells should be briefly observed under a microscope to confirm that the cells remained adherent throughout the experiment.
3.3.6. Lysis
Add 15–20 μL Lysis Buffer (3.3.1.5) to each well using the multichannel pipette. Protect the plate from light (e.g. cover with aluminum foil) and incubate at 4 °C for 2 h to overnight with gentle rocking (2–3 rpm). Longer incubation time will allow for more complete lysis. Inefficient or incomplete lysis will increase variability between biological replicates.
3.3.7. Measure aptamer fluorescence within the lysis buffer
Measuring the fluorescence of the aptamer is covered in section the Fluorescence measurements (3.5) section.
3.4. Fluorescent based internalization assay on cells (Fig. 1C)
The AFBI assay allows for the rapid testing of aptamer internalization into cells over multiple incubation times. The use of 96-well plates with low volumes allows for multiple concentrations of each aptamer to be tested at each time point along with the appropriate controls. The internalization time course (Fig. 1C) was conducted using normal culture medium (DMEM with FBS) and normal cell culture conditions (37 °C with 5% CO2) with adherent cells (A7r5). The AFBI assay may be readily adapted for any cell type and cell culture conditions. Non-adherent cells will require appropriate centrifugation steps.
3.4.1. Prepare reagents
All reagents should be prepared prior to the experiment at volumes appropriate for the number of conditions and biological replicates being tested. These volumes should include excess (e.g. +20%) for the reservoir (2.1.6) when using the multi-channel pipette (2.1.2).
3.4.1.1. Cells
Plate and culture cells (2.3.2) in 96-well plates (2.1.3) with one plate for each time point. We recommend plating cells with a biological replicate of at least 4 (Fig. 4A). The total number of wells should include controls discussed in the Plating cells and planning controls (3.2) section.
3.4.1.2. Aptamer(s)
Prepare enough fluorescently labeled aptamer (2.3.1) and fluorescently labeled non-binding/internalizing negative control aptamer (2.3.1) in culture media (2.4.2) to allow for 25–50 μL within each well.
3.4.1.3. Wash media
Prepare enough media (2.4.2) to wash the cells two times using 100 μL of media. Incubate at 37 °C.
3.4.1.4. Blocking media (optional)
Cells may be washed with media containing oligonucleotide molecules similar to the aptamer to decrease non-specific binding (e.g. yeast tRNA (2.4.6) may be used as a block with RNA aptamers). Prepare enough blocking media to add 100 μL per well. Incubate at 37 °C.
3.4.1.5. Ice cold PBS and ice cold PBS with 0.5 M NaCl
Prepare enough PBS (2.4.3) and PBS with 0.5 M NaCl (2.4.4) to wash the cells two times with 200 μL Chill on ice.
3.4.1.6. Lysis Buffer
Prepare enough Lysis Buffer (2.4.5) to add 15–20 μL to each well. Chill on ice.
3.4.2. Wash cells
Using the multichannel pipette, wash Cells (3.3.1.1) two times with 100 μL Wash Media (3.4.1.3). Media may be decanted (Fig. 4B) rather than aspirated between washes.
3.4.3. Block cells (optional)
Block cells with 100 μL of the Blocking media (3.4.1.4) for 10–20 min under normal cell culture conditions (e.g. 5% CO2 at 37 °C).
3.4.4. Aptamer incubation
Remove wash media, or blocking media, and incubate 25–50 μL Aptamer(s) (3.4.1.2) on cells for the amount of time being tested (e.g. 5–60 min) under normal cell culture conditions (e.g. 37 °C with 5% CO2).
In order to conserve aptamer, the multi-channel may not be desirable to use to pipette the aptamer. Instead, aspirate a column of wells of the 96-well plate and pipette the aptamer to each well with a single channel pipette (Fig. 4C). Start timing with the aspiration/adding aptamer and only have as many samples as appropriate for the time point of the plate (e.g. if one column is completed in ∼45 s then do not exceed 6 columns for the 5 min time point ∼4 ½ min).
3.4.5. Wash bound and unbound aptamer
This protocol uses a combination of ice cold PBS and ice cold PBS with 0.5 M NaCl to remove bound and unbound aptamer. Only internalized aptamer will remain after the washes. Alternatively, cold trypsin washes [25] may be used in place of ice cold PBS and ice cold PBS with 0.5 M NaCl.
Using the multi-channel pipette, add 200 μL Ice Cold PBS (3.4.1.5) to stop internalization of the aptamer at the same pace established during the aptamer incubation step (3.4.4). Decant aptamer media with ice cold PBS (Fig. 4B). Wash the cells with 200 μL Ice Cold PBS with 0.5M NaCl (3.4.1.5) with the multi-channel pipette. Decant ice cold PBS with 0.5 M NaCl. Wash the cells with 200 μL Ice Cold PBS with 0.5M NaCl (3.4.1.5) and incubate at 4 °C for 5 min. Decant ice cold PBS with 0.5 M NaCl and use the multi-channel pipette to wash cells with 200 μL Ice Cold PBS (3.4.1.5). Decant ice cold PBS and tilt plate for ∼30 s and decant again to fully dry wells. After the final wash, the cells should be briefly observed under a microscope to confirm that the cells remained adherent throughout the experiment.
3.4.6. Lysis
Add 15–20 μL Lysis Buffer (3.4.1.6) to each well using the multichannel pipette. Protect the plate from light (e.g. cover with aluminum foil) and incubate at 4 °C for two hours to overnight with gentle rocking (2–3 rpm). Longer incubation time will allow for more complete lysis. Inefficient lysis will increase variability between biological replicates.
3.4.7. Measure aptamer fluorescence within the lysis buffer
Measuring the fluorescence of the aptamer is covered in section the Fluorescence measurements (3.5) section.
3.5. Fluorescence measurements
Measuring the fluorescence of each sample requires only three steps. These steps include 1) transferring cell lysate from the 96-well plate to the 384-well plate 2) optionally establishing a standard curve and 3) measuring the fluorescence with the microplate reader using repeated measures.
3.5.1. Standard curve (optional)
A standard curve for each fluorescently labeled aptamer may be used to convert fluorescent aptamer data to aptamer molarity. This is critically important when using aptamer fluorescent labeling efficiency less than 100%. A standard curve of a 1:10 serial dilution may be efficiently generated using a 96-well plate (Fig. 4D). Add 90 μL of Lysis Buffer to each well (e.g. A1 – H4). Add 10 μL aptamer to the topmost wells (e.g. A1 – A4). Using the multi-channel pipette, transfer 10 μL of the aptamer containing well to the next set of wells (e.g. B1 – B4) and pipette to mix. Repeat this process with each set of wells (e.g. C1-C4,D1-D4,E1-E4,F1-F4,G1-G4,H1-H 4) pipetting to mix and using fresh pipette tips for each dilution.
3.5.2. Load the 384-well plate
Pipette 10 μL lysate, or standard curve dilutions, using the multi-channel pipette from the 96-well plate to the 384-well plate. The 8-channel multi-channel pipette may be used to load every other well of a 384-well plate as shown in Fig. 4E. The pattern of loading the 384-well plate should be noted to accurately analyze the fluorescence data.
3.5.3. Measure fluorescence with repeated measures
Measure the fluorescence using the microplate reader. Set the plate option to “384-well Nunc flat bottom plate” and select the “Read” option (Supplemental Fig. 2A). Within the Read Method dialog box set Detection Method to “Fluorescence intensity” and Read Type to “Endpoint/Kinetic” (Supplemental Fig. 2B). Set the excitation and emission wavelengths (Supplemental Fig. 2C) as appropriate for the fluorophore conjugated to the aptamer (Table 1). Repeat the fluorescence measurements at least three times. The repeated measures will decrease the noise and improve the fidelity of the assay.
3.6. Data analysis
Save or copy these fluorescence data from the microplate reader into a data management and analysis program such as Microsoft Excel or GraphPad Prism. Format data appropriately to keep track of the repeated measures for each biological replicate within the 384-well plate. This is especially important if loading the 384-plate with a multi-channel pipette (Fig. 4E).
3.6.1. Average repeated measures
First, remove background fluorescence by subtracting the average fluorescence of the no aptamer control from the fluorescence of each experimental condition. Next, determine the average fluorescence of the repeated measures for each biological replicate.
3.6.2. Average biological replicates, calculate error, plot data and calculate EC50 or Kd
Determine the average fluorescence of each set of biological replicates and calculate error. These fluorescence data may be plotted against either time (Fig. 1B) or concentration (Fig. 1C). The EC50 of internalization of Kd may be determined from these data using a software analysis programs (e.g. GraphPad Prism).
3.6.3. Standard curve normalization of data (optional)
Plot the standard curve fluorescence data against the aptamer molarity serial dilution. Generate a linear regression of these data using a graphing program (e.g. Microsoft Excel or GraphPad Prism). Use this equation to convert the measured aptamer fluorescence to aptamer molarity.
3.6.4. Estimate the number of aptamer molecules per cell (optional)
Calculating the number of aptamer molecules per cell from cell-internalization data requires estimating the number of cells cultured per well and estimating the total number of aptamer molecules contained within the cell lysate.
First, collect several wells of cells from a 96-well plate and count these cells to give an estimated number of cells cultured per well. Next, using the aptamer molarity determined from the standard curve (3.6.3) and the total volume of the cell lysate (3.3.6), calculate the total number of aptamer molecules contained within the lysate. Lastly, divide the estimated number of cells by the estimated number of aptamer molecules to yield the estimated number of aptamer molecules per cell.
4. Discussion
The methods described in this article are designed to allow for rapid high-throughput validation of cell-based SELEX-derived aptamers for binding/internalization. The benefits of this high-throughput assay are
Speed of the assay
Capacity to screen many conditions simultaneously
Ability to directly quantitate aptamer binding (determine Kd) and estimate the number of aptamers that internalize per cell
Fewer experimental steps/manipulations are required, thus decreasing processing errors
Less reagents are needed as compared to qPCR and flow cytometry/confocal microscopy
Reagents (fluorescently-labeled aptamer) are suitable for other experiments (e.g. flow cytometry and confocal microscopy)
The primary disadvantage of this assay is the requirement for fluorescently-labeled chemically synthesized aptamer. Labeled aptamers are more expensive to produce as compared to unlabeled aptamers, and addition of a fluorophore may interfere with target recognition or aptamer secondary structure. This is also a caveat for analysis of fluorescent aptamers by flow cytometry/confocal microscopy. However, the significantly decreased reagent requirement and rapid nature of the method offsets the up-front cost of chemically synthesize aptamer with a fluorophore. Future studies are necessary to confirm that this high throughput methods yields similar results as the conventional methods of qPCR and flow cytometry/confocal microscopy. We envision this assay being used to identify optimal conditions for aptamer binding and/or internalization, and then conventional methods can be applied to confirm the results and strengthen the conclusions from the data.
Supplementary Material
Acknowledgments
This work was supported by the American Heart Association (11POST7620018, 13POST17070101, and 14SDG18850071 to WHT), the National Institutes of Health (R01CA138503 and R21DE019953 to PHG), Mary Kay Foundation (9033-12 and 001-09 to PHG), Elsa U. Pardee Foundation (E2766 to PHG), and the Roy J. Carver Charitable Trust (RJCCT 01-224 to PHG). The funders had no role in study design, data collection and analysis, decision to publish, or preparation of the manuscript.
Abbreviations
- SELEX
Systematic Evolution of Ligands by EXponential enrichment
- AFBI assay
Aptamer Fluorescence Binding and Internalization assay
- qPCR
quantitative PCR
Appendix A. Supplementary data
Supplementary data associated with this article can be found, in the online version, at http://dx.doi.org/10.1016/j.ymeth.2016.03.005.
Footnotes
Disclosures: None.
Contributor Information
William H. Thiel, Email: william-thiel@uiowa.edu.
Paloma H. Giangrande, Email: paloma-giangran-de@uiowa.edu.
References
- 1.Hermann T, Patel DJ. Science. 2000;287:820–825. doi: 10.1126/science.287.5454.820. [DOI] [PubMed] [Google Scholar]
- 2.Sun H, Zu Y. Molecules. 2015;20:11959–11980. doi: 10.3390/molecules200711959. 1980. [DOI] [PMC free article] [PubMed] [Google Scholar]
- 3.Sundaram P, Kurniawan H, Byrne ME, Wower J. Eur J Pharm Sci. 2012;48:259–271. doi: 10.1016/j.ejps.2012.10.014. [DOI] [PubMed] [Google Scholar]
- 4.Bruno JG. Molecules. 2015;20:6866–6887. doi: 10.3390/molecules20046866. [DOI] [PMC free article] [PubMed] [Google Scholar]
- 5.Tuerk C, Gold L. Science. 1990;249:505–510. doi: 10.1126/science.2200121. [DOI] [PubMed] [Google Scholar]
- 6.Ellington AD, Szostak JW. Nature. 1990;346:818–822. doi: 10.1038/346818a0. [DOI] [PubMed] [Google Scholar]
- 7.Thiel WH, Bair T, Peek AS, Liu X, Dassie J, Stockdale KR, Behlke MA, Miller FJ, Jr, Giangrande PH. PLoS ONE. 2012;7:e43836. doi: 10.1371/journal.pone.0043836. [DOI] [PMC free article] [PubMed] [Google Scholar]
- 8.Thiel WH, Thiel KW, Flenker KS, Bair T, Dupuy AJ, McNamara JO, 2nd, Miller FJ, Giangrande PH. Methods Mol Biol. 2015;1218:187–199. doi: 10.1007/978-1-4939-1538-5_11. [DOI] [PMC free article] [PubMed] [Google Scholar]
- 9.Thiel WH, Giangrande PH. Methods. 2015 [Google Scholar]
- 10.Alam KK, Chang JL, Burke DH. Mol Ther Nucleic Acids. 2015;4:e230. doi: 10.1038/mtna.2015.4. [DOI] [PMC free article] [PubMed] [Google Scholar]
- 11.Hoinka J, Berezhnoy A, Sauna ZE, Gilboa E, Przytycka TM. In: Research in Computational Molecular Biology. Sharan R, editor. Springer International Publishing; Pittsburgh PA: 2014. pp. 115–128. [DOI] [PMC free article] [PubMed] [Google Scholar]
- 12.Blind M, Blank M. Mol Ther Nucleic Acids. 2015;4:e223. doi: 10.1038/mtna.2014.74. [DOI] [PMC free article] [PubMed] [Google Scholar]
- 13.Morris KN, Jensen KB, Julin CM, Weil M, Gold L. Proc Natl Acad Sci U S A. 1998;95:2902–2907. doi: 10.1073/pnas.95.6.2902. [DOI] [PMC free article] [PubMed] [Google Scholar]
- 14.Blank M, Weinschenk T, Priemer M, Schluesener H. J Biol Chem. 2001;276:16464–16468. doi: 10.1074/jbc.M100347200. [DOI] [PubMed] [Google Scholar]
- 15.Cerchia L, Duconge F, Pestourie C, Boulay J, Aissouni Y, Gombert K, Tavitian B, de Franciscis V, Libri D. PLoS Biol. 2005;3:e123. doi: 10.1371/journal.pbio.0030123. [DOI] [PMC free article] [PubMed] [Google Scholar] [Retracted]
- 16.Berezhnoy A, Stewart CA, McNamara JO, II, Thiel W, Giangrande P, Trinchieri G, Gilboa E. Mol Ther. 2012 doi: 10.1038/mt.2012.18. [DOI] [PMC free article] [PubMed] [Google Scholar]
- 17.Thiel KW, Hernandez LI, Dassie JP, Thiel WH, Liu X, Stockdale KR, Rothman AM, Hernandez FJ, McNamara JO, II, Giangrande PH. Nucl Acids Res. 2012;40:6319–6337. doi: 10.1093/nar/gks294. [DOI] [PMC free article] [PubMed] [Google Scholar]
- 18.Camorani S, Esposito CL, Rienzo A, Catuogno S, Iaboni M, Condorelli G, de Franciscis V, Cerchia L. Mol Ther. 2014;22:828–841. doi: 10.1038/mt.2013.300. [DOI] [PMC free article] [PubMed] [Google Scholar]
- 19.Shangguan D, Meng L, Cao ZC, Xiao Z, Fang X, Li Y, Cardona D, Witek RP, Liu C, Tan W. Anal Chem. 2008;80:721–728. doi: 10.1021/ac701962v. [DOI] [PubMed] [Google Scholar]
- 20.Sefah K, Tang ZW, Shangguan DH, Chen H, Lopez-Colon D, Li Y, Parekh P, Martin J, Meng L, Phillips JA, Kim YM, Tan WH. Leukemia. 2009;23:235–244. doi: 10.1038/leu.2008.335. [DOI] [PMC free article] [PubMed] [Google Scholar]
- 21.Mallikaratchy P, Tang Z, Kwame S, Meng L, Shangguan D, Tan W. Mol Cell Proteomics. 2007;6:2230–2238. doi: 10.1074/mcp.M700026-MCP200. [DOI] [PubMed] [Google Scholar]
- 22.Meyer S, Maufort JP, Nie J, Stewart R, McIntosh BE, Conti LR, Ahmad KM, Soh HT, Thomson JA. PLoS ONE. 2013;8:e71798. doi: 10.1371/journal.pone.0071798. [DOI] [PMC free article] [PubMed] [Google Scholar]
- 23.Cho M, Soo Oh S, Nie J, Stewart R, Eisenstein M, Chambers J, Marth JD, Walker F, Thomson JA, Soh HT. Proc Natl Acad Sci U S A. 2013;110:18460–18465. doi: 10.1073/pnas.1315866110. [DOI] [PMC free article] [PubMed] [Google Scholar]
- 24.Kim YS, Gu MB. Adv Biochem Eng Biotechnol. 2014;140:29–67. doi: 10.1007/10_2013_225. [DOI] [PubMed] [Google Scholar]
- 25.Hernandez LI, Flenker KS, Hernandez FJ, Klingelhutz AJ, McNamara JO, 2nd, Giangrande PH. Pharmaceuticals (Basel) 2013;6:295–319. doi: 10.3390/ph6030295. [DOI] [PMC free article] [PubMed] [Google Scholar]
- 26.Dickey D, Thomas G, Dassie J, Giangrande P. In: SiRNA Delivery Methods. Shum K, Rossi J, editors. Springer; New York: 2016. pp. 209–217. [Google Scholar]
- 27.Amine-Reactive Probes” Life Technologies (MP00143) 2013:1–10. [Google Scholar]
Associated Data
This section collects any data citations, data availability statements, or supplementary materials included in this article.