Abstract
For successful carbohydrate based anti-cancer vaccines, it is critical that B cells are activated to secret antibodies targeting the tumor associated carbohydrate antigens (TACAs). Despite the availability of many TACA based constructs, systematic understanding of the effects of structural features on anti-glycan antibody responses is lacking. In this study, a series of defined synthetic glyco-polymers bearing a representative TACA, i.e., the Thomsen-nouveau (Tn) antigen, have been prepared to probe the induction of early B cell activation and antibody production via a T cell independent mechanism. Valency and density of the antigen in the polymers turned out to be critical. An average of greater than 6 Tn per chain was needed to induce antibody production. Glycopolymers with 40 antigens per chain and backbone molecular weight of 450 kDa gave the strongest stimulation to B cells in vitro, which correlated well with its in vivo activity. Deviations from the desired valency and density led to decreased antibody production or even antigen specific B cell non-responsiveness. These findings provide important insights on how to modulate anti-TACA immune responses facilitating the development of TACA based anti-cancer vaccines using glycopolymers.
Keywords: antibody response, antigen density, glycopolymer, tumor associated carbohydrate antigen, valency
Graphical Abstract
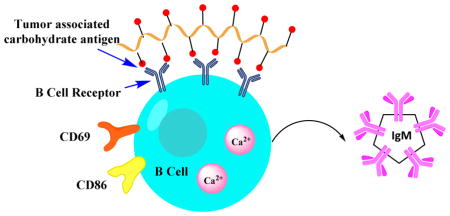
The valency and the spacing between the antigens are critical for antibody generation against a tumor associated carbohydrate antigen.
Introduction
Tumor associated carbohydrate antigens (TACAs) such as glycolipids and glycoproteins are over-expressed on a wide range of cancers.1–4 Clinical studies have shown that patients with higher levels of naturally generated anti-TACA antibodies are associated with better prognosis.5–8 Moreover, a monoclonal antibody targeting the glycan structure of ganglioside GD2 has been approved by FDA as a first line therapy for pediatric patients with high-risk neuroblastoma validating TACAs as targets for vaccine development.9 With the increasing appreciation of roles of TACAs, intensive efforts have been dedicated towards TACA based vaccine design.1–4 To facilitate these efforts, a better understanding of how structures of TACA constructs influence antibody generation is much needed.
TACAs elicit humoral responses characteristic of T cell independent (TI) antigens,10 which primarily bind to antibody secreting B cells through B cell receptors (BCRs). BCRs initiate signaling across the cell membrane leading to either B cell activation or tolerance.11 Antigen requirements for B cell activation and differentiation are complex.10, 12–14 Some monovalent antigens such as an ovalbumin peptide and hen egg lysozyme have been shown to be able to activate B cells.15–17 For other antigens, multivalent constructs are needed to crosslink multiple BCRs with the number of antigens per construct (valency) needed varying significantly. Using nitro-iodophenol (NIP) as the hapten and polypeptide as the carrier, the Schamel group showed that constructs containing two to three NIPs per peptide could activate NIP specific B cells.18 The spacing between the antigen (density) was not critical as dimers with NIP on adjacent amino acid residues activated B cells as well as a dimer containing NIPs separated by 24 amino acids. In contrast, Dintzis and coworkers showed with fluorescein or dinitrophenyl haptens, the constructs must exceed molecular mass of 100 kDa and 20 haptens per chain for induction of antibody secretion.19–21 Above these threshold values, higher valency (126 antigens per chain) led to continual increase of B cell responses.19 Using dinitrophenyl bearing ring-opening metathesis polymers, the Kiessling group showed that low valency polymer (10 mer) could activate B cells, although the high valency (500 mer) construct was much more effective in antibody induction.22 These meticulous studies suggest the valency needed for B cell activation and antibody production is highly antigen dependent.
Compared to foreign TI antigens such as NIP and dinitrophenyl, the generation of TACA-specific antibody responses poses additional challenges. As they are self-antigens, most high affinity TACA specific B cells undergo cell death during conventional B cell development,23 resulting in limited frequency and functionality of these cells. Therefore, it is desirable to increase TACA specific B cell numbers and titers of anti-TACA antibodies through interactions with vaccine constructs.
Herein, to better understand how structures of TACA constructs impact B cell functions, we prepared a set of systematically varied synthetic glyco-polymers. The antigen valency and density of the constructs were found to significantly influence antibody generation. Decoding the key parameters eliciting TACA specific B cell activation vs non-responsiveness can have important implications for the establishment of effective TACA based anti-cancer vaccines.
Experimental Section
General Experimental Procedures and Methods for Synthesis
All reactions were carried out under nitrogen with anhydrous solvents in flame-dried glassware, unless otherwise noted. Chemicals used were reagent grade as supplied except where noted. Compounds were visualized by UV light (254 nm) and by staining with a yellow solution containing Ce(NH4)2(NO3)6 (0.5 g) and (NH4)6Mo7O244H2O (24.0 g) in 6% H2SO4 (500mL). Flash column chromatography was performed on silica gel 60 (230–400 Mesh). NMR spectra were referenced using residual CHCl3 (δ 1H-NMR 7.26 ppm), D2O (δ 1H-NMR 4.79 ppm). The molecular weight and polydispersity of the polymers were determined by gel permeation chromatography (GPC) at 35 °C using two PLgel 10-μm mixed-B columns with DMF as the eluting solvent.
Synthesis of polymer 4
A solution of p-nitro aniline 1 (13.8 mg, 0.1 mmol), sodium nitrite (8.3 mg, 0.12 mmol), and a 50% aqueous fluoroboric acid solution (18.7 μL, 0.15 mmol) in water was cooled to 0 °C for 30 minutes. At this time, sodium cyanate (6.5 mg, 0.1 mmol), monomer acrylic acid 3 (2 mL, 0.029 mol) dissolved in water (2 mL) were added. The reaction mixture was heated to 70 °C overnight. The polymer was dialyzed against water and then lyophilized (90% yield). 1H-NMR: δ 1.25–2.00 (br m, aliphatic H, from CH2 of polymer backbone), δ 2.00–2.50 (br s, aliphatic H, from CH of polymer backbone), δ 7.30 (br s, aromatic H), δ 8.10 (br s, aromatic H). Peak integration was normalized to the small aromatic peaks at ~7.30 ppm (2 protons) and ~8.10 ppm (2 protons). Based on the integration ratio, there were an average of 180 acrylic acid units per chain (Mn ~ 12.9 kDa). To analyze the polymer by GPC, polymer 4 was converted to its methyl ester form by the following process. Polymer 4 (10 mg) was dissolved in MeOH : toluene (1:1, 1 mL) followed by drop wise addition of TMSCHN2 (0.1 mL). The reaction mixture was stirred overnight and all the solvent was evaporated. The methylated polymer 4 was analyzed by GPC, which gave PDI of 1.22. Based on the molecular weight determined from GPC of the methylated polymer, the Mn of polymer 4 was determined to be 13.4 kDa.
Synthesis of polymer 8
All solutions used for synthesis of polymer 8 were deoxygenated with three freeze-pump-thaw cycles and the reaction was performed under nitrogen atmosphere. Monomer tbutyl acrylate 6 (10 g), initiator methyl 2-bromopropionate 5 (0.016 mL), catalysts CuBr (0.0201 g) and CuBr2 (0.78 mg) and ligand PMDETA (0.03 mL) in THF (3 mL) were mixed in 500:1:1:0.05:1.05 ratio. Catalysts were measured into a dry round bottom flask, and the system was purged of O2 by pumping N2 for 20 min. Distilled monomer was added by syringe and needle, and purged with N2 for 10 min followed by addition of the ligand and the initiator. The reaction mixture was stirred at 60 °C for 24 h. The reaction was quenched by THF, and catalysts were removed by silica gel column using THF as solvent. tBu protected polymer 8 was purified by precipitating with a CH3OH:H2O (50:50) solution. The purification process was repeated three times and the final polymer was dried under vacuum. 1H-NMR: δ 1.30–1.80 (br m, aliphatic H from CH2 of polymer backbone and CH(CH3)3), δ 2.10–2.25 (br m, aliphatic H, from CH of polymer backbone). tBu protected polymer 8 was dissolved in DCM and treated for 4 h with trifluoroacetic acid (TFA) at 3:1 molar ratio of TFA: monomer. The solid was separated and washed multiple times with diethyl ether. The hydrolysis was repeated three times. The final product polymer 8 was dried under vacuum (85% yield). 1H-NMR: δ 1.45–1.80 (br m, aliphatic H from CH2 of polymer backbone), δ 2.20–2.30 (br s, aliphatic H, from CH of polymer backbone). GPC analysis gave Mn of 46 kDa with a PDI value of 1.57.
Synthesis of glycopolymer
For 450k-10, polymer 450k (10 mg) was dissolved in 1 mL anhydrous DMF. Tn-NH2 (0.1 mg, 10 eq), DIPEA (48 μL, 2eq), TSTU (50 mg, 1.2 eq) were added. The reaction mixture was stirred overnight, and the final glycopolymer was purified by a LH-20 column using water as the solvent. The number of Tn/chain was determined by anthrone-sulfuric acid assay24 using GalNAc as standards. All the other glycopolymers were synthesized and characterized in a similar way.
Cell viability
CytoTox 96 Non-Radioactive Cytotoxicity Assay of Promega (Madison, WI) was used for cell viability assay. EA.hy 926 cells were incubated with 450k-40 polymers at Tn concentrations ranging from 0 to 84 μM. 450k polymers were also tested with the same polymer concentration as the 450k-40. After incubation for 48 h, 50 μL of cell culture medium from each well was transferred to a fresh 96-well flat clear bottom plate, followed by addition of 50 μL of the Cyto Tox 96 Reagent to each well. The plate was incubated for 30 min at room temperature. Next, 50 μL of Stop Solution was added, and absorbance at 490 nm was measured. Each experiment was performed in triplicate. The average values of the culture medium background were subtracted from all values of experimental wells. For maximum lactate dehydrogenase (LDH) release control, 20 μL of 10X Lysis Solution was added 45 min before adding the CytoTox 96 Reagent. Percentage of survival=[1−OD490(experimental)/OD490(control)]*100%
Cell isolation and culture
Splenic cells were harvested from C57BL/6 mice. Red blood cells were depleted by ACK lysing buffer (Life Technologies). Splenic B cells were isolated by negative selection (Easysep Mouse B cell Isolation Kit, StemCell Technologies) following the manufacturer’s protocol. Both nucleated splenic cells and isolated B cells were cultured in RPMI 1640 supplemented with 10% FBS, 10 mM HEPES, 50 μM mercaptoethanol, 2 mM L-glutamine, 100 μg/mL penicillin G and 100 U/mL streptomycin.
ELISPOT assay
Mouse splenic cells were isolated and serially diluted across the plate, which was followed by adding the corresponding glycopolymer, control polymer or cell culture medium and incubated at 37 °C on day 1. On day 4, a 96 well MultiScreen ELISPOT plate (Millipore) was coated overnight at 4 °C with a solution of bovine serum albumin-Tn conjugate (BSA–Tn)25 in PBS buffer (10 μg mL−1) and then incubated at 4 °C overnight. On day 5, the ELISPOT plate was washed three times with PBST (0.1%) and blocked with 300 μL/well 5% BSA-PBST at room temperature for 1 hour. The plate was washed again three times with PBST 0.1% and three times with fresh 1640 culture medium. The splenic cells were transferred to the ELISPOT plate and incubated at 37 °C overnight. On day 6 the plate was washed nine times with PBST (0.1%) and three times with PBS followed by adding a 1:1000 dilution of horseradish peroxidase (HRP)-conjugated goat anti-mouse IgM (Jackson ImmunoResearch Laboratory) in 1% BSA-PBST to each well. The plate was incubated for one hour at 37 °C, washed three times with 0.1% PBST and three times with PBS. Spots were developed at room temperature for about 15 min by the addition of AEC Staining kit (Sigma-Aldrich). After optimal spot development, plates were washed with water and dried. Data were collected and analyzed using the CTL ImmunoSpot system (Cellular Technology Ltd., Shaker Heights, OH).
For tolerization experiments, on day 1, 13k-4 polymers at Tn concentrations at 0, 2.1, 4.2, 6.3, 8.4 and 16.8 μM respectively were added to wells containing fresh isolated spleen cells (8 × 10⁵ cells/well) incubated with polymer 450k-40 (at 8.4 μM Tn) or wheat germ agglutinin (1 μg/mL). The numbers of Tn specific ASCs were determined using ELISPOT as described above.
Flow cytometry for Tn specific B cells
After incubation with glycopolymers for 4 days, mouse spleen cells (5 × 10⁵ cells) were washed twice with FACS buffer (1% BSA + 0.1% NaN3/PBS) and incubated with 2 μL of BSA-Tn-Alex Fluor 647 solution (0.5 mg/mL), which was prepared by reacting BSA-Tn25 with Alexa Fluor 647 NHS ester (Thermo Fisher Scientific A-20006). After incubation for 1 h on ice, cells were incubated with 2 μL mouse Fc block (0.5 mg/mL, BD 55142) for 10 min on ice followed by staining with 2 μL PE rat anti-mouse CD19 (0.2 mg/mL, BD 553786) for 30 min on ice. The cells were washed twice and re-suspended in FACS buffer, and then analyzed by LSR II (BD Biosciences). 2 μL 7-AAD (0.05 mg/mL, BD 559925) was added to the samples to exclude dead cells before analysis. Data was processed by FlowJo software.
Measurement of apoptosis
Isolated mouse spleen cells were incubated with 450k-40 (Tn 8.4 μM), 450k-80 (Tn 4.2 μM) and 450k-115 (Tn 6.3 μM) respectively for 4 days (the Tn concentrations were chosen based on Figure 1 where maximum responses were observed with 450k-40, 450k-80 and 450k-115 respectively), and then cells (5 × 10⁵ cells) were washed twice with FACS buffer (1% BSA + 0.1% NaN3/PBS) and incubated with 2 μL of BSA-Tn-Alexa Fluor 647 (0.5 mg/mL) on ice. After 1 h, cells were incubated with 2 μL mouse Fc block (0.5 mg/mL, BD 55142) for 10 min on ice followed by staining with 2 μL PE rat anti-mouse CD19 (0.2 mg/mL, BD 553786) for 30 min on ice. Next, cells were stained with 5 μL Annexin V-FITC (eBioscience) for 15 min at room temperature. The cells were washed twice and re-suspended in FACS buffer, and then analyzed by LSR II (BD Biosciences). 2 μL 7-AAD (0.05 mg/mL, BD 559925) was added to the samples to exclude dead cells before analysis. Data was processed by FlowJo software.
Figure 1.
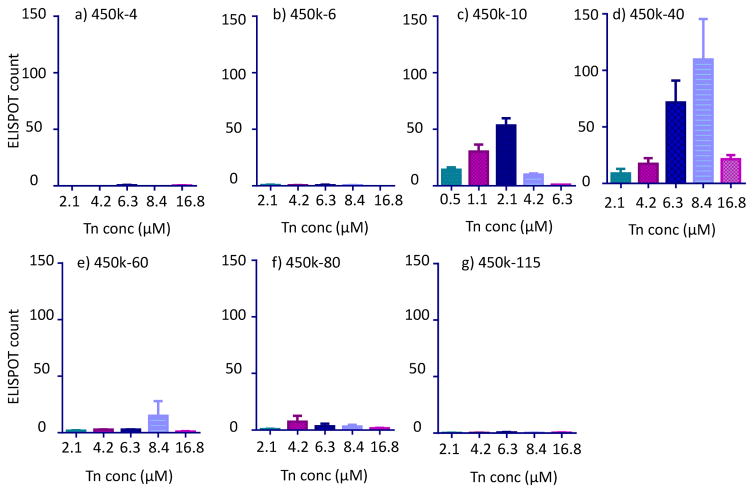
ELISPOT results of anti-Tn B cells treated with the following glycopolymers with 450kDa backbones: a) 450k-4; b) 450k-6; c) 450k-10; d) 450k-40; e) 450k-60; f) 450k-80; and g) 450k-115.
BCR clustering and colocalization with GM1
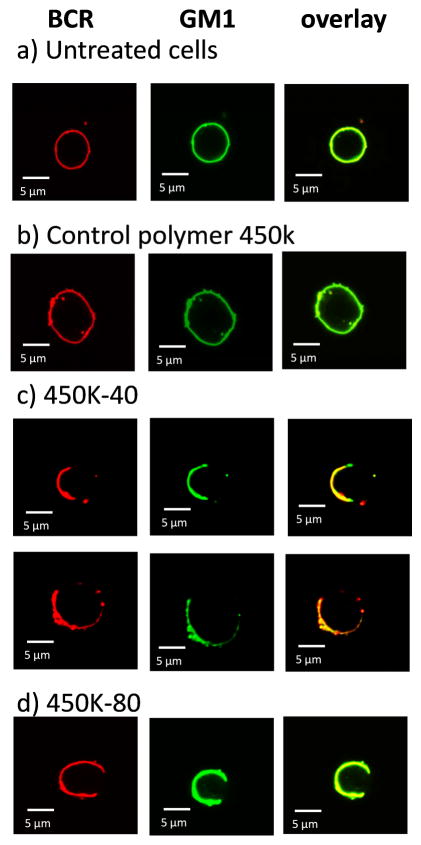
Isolated B cells were washed three times with binding buffer (PBS supplemented with 1% BSA). Cells (5 × 10⁶ cells/mL) were stained with 16 μg/mL Rhodamine Red-X-conjugated Affinipure Fab fragment goat anti-mouse IgM, μ chain specific (Jackson ImmunoResearch) for 30 min on ice and washed followed by staining with 50μg/mL Cholera toxin B subunit from Vibrio cholera FITC conjugate (Sigma) for 30 min on ice. After extensive washing by binding buffer, cells were incubated with buffer or different polymers for 10 min on ice. After washing, cells were fixed with 4% paraformaldehyde for 30 min on ice. After washing with binding buffer, cells were mounted on polylysine-coated slides. Confocal laser microscopy images were collected on an Olympus FluoView 1000 LSM confocal microscope. For cells incubated with 450k-40 (Tn 8.4 μM) and 450k-80 (Tn 4.2 μM) glycopolymers, from confocal images, it was estimated that 4.3% and 2.7% of cells appeared with punctate staining as shown in Figures 3c and 3d respectively. These percentages were consistent with the percent of Tn specific B cells determined by FACS (Table 2).
Figure 3.
Confocal microscopy images of a) untreated B cells; B cells incubated with b) the control polymer 450k; c) 450k-40 (Tn 8.4 μM); and d) 450k-80 (Tn 4.2 μM). BCRs were stained red with rhodamine-anti-IgM μ chain specific F (ab’) and GM1 was stained green with FITC-cholera toxin B subunit. Yellow color in the overlay images suggests the colocalization of BCR with GM1.
Table 2.
Summary of ELISPOT and flow cytometry results of 450kDa glycopolymer treated spleen cells. Flow cytometry data are the average of a minimum of three independent experiments (n≥3). The statistical analysis results are presented in Figure S2.
| Polymer | Tn concentration (μM) | Percentage of Tn-specific B cells by flow cytometry | ELISPOT count |
|---|---|---|---|
| 450k | 0 | 1.0 | 1 |
| 450k-6 | 2.1 | 1.2 | 2 |
| 450k-10 | 1.05 | 3.2 | 30 |
| 2.1 | 3.8 | 56 | |
| 450k-40 | 6.3 | 4.4 | 71 |
| 8.4 | 5.4 | 109 | |
| 450k-60 | 8.4 | 2.6 | 15 |
| 450k-80 | 4.2 | 1.6 | 7 |
| 450k-115 | 6.3 | 1.3 | 1 |
Calcium flux assay
Fluo-4 NW calcium assay kit (Thermo Fisher Scientific) was used for detecting intracellular calcium. Briefly, B cells were washed and resuspended in HBSS, 20 mM HEPES buffer to a density of ~2.5 × 10⁶ cells/mL, and added to 96-well microplates. Plates were incubated at 37 °C and 5% of CO2 for 60 minutes. Fluo-4 NW dye was mixed with 100 μL probenecid stock solution and 5 mL assay buffer, and added to the plates. Plates were then incubated at 37 °C for 30 minutes and at room temperature for an additional 30 minutes. Fluorescence was measured by FDSS/μCELL functional drug screening system. After collection of baseline emission for 20 seconds, control polymer 450k or glycopolymer 450k-40 (Tn 8.4 μM) were added to the cells and the cellular fluorescence was continuously monitored.
Flow cytometry for cell surface marker
After incubation with the glycopolymers, mouse B cells (5 × 10⁵ cells) were washed twice with FACS buffer (1% BSA + 0.1% NaN3/PBS), and incubated with 2 μL mouse Fc block (0.5 mg/mL, BD 55142) for 10 min on ice followed by staining with 2 μL PE rat anti-mouse CD19 (0.2 mg/mL, BD 553786), 2 μL FITC anti-mouse CD69 (0.5 mg/mL, Biolegend 104505) or 2 μL FITC anti-mouse CD86 (0.5 mg/mL, Biolegend 105109) for 30 min on ice. The cells were washed twice and re-suspended in FACS buffer. Prior to analysis by LSR II (BD Biosciences), 2 μL 7-AAD (0.05 mg/mL, BD 559925) was added to the samples to exclude dead cells. Data was processed by FlowJo software.
Mouse immunization
Pathogen-free female C57BL/6 mice age 6–10 weeks were obtained from Charles River and maintained in the University Laboratory Animal Resources facility of Michigan State University. All animal care procedures and experimental protocols have been approved by the Institutional Animal Care and Use Committee (IACUC) of Michigan State University. Groups of five mice were injected intravenously on day 0 with 0.1 mL of the polymer (glycopolymer concentration was 4 μg Tn) in PBS. Serum samples were collected on days 0 (before immunization), 4 and 8.
To study the effect of 13k-4 polymer on antibody responses to 450k-40, a group of five mice were injected intravenously on day 0 with 0.1 mL of the mixture of 450k-40 (4 μg Tn) and 13k-4 (1 μg Tn) in PBS. Serum samples were collected on days 0 (before immunization), 4, and 8.
ELISA assays
A 96-well microtiter plate was coated with a solution of BSA–Tn25 in PBS buffer (10 μg mL−1) and then incubated at 4 °C overnight. The plate was washed four times with PBST, followed by addition of 1% (w/v) BSA in PBS to each well and incubation at RT for one hour. The plate was washed again with PBST and mice sera were added in 0.1% (w/v) BSA/PBS. The plate was incubated for two hours at 37 °C and washed. A 1:2000 dilution of HRP-conjugated goat antimouse IgM (Jackson ImmunoResearch Laboratory) in 0.1% BSA/PBS was added to each well. The plate was incubated for one hour at 37 °C, washed and a solution of 3,3,5′,5′-tetramethylbenzidine (TMB) was added. Color was allowed to develop for 15 min, and then a solution of 0.5 M H2SO4 was added to quench the reaction. The optical density was then measured at 450 nm.
Results and discussions
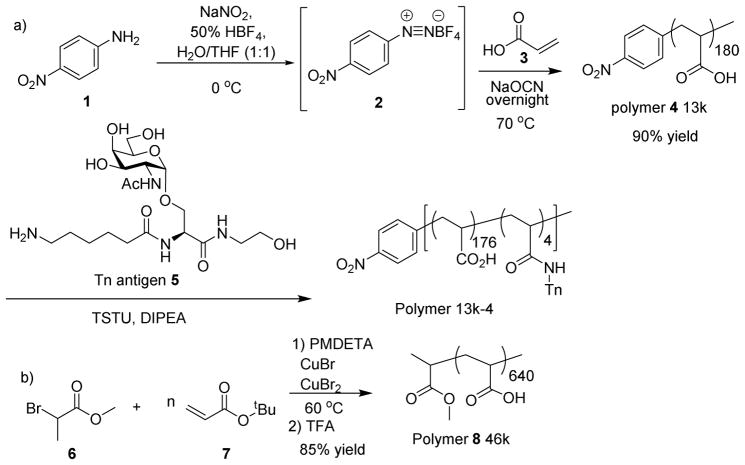
Our studies commenced from the synthesis of glycopolymers bearing the TACA Thomsen-nouveau (Tn) antigen, which has been found over-expressed on breast and prostate cancer cells and is an attractive target for vaccine development.26, 27 To probe the size requirement of vaccine constructs, polyacrylic acids with various molecular weights were prepared. Polyacrylic acid 4 was synthesized via the cyanoxyl-mediated free radical polymerization (Scheme 1a).28 The polymerization was initiated by the treatment of p-nitro aniline 1 with sodium nitrite and fluoroboric acid, which was followed by the addition of a mixture of sodium cyanate and acrylic acid 3 and heating at 70 °C. Gel permeation chromatography analysis showed that polymer 4 has a molecular weight (Mn) of 13 kDa with a polydispersity index (PDI) of 1.22.
Scheme 1.
Synthesis of glycopolymers.
To obtain longer polymer chains, atom transfer radical polymerization was utilized. To a mixture of the initiator methyl 2-bromopropionate 6 and monomer tbutyl acrylate 7 were added the catalysts CuBr, CuBr2 and ligand N,N,N′,N′,N″-pentamethyldiethylenetriamine (PMDETA).29 The reaction mixture was stirred at 60 °C until the polymerization was complete. After purification through silica gel chromatography and selective precipitation, the polymer was treated with trifluoroacetic acid (TFA) to cleave the tbutyl esters producing polymer 8 in 85% overall yield with an average molecular weight of 46 kDa (PDI: 1.57) (Scheme 1b). To obtain longer polymers, high molecular weight polyacrylic acid was carefully fractionated by size exclusion chromatography leading to polymers with average molecular weights of 100 kDa (PDI: 1.62), 250 kDa (PDI: 1.64) and 450 kDa (PDI: 1.64).
To produce the glycopolymers, the amine bearing Tn antigen 525 was covalently linked with polymer 4 through amide bonds as promoted by N,N,N′,N′-tetramethyl-O-(N-succinimidyl)uronium tetrafluoroborate (TSTU) and diisopropylethylamine (DIPEA) (Scheme 1a). Glycan analysis showed that this glycopolymer contained on average 4 Tn molecules per chain (designated as 13k-4) (Table 1). In a similar manner, Tn was introduced into other polymer backbones. By varying the amounts of Tn utilized in the amidation reactions, the number of Tn per polymer chain was controlled leading to a set of glycopolymers (Table 1). Polymers 450k-4, 450k-6, 450k-10, 450k-40, 450k-60, 450k-80 and 450k-115 have 450 kDa backbones bearing 4, 6, 10, 40, 60, 80 and 115 Tn respectively. Polymers 46k-40, 100k-40 and 250k-40 all contain an average 40 Tn per chain with backbone molecular weights of 46, 100 and 250 kDa. It was difficult to introduce 40 copies of Tn per chain into the 13 kDa polymer presumably due to steric hindrance. Glycopolymers 13k-10 and 100k-10 were also synthesized using the 13 kDa and 100 kDa polymers respectively. The polymer and glycopolymer were biocompatible with little toxicities to cells as determined by cell viability assays (Figure S1).
Table 1.
Polymers and glycopolymers synthesized for the current study.
| Abbreviation | Backbone MW (kDa) | Average number of Tn per chain |
|---|---|---|
| 13k | 13 | 0 |
| 13k-4 | 13 | 4 |
| 13k-10 | 13 | 10 |
| 46k | 46 | 0 |
| 46k-40 | 46 | 40 |
| 100k | 100 | 0 |
| 100k-10 | 100 | 10 |
| 100k-40 | 100 | 40 |
| 250k | 250 | 0 |
| 250k-40 | 250 | 40 |
| 450k | 450 | 0 |
| 450k-4 | 450 | 4 |
| 450k-6 | 450 | 6 |
| 450k-10 | 450 | 10 |
| 450k-40 | 450 | 40 |
| 450k-60 | 450 | 60 |
| 450k-80 | 450 | 80 |
| 450k-115 | 450 | 115 |
With the glycopolymers in hand, their abilities to elicit anti-Tn antibodies were first evaluated in vitro. The various glycopolymers as well as control polymers lacking the Tn antigen were incubated individually with naïve B cells freshly isolated from mouse spleens at several different concentrations for four days. If the binding of glycopolymers activated the B cells, the anti-Tn B cells would proliferate and/or differentiate to produce Tn-specific antibodies. The increase in the number of Tn specific antibody-secreting B cells (ASC) could be detected through an enzyme-linked immunospot (ELISPOT) assay using ELISPOT plates coated with a BSA-Tn conjugate.30
Within the series of glycopolymers with 450kDa backbone, an interesting dependence of the number of Tn specific ASCs generated on antigen valency was observed (Figure 1). The 450k-4 and 450k-6 glycopolymers were inactive (Figures 1a,b) with 450k-10 being the one with the lowest copies of Tn per chain inducing significant antibody production (Figure 1c). With 450k-10, a bell-shaped dose dependent response was detected. The number of Tn specific ASCs increased with the dose of the antigen until a maximum of 56 cells per well was observed at 2.1 μM of Tn, which was followed by a decrease at higher dose of Tn. In comparison, wells containing cells treated with the control polymer at all concentrations gave no more than 2 positive spots. This suggested that the polyacrylic acid polymer itself did not non-specifically stimulate antibody production.
Increasing the number of Tn per 450k polymer chain from 10 to 40 led to significant enhancement of the number of spots in ELISPOT. The highest number in ASC (109 per well) was observed with 450k-40 polymer at 8.4 μM of Tn (Figure 1d), which contained the same number of polymer chain as 450k-10 glycopolymer at Tn concentration of 2.1 μM. Further increases of the valency to 60 or above led to declines in the number of antibody secreting B cells with 450k-115 giving few Tn positive spots (< 3) (Figures 1e–g).
The percentages of Tn specific cells in the B cell pool were quantified using flow cytometry. Following incubation with various glyco-polymers, B cells were labeled with a BSA-Tn conjugate bearing Alexa Fluor 647. Consistent with ELISPOT results, B cells incubated with the 450k-40 glycopolymer at 8.4 μM Tn concentration gave the highest percentage of Tn specific cells, suggesting proliferation had occurred (Table 2. For statistical analysis results, see Figure S2). The flow cytometry results correlated well with the trend observed in ELISPOT, which confirms that for high B cell proliferation and ASC differentiation, it is desirable to have valency of the glycopolymers around 40.
To better understand the origin of differential antibody induction by the glycopolymers, the hydrodynamic radii and zeta potential of the glycopolymers were measured. As shown in Table S1a, the 450k polymer as well as all glycopolymers bearing the 450 kDa backbone had similar hydrodynamic diameters (~34 nm) and zeta potential (~ −2.5 mV) in cell culture media. Furthermore, the glycopolymers with various valency were all readily soluble in water. Similar hydrodynamic diameters of the glycopolymers were observed at multiple concentrations (Table S1b). This can be explained as the 450 kDa polymer on average contained over 6,000 carboxylic acid moieties, derivatization of a small percentage (<2%) of those with water soluble Tn antigen did not drastically alter the glycopolymers’ physical properties such as surface charge, size and aqueous solubility. Thus, changes of the abilities to generate antibody responses by various 450k glycopolymers could most likely be attributed to the inherent requirements of Tn-BCR interactions.
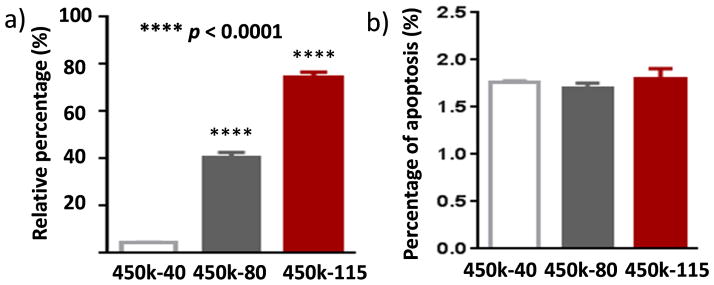
The antibody generation abilities of 450k glycopolymers decreased with valency higher than 40. It is known that hypercrosslinking of BCRs can result in B cell tolerance and apoptosis.31, 32 To test this possibility, the percentages of apoptotic splenic Tn-specific B cells following incubation with 450k-40, 450k-80 and 450k-115 respectively were analyzed. There were significantly higher proportions of cells undergoing apoptosis following incubations with 450k-80 and 450k-115 glycopolymers compared to those with the 450k-40 glycopolymer (Figure 2a). In comparison, the percentages of apoptotic cells in overall B cell pool were similar upon treatments of the three glycopolymers (Figure 2b). Therefore, the super high valency of glycopolymers leads to BCR hypercrosslinking resulting in selective apoptosis of Tn specific B cells. This trend is in contrast to polymers bearing dinitrophenyl haptens, where high valency polymers (100–500 mer) have equal or higher activities in B cell activation.19, 22 This dichotomy is possibly due to the different antigen structures.
Figure 2.
a) Percentages of Tn specific apoptotic B cells upon incubation with 450k-40, 450k-80 or 450k-115 glycopolymers. The percentages were calculated by dividing the numbers of Tn-specific apoptotic B cells by the total number of Tn specific B cells as determined by flow cytometry. Statistical analysis was performed using Student’s t test with p values obtained by comparing with cells incubated with the 450k-40 glycopolymer. Glycopolymers with valency higher than 40 induced more apoptosis of Tn specific B cells. b) Percentages of apoptotic cells in the overall B cell pools upon incubation with 450k-40, 450k-80 or 450k-115 glycopolymers showing no significant differences in overall B cell apoptosis. This suggests the apoptosis induction by higher valency glycopolymers was specific to Tn.
To better understand B cell activation by glycopolymers, confocal microscopy studies were performed. Splenic B cells were treated with 450k-40, 450k-80 or 450k with no Tn. Rhodamine-anti-IgM μ chain specific F(ab’) and FITC-cholera toxin B subunit were used to label BCR and GM1 (a marker for lipid microdomains) respectively. Both untreated cells and 450k polymer treated cells showed evenly distributed BCRs and GM1 across the cell surface indicating the lack of BCR clustering (Figure 3a,b). In contrast, cells incubated with 450k-40 and 450k-80 had a polarized distribution of BCR, which colocalized well with GM1 (Figure 3c,d). This suggests that glycopolymers could induce aggregation of BCRs, resulting in BCR patches enriched in GM1 rich lipid microdomains.22, 33–35 These events contribute to the initial signals for B cell activation. The reduced responses at high doses of the glycopolymers observed in ELISPOT assay (Figures 1c–e) could be explained by the need to cluster multiple BCRs for B cell activation. Too much glycopolymer could compete for BCR binding and decrease the number of BCRs clustered in each complex.
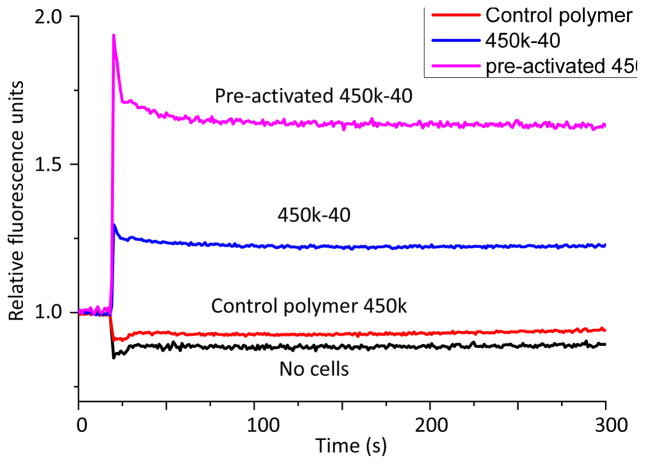
Ca2+ flux is another early event in B cell activation.11 The binding of antigens to BCRs triggers phosphorylation of tyrosine kinases, ultimately resulting in production of the second messenger 1,4,5-inositol triphosphate (IP3) and the release of Ca2+ to cytosol from the endoplasmic reticulum.36, 37 Subsequent activation of store-operated calcium entry supports sustained increases of intracellular calcium necessary for optimal B cell activation. Fluo-4 NW calcium assay was performed to compare the abilities of glycopolymers 450k-40 and the control polymer 450k to elicit calcium flux to the cytosol. Incubation with the control polymer was not able to induce much Ca2+ response while strong Ca2+ flux was observed in cells incubated with 450k-40 (Figure 4). When B cells were incubated with 450k-40 for 30 hours and subsequently stimulated again with the same glycopolymer, a more pronounced Ca2+ flux was observed suggesting prior exposure of B cells to the glycopolymers could lead to stronger activation of the cells.
Figure 4.
Calcium flux curves of no cells; naïve B cells incubated with 450k polymer; naïve B cells incubated with 450k-40 glycopolymer, and B cells pre-activated with 450k-40 (Tn 8.4 μM) glycopolymer incubated subsequently with 450k-40 as detected by the fluo-4 NW dye. The experiments were performed three times. Representative curves are shown.
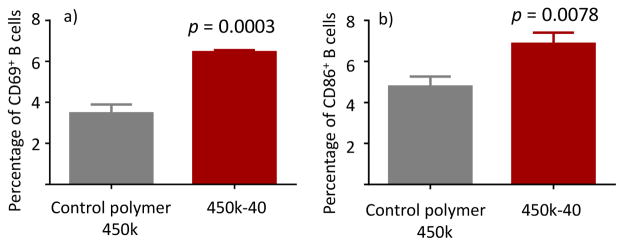
CD69 is known as an activation inducer molecule,38 whose expression is an indicator of leukocyte activation.39 CD86 is another cell surface marker for activated B cells that play important signaling roles.40 Naïve mouse B cells were treated with either control polymer or 450k-40 and the levels of CD69 and CD86 expression were analyzed by flow cytometry (Figure 5). The 450k-40 group showed much enhanced expression of CD69 and CD86 as compared with the control group. The combined results on induction of BCR aggregation, increase of Ca2+ flux and upregulation of CD69/CD86 confirm the abilities of 450k-40 glycopolymer to activate B cells.
Figure 5.
Percentages of (a) CD69+ or (b) CD86+ B cells incubated with either control polymer 450k or 450k-40 as determined by flow cytometry. Higher percentages of cells treated with 450k-40 are CD69 and CD86 positive. Statistical analysis was performed using Student’s t test.
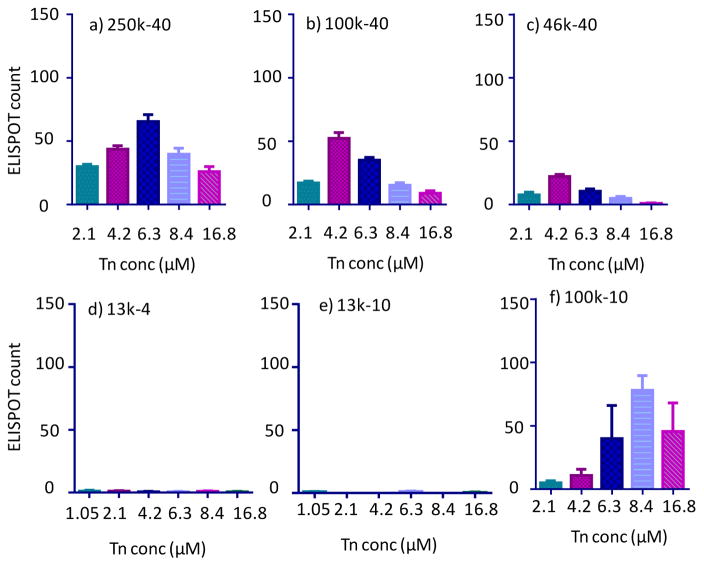
With the ability of 450k-40 glycopolymer to elicit B cell activation established, we examined the effects of antigen density of glycopolymer on cellular activation. The role of antigen density has been investigated using scaffolds such as proteins or virus like particles by varying the average number of epitopes attached.41, 42 The prior approaches, however, simultaneously alter antigen valency, which complicates analysis. The polymer platform enables us to probe the density effect while maintaining the same valency. The abilities of glycopolymers 450k-40, 250k-40, 100k-40 and 46k-40 to activate B cells were compared. As the molecular weight of the glycopolymer backbone decreased, the number of Tn specific ASCs also decreased as determined by ELISPOT (Figures 1d and 6a–c). While 46k-40 could induce anti-Tn antibodies (Figure 6c), the highest average number of ASCs per ELISPOT well was ~20% of those induced by the 450k-40 glycopolymer.
Figure 6.
ELISPOT of B cells incubated with a) 250k-40, b) 100k-40, c) 46k-40; d) 13k-4; e) 13k-10; and f) 100k-10 at varying Tn concentrations.
With the lower molecular weight polymers such as 46k-40, the Tn would be more densely packed with smaller inter-residue distances as compared to 450k-40. In a completely extended conformation of the 46k-40 polymer, the average spacing between the Tn antigen is around 3 nm assuming ideal sp3 hybridization of polymer backbone carbon atoms and C-C bond length of 0.15 nm. The Y shaped BCR is approximately 10 nm wide.43 Thus, the Tn molecules in the 46k-40 glycopolymer are presumably too close together for effective clustering of BCRs for potent B cell activation. A similar conclusion could be drawn from the comparison of the ELISPOT results from 13k-10 glycopolymer with those from 100k-10 glycopolymer (Figures 6e vs 6f). These steric crowding effects have been observed in study of self-assembled monolayer of glycans where enzymes and lectins actually bound more weakly to surfaces with higher glycan densities.44, 45
Besides antigen density, valency is also crucial in B cell activation and antibody induction. The 100k-40 and 13k-4 glycopolymers have similar Tn spacing. Yet the longer 100k-40 polymer was able to activate B cells with medium activities, while cells incubated with the 13k-4 glycopolymer did not produce antibodies at all (Figures 6b vs 6d). This indicates despite the suitable Tn density in 13k-4, its valency may be too low and presumably could not cluster sufficient number of BCRs to activate B cells for antibody production. The 100k-10 polymer, which elicited ASCs, has similar Tn density as 450k-40 (Figures 6f vs 1d). Coupled with the observations that 450k-10 glycopolymer but not 450k-4 and 450k-6 could induce antibodies (Figures 1a–c), these results suggest the threshold valency would be more than 6 glycans per chain. The optimum antigen spacing is around 24 nm in an extended conformation (calculated based on 100k-10 and 450k-40 polymers).
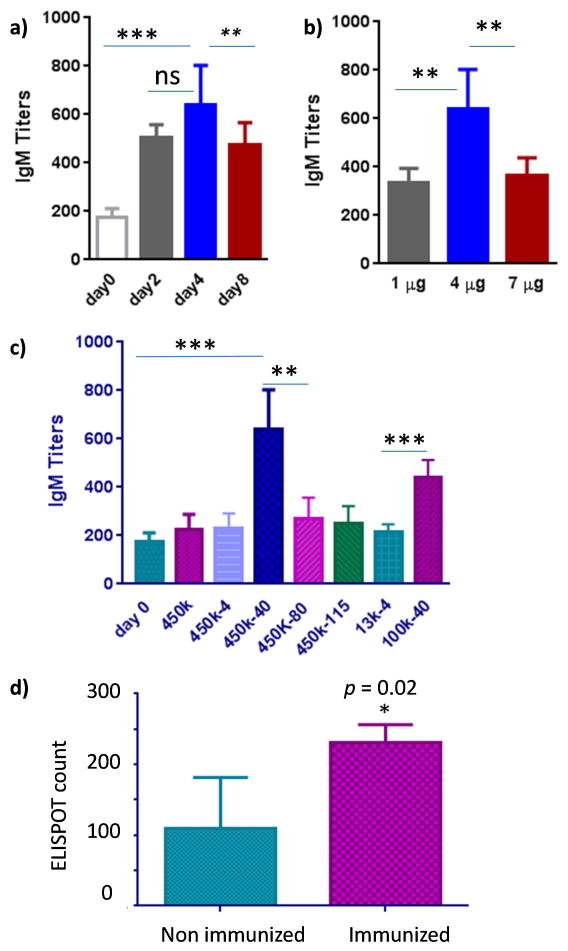
With B cell activation by 450k-40 glycopolymer established in vitro, abilities of this glycopolymer to induce antibodies were evaluated in vivo. The kinetics of IgM antibody generation and optimum dose were investigated first. Mice were immunized with glycopolymer 450k-40 at 4 μg Tn level and sera were obtained from mice 2, 4 and 8 days post inoculation. The amounts of anti-Tn IgM antibodies were determined via enzyme-linked immunosorbent assay (ELISA) with day 4 sera giving highest average antibody titers (Figure 7a). Mice were then inoculated with 450k-40 at 1, 4 and 7 μg of Tn dose respectively. The highest IgM titers were obtained at the 4 μg of Tn (Figure 7b).
Figure 7.
a) Anti-Tn IgM titers of mice vaccinated with 450k-40 glycopolymer (Tn 4 μg), prior to immunization (day 0), 2, 4 and 8 days post immunization (Statistical analysis was performed using Student’s t test. ns = nonsignificant; ** p < 0.01). The average IgM titers were highest at day 4; b) Anti-Tn IgM titers of mice vaccinated with 450k-40 glycopolymer at doses of 1, 4 and 7 μg of Tn (Statistical analysis was performed using Student’s t test. ** < 0.01). Blood was collected on day 4 after immunization. 4 μg Tn dose gave the highest average IgM titers; c) Anti-Tn IgM titers of mice vaccinated with 450k polymer and various glycopolymers (Tn 4 μg) at day 4 after immunization. Consistent with in vitro results, 100k-40 and 450k-40 gave the highest average titers (Statistical analysis was performed using Student’s t test. The p value for 450k-40 vs day 0 is *** p = 0.0002, vs 450k-80 is ** 0.002; The p value for 100k-40 vs 13k-4 is *** p = 0.0002). d) ELISPOT of spleen cells (8 × 10⁵ cells per well) from non-immunized and 450k-40 immunized mice upon incubation with 450k-40 (Tn 8.4 μM) glycopolymer. Statistical analysis was performed using Student’s t test (* p = 0.02).
The abilities of 450k polymer and various glycopolymers (all at 4 μg of Tn doses) to induce anti-Tn antibodies were compared next in vivo. Consistent with in vitro results (Figure 1), 450k-40 was able to generate significantly more anti-Tn IgM antibodies than all other glycopolymers as well as the control polymer, and the 100k-40 glycopolymer was more potent than 13k-4 (Figure 7c). Spleen cells were harvested from 450k-40 immunized mice and analyzed by ELISPOT. Higher numbers of ASCs were detected in immunized mice further confirming the ability of glycopolymer 450k-40 in inducing the activation of Tn-specific B cells in vivo (Figure 7d).
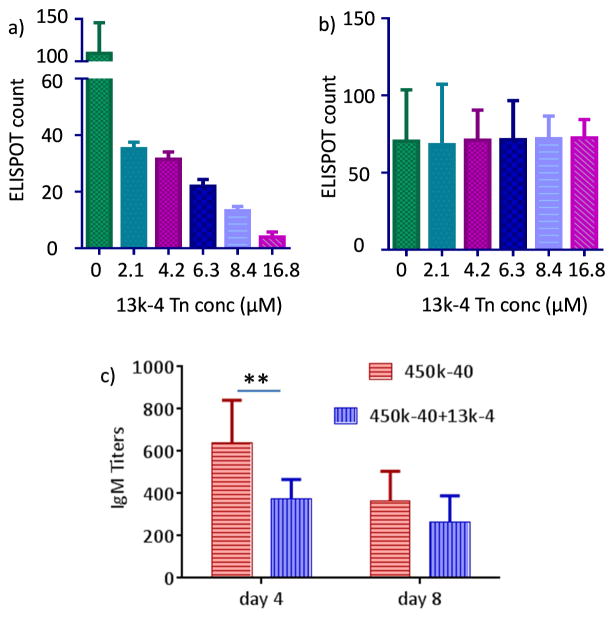
It is known that ligand binding to B cells can induce either activation or tolerance.11, 46 While 13k-4 could not activate ASCs (Figures 6d and 7c), its impact on ASC activation and antibody generation by 450k-40 glycopolymer was examined in vitro and in vivo. Spleen B cells were incubated with 450k-40 polymer at 8.4 μM Tn concentration in the presence of vary concentrations of 13k-4 glycopolymers for 4 days and subjected to ELISPOT assay. 13k-4 at 2.1 μM Tn reduced the number of ASCs by more than 60% (Figure 8a). With increasing concentrations of 13k-4 polymer, the number of Tn specific ASCs decreased further. In comparison, 13k-4 glycopolymer did not have any effects on ASC generation against another antigen, wheat germ agglutinin (Figure 8b). This suggests the 13k-4 glycopolymer selectively induced non-responsiveness of Tn specific B cells. The suppressive effect of 13k-4 was confirmed in vivo. Co-administration of 13-4 with 450-40 glycopolymer into mice reduced the titers of anti-Tn IgM antibodies at both 4 and 8 days post immunization despite the increase in total amounts of Tn administered (Figure 8c).
Figure 8.
a) Addition of increasing concentrations of 13k-4 to B cells incubated with 450k-40 glycopolymer (8.4 μM Tn concentration) suppressed the generation of Tn specific ASCs; b) Addition of 13k-4 to B cells incubated with wheat germ agglutinin (1 μg/mL) did not have any significant effects on wheat germ agglutinin specific ASCs. c) Co-administration of 450k-40 (Tn 4 μg) and 13k-4 (Tn 1 μg) to mice significantly reduced IgM titers compared to mice receiving 450k-40 (Tn 4 μg) only. Blood was collected on day 4 and day 8 following immunization. Statistical analysis was performed using Student’s t test (** p < 0.01). These results suggest 13k-4 glycopolymer selectively induced non-responsiveness of Tn specific ASCs.
B cells can become non-responsive and/or tolerant towards an antigen through a variety of mechanisms including hypercrosslinking of BCRs,31, 32 clonal anergy or deletion,47, 48 suppressive activities of regulatory T cells49, 50 and anti-idiotypic antibodies.51, 52 In the case of 13k-4 glycopolymer, it probably competitively bound with BCRs of Tn specific B cells and disrupted the formation of multivalent BCR complexes with the 450k-40 glycopolymer. As Tn is a self-antigen, there are potential concerns that too strong an immune response elicited by vaccination could lead to auto-immune complications. Suitably designed glycopolymers could provide a new tool to modulate activation and tolerance of Tn specific B cells.
In summary, while glycopolymers have been applied in immunization studies,53–56 this is the first time a series of synthetic glycopolymers with defined length and number of carbohydrate antigen Tn have been utilized to decipher the codes of antigen valency and density on T cell independent B cell activation. With the 450 kDa polymer, bell shaped ASC responses were found depending on the number of antigen per chain. The glycopolymer containing 40 copies of Tn per chain resulted in highest Tn specific ASC proliferation. When the Tn valency was maintained at 40, increasing the antigen density by shortening the polymer length led to significant reduction of antibody responses. This suggests over-crowding of antigens is detrimental to B cell activation. The valency of the polymer is another critical parameter with a threshold value above 6 to induce Tn specific antibodies. In addition, our results show that fine-tuning of the glycopolymer structures can also lead to Tn specific B cell non-responsiveness, which could be an intriguing approach to modulate anti-glycan immune responses.
The abilities of suitable glycopolymers to activate B cells were confirmed by B cell activation events including BCR clustering, Ca2+ flux into cytoplasm and upregulation of CD69/CD86 on B cell surface. Furthermore, their in vitro activities were extended in vivo by inducing Tn specific antibodies in mice. The in vitro B cell assays could be a useful approach to triage vaccine constructs prior to the time consuming in vivo studies. The current study focused on the production of IgM antibodies, which are generally the first type of antibodies secreted upon vaccination. The expansion of IgM secreting ASCs as a result of glycopolymer inoculation could increase the frequency of Tn specific B cells to better prime the immune system towards IgG responses.
Besides anti-cancer vaccines, glycoconjugate antigens are important in the development of anti-HIV and anti-bacterium vaccines.57–59 While the current study only focused on Tn, the principles established here could have implications in guiding the design of effective glycan based vaccine constructs targeting a variety of important diseases.
Supplementary Material
Figure S1. Viability of EA.hy 926 cells upon incubation with various concentrations of 450k-40 polymer and 450k polymer (the same polymer concentration as 450k-40) for 48 hours. The cell viability was determined by the CytoTox 96 Non-radioactive cytotoxicity assay.
Figure S2. Percentage of Tn-specific splenic B cells upon incubation with 450k, 450k-6 (Tn 2.1 μM), 450k-10 (Tn 1.05 μM, 2.1 μM), 450k-40 (Tn 6.3 μM, 8.4 μM), 450k-60 (Tn 8.4 μM), 450k-80 (Tn 4.2 μM), 450k-115 (Tn 6.3 μM) as determined by FACS analysis. Statistical analysis was performed using Student’s t test. *** p = 0.0002 450k-10 Tn 1.05 μM vs. 450k; **** p < 0.0001 450k-10 Tn 1.05 μM, 450k-10 Tn 2.1 μM, 450k-40 Tn 6.3 μM, 450k-40 Tn 8.4 μM vs. 450k; ** p < 0.005 450k-60, 450k-80 vs. 450k.
Table S1. a) Summary of hydrodynamic diameters and zeta potential of glycopolymers bearing 450kDa backbones in cell culture media as measured by dynamic light scattering. b) Hydrodynamic diameters of 450k-80 and 450k-115 glycopolymers at various concentrations. These similar hydrodynamic diameter and zeta potential values suggested that these glycopolymers had similar physical properties and there were no aggregations under the experimental conditions.
Acknowledgments
We are grateful to the National Cancer Institute (R01CA149451 and R03AI111054 to XH) and American Cancer Society (RSG-12-170-01-LIB to KMH) for financial support of this work. We would like to thank Prof. Laura Kiessling (Univ. of Wisconsin) for the helpful discussions and suggestions.
Footnotes
The authors declare there are no actual, potential, or perceived conflicts of interests.
Electronic supplementary information available: Glycopolymer characterization, cell viability results and statistical analysis of Tn specific B cells.
Publisher's Disclaimer: This is a PDF file of an unedited manuscript that has been accepted for publication. As a service to our customers we are providing this early version of the manuscript. The manuscript will undergo copyediting, typesetting, and review of the resulting proof before it is published in its final citable form. Please note that during the production process errors may be discovered which could affect the content, and all legal disclaimers that apply to the journal pertain.
References
- 1.Danishefsky SJ, Allen JR. Angew Chem Int Ed. 2000;39:836–863. doi: 10.1002/(sici)1521-3773(20000303)39:5<836::aid-anie836>3.0.co;2-i. [DOI] [PubMed] [Google Scholar]
- 2.Guo ZW, Wang QL. Curr Opin Chem Biol. 2009;13:608–617. doi: 10.1016/j.cbpa.2009.08.010. [DOI] [PMC free article] [PubMed] [Google Scholar]
- 3.Buskas T, Thompson P, Boons GJ. Chem Commun. 2009:5335–5349. doi: 10.1039/b908664c. [DOI] [PMC free article] [PubMed] [Google Scholar]
- 4.Yin Z, Huang X. J Carbohydr Chem. 2012;31:143–186. doi: 10.1080/07328303.2012.659364. and references cited therein. [DOI] [PMC free article] [PubMed] [Google Scholar]
- 5.Livingston PO, Wong GYC, Adluri S, Tao Y, Padavan M, Parente R, Hanlon C, Calves MJ, Helling F, Ritter G, Oettgen HF, Old LJ. J Clin Oncol. 1994;12:1036–1044. doi: 10.1200/JCO.1994.12.5.1036. [DOI] [PubMed] [Google Scholar]
- 6.Jones PC, Sze LL, Liu PY, Morton DL, Irie RF. J Nat Cancer Inst. 1981;66:249–254. [PubMed] [Google Scholar]
- 7.Hirasawa Y, Kohno N, Yokoyama A, Kondo K, Hiwada K, Miyake M. Am J Respir Crit Care Med. 2000;161:589–594. doi: 10.1164/ajrccm.161.2.9905028. [DOI] [PubMed] [Google Scholar]
- 8.Hamanaka Y, Suehiro Y, Fukui M, Shikichi K, Imai K, Hinoda Y. Int J Cancer. 2003;103:97–100. doi: 10.1002/ijc.10801. [DOI] [PubMed] [Google Scholar]
- 9. [Accessed January 2016]; http://www.fda.gov/NewsEvents/Newsroom/PressAnnouncements/ucm437460.htm.
- 10.Mond JJ, Lees A, Snapper CM. Annu Rev Immunol. 1995;13:655–692. doi: 10.1146/annurev.iy.13.040195.003255. [DOI] [PubMed] [Google Scholar]
- 11.Harwood NE, Batista FD. Annu Rev Immunol. 2010;28:185–210. doi: 10.1146/annurev-immunol-030409-101216. [DOI] [PubMed] [Google Scholar]
- 12.Bachmann MF, Hengartner H, Zinkernagel RM. Eur J Immunol. 1995;25:3445–3451. doi: 10.1002/eji.1830251236. [DOI] [PubMed] [Google Scholar]
- 13.Bachmann MF, Rohrer UH, Kundig TM, Burki K, Hengartner H, Zinkernagel RM. Science. 1993;262:1448–1451. doi: 10.1126/science.8248784. [DOI] [PubMed] [Google Scholar]
- 14.Vos Q, Lees A, Wu ZQ, Snapper CM, Mond JJ. Immunol Rev. 2000;176:154. doi: 10.1034/j.1600-065x.2000.00607.x. [DOI] [PubMed] [Google Scholar]
- 15.Avalos AM, Ploegh HL. Front Immunol. 2014;5:92. doi: 10.3389/fimmu.2014.00092. [DOI] [PMC free article] [PubMed] [Google Scholar]
- 16.Avalos AM, Bilate AM, Witte MD, Tai AK, He J, Frushicheva MP, Thill PD, Meyer-Wentrup F, Theile CS, Chakraborty AK, Zhuang X, Ploegh HL. J Exp Med. 2014;211:365–379. doi: 10.1084/jem.20131603. [DOI] [PMC free article] [PubMed] [Google Scholar]
- 17.Kim YM, Pan JY, Korbel GA, Peperzak V, Boes M, Ploegh HL. Proc Natl Acad Sci USA. 2006;103:3327–3210. doi: 10.1073/pnas.0511315103. [DOI] [PMC free article] [PubMed] [Google Scholar]
- 18.Minguet S, Dopfer E, Schamel WWA. Int Immunol. 2010;22:205–212. doi: 10.1093/intimm/dxp129. [DOI] [PubMed] [Google Scholar]
- 19.Dintzis RZ, Middleton MH, Dintzis HM. J Immunol. 1983;131:2196–2203. [PubMed] [Google Scholar]
- 20.Dintzis RZ, Okajima M, Middleton MH, Greene G, Dintzis HM. J Immunol. 1989;143:1239–1244. [PubMed] [Google Scholar]
- 21.Dintzis HM, Dintzis RZ, Vogelstein B. Proc Natl Acad Sci USA. 1976;73:3671–3675. doi: 10.1073/pnas.73.10.3671. [DOI] [PMC free article] [PubMed] [Google Scholar]
- 22.Puffer EB, Pontrello JK, Hollenbeck JJ, Kink JA, Kiessling LL. ACS Chem Biol. 2007;2:252–262. doi: 10.1021/cb600489g. [DOI] [PubMed] [Google Scholar]
- 23.Lunn MP, Johnson LA, Fromholt SE, Itonori S, Huang J, Vyas AA, Hildreth JE, Griffin JW, Schnaar RL, Sheikh KA. J Neurochem. 2000;75:404–412. doi: 10.1046/j.1471-4159.2000.0750404.x. [DOI] [PubMed] [Google Scholar]
- 24.Leyva A, Quintana A, Sánchez M, Rodríguez EN, Cremata J, Sánchez JC. Biologicals. 2008;36:134–141. doi: 10.1016/j.biologicals.2007.09.001. [DOI] [PubMed] [Google Scholar]
- 25.Yin Z, Nguyen HG, Chowdhury S, Bentley P, Bruckman MA, Miermont A, Gildersleeve JC, Wang Q, Huang X. Bioconjugate Chem. 2012;23:1694–1703. doi: 10.1021/bc300244a. [DOI] [PMC free article] [PubMed] [Google Scholar]
- 26.Springer GF. Science. 1984;224:1198–1206. doi: 10.1126/science.6729450. [DOI] [PubMed] [Google Scholar]
- 27.Springer GF. J Mol Med. 1997;75:594–602. doi: 10.1007/s001090050144. [DOI] [PubMed] [Google Scholar]
- 28.Hou S, Sun XL, Dong CM, Chaikof EL. Bioconjuate Chem. 2004;15:954–959. doi: 10.1021/bc0499275. [DOI] [PubMed] [Google Scholar]
- 29.Treat ND, Ayres NA, Boyes SG, Brittain WJ. Macromolecules. 2006;39:26–29. [Google Scholar]
- 30.Yin Z, Wright WS, McKay C, Baniel C, Kaczanowska K, Bentley P, Gildersleeve JC, Finn MG, BenMohamed L, Huang X. ACS Chem Biol. 2015;10:2364–2372. doi: 10.1021/acschembio.5b00406. [DOI] [PMC free article] [PubMed] [Google Scholar]
- 31.Parry SL, Hasbold J, Holman M, Klaus GG. J Immunol. 1994;152:2821–2829. [PubMed] [Google Scholar]
- 32.Mayumi M, Ohshima Y, Hata D, Kim KM, Heike T, Katamura K, Furusho K. Crit Rev Immunol. 1995;15:255–269. doi: 10.1615/critrevimmunol.v15.i3-4.40. [DOI] [PubMed] [Google Scholar]
- 33.Batista FD, Iber D, Neuberger MS. Nature. 2001;411:489–494. doi: 10.1038/35078099. [DOI] [PubMed] [Google Scholar]
- 34.Thyagarajan R, Arunkumar N, Song W. J Immunol. 2003;170:6099–6106. doi: 10.4049/jimmunol.170.12.6099. [DOI] [PubMed] [Google Scholar]
- 35.Unanue ER, Perkins WD, Karnovsky MJ. J Exp Med. 1972;136:885–897. doi: 10.1084/jem.136.4.885. [DOI] [PMC free article] [PubMed] [Google Scholar]
- 36.Lewis RS. Annu Rev Immunol. 2001;19:497–521. doi: 10.1146/annurev.immunol.19.1.497. [DOI] [PubMed] [Google Scholar]
- 37.Scharenberg AM, Humphires LA, Rawlings DJ. Nat Rev Immunol. 2007;7:778–789. doi: 10.1038/nri2172. [DOI] [PMC free article] [PubMed] [Google Scholar]
- 38.Cebrián M, Yague E, Rincón M, López-Botet M, de Landázuri M, Sánchez-Madrid F. J Exp Med. 1988;168:1621–1637. doi: 10.1084/jem.168.5.1621. [DOI] [PMC free article] [PubMed] [Google Scholar]
- 39.Vazquez BN, Laguna T, Carabana J, Krangel MS, Lauzurica P. J Immunol. 2009;183:6513–6521. doi: 10.4049/jimmunol.0900839. [DOI] [PMC free article] [PubMed] [Google Scholar]
- 40.Jeannin P, Delneste Y, Lecoanet-Henchoz S, Gauchat JF, Ellis J, Bonnefoy JY. J Biol Chem. 1997;272:15613–15619. doi: 10.1074/jbc.272.25.15613. [DOI] [PubMed] [Google Scholar]
- 41.Cherukuri A, Cheng PC, Sohn HW, Pierce SK. Immunity. 2001;14:169–179. doi: 10.1016/s1074-7613(01)00098-x. [DOI] [PubMed] [Google Scholar]
- 42.Yin Z, Comellas-Aragones M, Chowdhury S, Bentley P, Kaczanowska K, BenMohamed L, Gildersleeve JC, Finn MG, Huang X. ACS Chem Biol. 2013;8:1253–1262. doi: 10.1021/cb400060x. [DOI] [PMC free article] [PubMed] [Google Scholar]
- 43.Reth M. Nature Immunol. 2013;14:765–767. doi: 10.1038/ni.2621. [DOI] [PubMed] [Google Scholar]
- 44.Houseman BT, Mrksich M. Angew Chem Int Ed. 1999;38:782–785. doi: 10.1002/(SICI)1521-3773(19990315)38:6<782::AID-ANIE782>3.0.CO;2-N. [DOI] [PubMed] [Google Scholar]
- 45.Grant CF, Kanda V, Yu H, Bundle DR, McDermott MT. Langmuir. 2008;24:14125–14132. doi: 10.1021/la8026489. [DOI] [PubMed] [Google Scholar]
- 46.Basten A, Silveira PA. Curr Opin Immunol. 2010;22:566–574. doi: 10.1016/j.coi.2010.08.001. [DOI] [PubMed] [Google Scholar]
- 47.Haniuda K, Nojima T, Ohyama K, Kitamura D. J Immunol. 2011;186:5620–5628. doi: 10.4049/jimmunol.1100213. [DOI] [PubMed] [Google Scholar]
- 48.Coleman AS, Akkoyunlu M. J Infect Dis. 2013;207:872–873. doi: 10.1093/infdis/jis770. [DOI] [PubMed] [Google Scholar]
- 49.Baker PJ, Amsbaugh DF, Stashak PW, Caldes G, Prescott B. J Immunol. 1982;128:1059–1062. [PubMed] [Google Scholar]
- 50.Jandinski JJ, Scott DW. J Immunol. 1979;123:2447–2450. [PubMed] [Google Scholar]
- 51.Fernandez C, Möller G. Proc Natl Acad Sci USA. 1979;76:5944–5947. doi: 10.1073/pnas.76.11.5944. [DOI] [PMC free article] [PubMed] [Google Scholar]
- 52.Lehle G, Weiler E. Eur J Immunol. 1985;15:580–586. doi: 10.1002/eji.1830150610. [DOI] [PubMed] [Google Scholar]
- 53.Lipinski T, Kitov PI, Szpacenko A, Paszkiewicz E, Bundle DR. Bioconjugate Chem. 2011;22:274–281. doi: 10.1021/bc100397b. [DOI] [PubMed] [Google Scholar]
- 54.Nuhn L, Hartmann S, Palitzsch B, Gerlitzki B, Schmitt E, Zentel R, Kunz H. Angew Chem Int Ed. 2013;52:10652–10656. doi: 10.1002/anie.201304212. [DOI] [PubMed] [Google Scholar]
- 55.Parry AL, Clemson NA, Ellis J, Bernhard SSR, Davis BG, Cameron NR. J Am Chem Soc. 2013;135:9362–9365. doi: 10.1021/ja4046857. [DOI] [PMC free article] [PubMed] [Google Scholar]
- 56.Qin Q, Yin Z, Bentley P, Huang X. Med Chem Commun. 2014;5:1126–1129. doi: 10.1039/C4MD00103F. [DOI] [PMC free article] [PubMed] [Google Scholar]
- 57.Horiya S, MacPherson IS, Krauss IJ. Nat Chem Biol. 2014;10:990–999. doi: 10.1038/nchembio.1685. [DOI] [PMC free article] [PubMed] [Google Scholar]
- 58.Astronomo RD, Burton DR. Nat Rev Drug Disc. 2010;9:309–324. doi: 10.1038/nrd3012. [DOI] [PMC free article] [PubMed] [Google Scholar]
- 59.Wang LX. Curr Opin Chem Biol. 2013;17:997–1005. doi: 10.1016/j.cbpa.2013.10.001. [DOI] [PMC free article] [PubMed] [Google Scholar]
Associated Data
This section collects any data citations, data availability statements, or supplementary materials included in this article.
Supplementary Materials
Figure S1. Viability of EA.hy 926 cells upon incubation with various concentrations of 450k-40 polymer and 450k polymer (the same polymer concentration as 450k-40) for 48 hours. The cell viability was determined by the CytoTox 96 Non-radioactive cytotoxicity assay.
Figure S2. Percentage of Tn-specific splenic B cells upon incubation with 450k, 450k-6 (Tn 2.1 μM), 450k-10 (Tn 1.05 μM, 2.1 μM), 450k-40 (Tn 6.3 μM, 8.4 μM), 450k-60 (Tn 8.4 μM), 450k-80 (Tn 4.2 μM), 450k-115 (Tn 6.3 μM) as determined by FACS analysis. Statistical analysis was performed using Student’s t test. *** p = 0.0002 450k-10 Tn 1.05 μM vs. 450k; **** p < 0.0001 450k-10 Tn 1.05 μM, 450k-10 Tn 2.1 μM, 450k-40 Tn 6.3 μM, 450k-40 Tn 8.4 μM vs. 450k; ** p < 0.005 450k-60, 450k-80 vs. 450k.
Table S1. a) Summary of hydrodynamic diameters and zeta potential of glycopolymers bearing 450kDa backbones in cell culture media as measured by dynamic light scattering. b) Hydrodynamic diameters of 450k-80 and 450k-115 glycopolymers at various concentrations. These similar hydrodynamic diameter and zeta potential values suggested that these glycopolymers had similar physical properties and there were no aggregations under the experimental conditions.


