

Abstract
Background
Abnormalities of catecholaminergic function have been hypothesised in causation of depressive illness. Electroconvulsive therapy (ECT) is postulated to have noradrenergic mechanism of action. We studied the clinical utility of estimating catecholamines level changes after ECT.
Methods
Plasma adrenaline, noradrenaline and dopamine in healthy controls and depressed patients were estimated by high performance liquid chromatography with electrochemical detection method before and after ECT.
Result
Mean ± standard deviation of plasma adrenaline, noradrenaline and dopamine in controls was 36.7 ± 13.2, 209.3 ± 76, 21.8 ± 9.5 ng/L respectively, while in depressed patients before and after ECT it was found to be 32.5 ± 12.0, 419.3 ± 167.7, 22.1 ± 16.0ng/ L and 37.2 ± 19.6, 386.1 ± 168.4, 22.3 ± 15.5ng/L respectively. Correlation of adrenaline, noradrenaline and dopamine concentration with scores of Beck Depression Inventory, Suicidal Ideation Scale and Melancholia Inventory was positive but statistically not significant and poor. Based on the cut off values of noradrenaline, only 62% cases could be categorized as abnormal, which after ECT reduced to 50%, whereas post ECT psychiatric ratings was normal in about 78% cases.
Conclusion
There is no clinical significance of estimating adrenaline, noradrenaline and dopamine in depressed patients.
Key Words: Electroconvulsive therapy, Adrenaline, Noradrenaline, Dopamine, Psychiatric scales
Introduction
Electroconvulsive (ECT) is generally used in severely depressed patients for whom psychotherapy and medication have been ineffective or when there is an imminent risk of suicide. The mechanism of the antidepressant action of ECT remains unknown [1],
An increase in extracellular noradrenaline concentrations in the brain has been reported after ECT [2]. It is reported that plasma noradrenaline levels were initially high in mentally depressed patients and fell with ECT in a manner paralleling clinical recovery, suggesting that plasma noradrenaline may be a useful index of central changes during antidepressant treatment of ECT [3]. Noradrenergic function abnormalities have been reported in depressive illness [4], while ECT has is presumed to have noradrenergic mechanism of action [1].
This study was undertaken to measure plasma noradrenaline, adrenaline and dopamine levels in healthy controls and depressed patients by reference high performance liquid chromatography (HPLC) with electrochemical detection method, before and after ECT. We correlated these levels with clinical outcome in patients.
Material and Methods
The sample study included fifty patients with depressive disorders (ICD — 10 categories F31.3, 31.4, 31.5, F32, F33) attending civil OPD and or admitted to Command Hospital (SC) Pune for depression and then referred for ECT treatment. Age and sex matched healthy controls without past or family history of psychiatric disorders constituted the controls. Patients suffering from any co-morbid physical or psychiatric disorders were excluded.
All the patients underwent physical examination, mental status examination, Beck Depression Inventory (BDI), Suicidal Ideation Scale (SIS) and Melancholia Inventory (MIn) assessment. Blood urea, serum creatinine and skull radiograph were carried out as a routine procedure. Blood samples of the selected subjects who were referred for ECT were collected before first ECT (referred as pre-ECT sample) and after five ECTs, i. e. before sixth ECT (referred as Post ECT sample), in a heparin vacutainer without any preservatives/antioxidants as recommended by Boomsma et al [5] and DeAlesandro et al [6] and transported at 4°C for estimation of adrenaline (Ad), noradrenaline (NAd) and dopamine (Dp). Plasma was separated immediately by centrifugation, at 2000 rpm for five minutes and stored at -30°C. Plasma Ad, NAd and Dp was estimated within 60 days of storing at -30°C. Plasma samples for control were drawn only once and processed similarly as above.
The patients were followed up and psychiatric evaluation was done to correlate the changes in catecholamines levels with clinical response by repeating BDI, SIS and MIn for depression after completion of ECT course.
Catecholamines were estimated by reference methodology – HPLC with electrochemical detection [7, 8, 9, 10, 11, 12, 13, 14]. HPLC was carried out on Merck Hitachi LaChrom, Japan (Model No L — 7455) fitted with Interface D-7000 IF and dual pump L-7100. Detection of catecholamines was carried out using ClinLab Digital amperometric detector model EC 3000 from RECIPE chemical and instruments, Germany, catecholamines kit, HPLC column, mobile phase 10L, plasma endocrine controls (normal and pathological) were procured from Chromsystems, Germany.
HPLC column was connected to pump and mobile phase was set at 1 ml/min, column outlet was attached to the cell inlet of detector – EC 3000. Backpressure was only 46 bar indicating column absolutely dust free making it most ideal for the HPLC separation. Detector was set at: 560mV; FILTER: 0.05Hz; CELL TYPE: Passive; RANGE: ±10 (nA); OFFSET: 0.00 (nA); AUTOZERO: Disabled. Base current was +0.13 (nA) only, lower than the permitted 0.3 (nA) making the analysis of Ad, NAd and Dp highly sensitive.
Retention time in minutes was Ad: 5.68 — 5.75; NAd: 6.8 — 7.38, Internal Standard (IS) (DHBA): 9.80 — 9.92; Dp: 15.52 — 15.71. This was very close to the retention times mentioned in the instruction manual.
The conc. C Analyte, Sample in the sample is then calculated by the formula:
where ASample and AStandard are peak areas of substance A (i.e. Ad, NAd and Dp) in chromatogram of sample and calibration standard, ISSample and ISstandard are peak areas of IS in chromatogram of sample and calibration standard resp. Cstandard for Ad, NAd and Dp was 600, 300 and 300 ng/L respectively.
Results
Plasma levels of Ad, NAd and Dp were studied in 33 healthy subjects (normals or controls) and 50 mentally depressed subjects (patients or cases). Comparison between the means of plasma Ad, NAd and Dp, BDI, SIS and MIn score in all the patients before and after ECT is shown in Table 1, while comparison between the means of catecholamines in controls and cases is as shown in Table 2.
Table 1.
Difference of means and significance between pre & post ECT plasma levels of catecholamines and scores of psychiatric scales
| Variable | Pre ECT |
Post ECT |
t-test and significance |
|||
|---|---|---|---|---|---|---|
| Mean (Range) | SD | Mean (Range) | SD | t Value | p Value | |
| Adrenaline (ng/L) | 32.5 13.0 – 56.1) | 12.0 | 37.2 (12.0 – 119.8) | 19.6 | 2.296 | 0.026 |
| Noradrenaline (ng/L) | 419.3 (146.7 – 801.3) | 167.7 | 386.1 (157.5 – 837.1) | 168.4 | 2.806 | < 0.01 |
| Dopamine (ng/L) | 22.14 (0.0 – 89.7) | 16.04 | 22.3 (0.0 – 95.3) | 15.5 | 0.125 | 0.901 |
| Beck Depression Inventory | 29.6 (18.0 – 49.0) | 7.6 | 7.8 (3.0 – 18.0) | 2.9 | 21.36 | < 0.01 |
| Suicidal Ideation Scale | 19.2 (4.0 – 32.0) | 7.4 | 4.6 (1.0 – 9.0) | 2.0 | 15.03 | < 0.01 |
| Melancholia Inventory | 14.8 (8.0 – 22.0) | 4.7 | 3.4 (1.0 – 7.0) | 1.0 | 16.143 | < 0.01 |
Table 2.
Difference of means and significance of plasma levels of adrenaline, noradrenaline and dopamine between cases and controls
| Analytes (ng/L) | Cases (Pre ECT) |
Controls |
t-test & significance |
|||
|---|---|---|---|---|---|---|
| Mean (Range) | SD | Mean (Range) | SD | t Value | p Value | |
| Adrenaline | 32.5 (13.0 – 56.1) | 12.0 | 36.7 (16.2 – 65.8) | 13.2 | 1.478 | 0.143 |
| Noradrenaline | 419.3 (146.7 – 801.3) | 167.7 | 209.3 (80.3 – 358.9) | 76.0 | 7.734 | < 0.01 |
| Dopamine | 22.14 (0.0 – 89.7) | 16.04 | 21.8 (0.0 – 36.8) | 9.5 | 0.092 | 0.927 |
Effect of ECT on scores of BDI, SIS and MIn is shown in (Fig. 1) while on the levels of Ad, NAd and Dp is shown in (Fig. 2). The effect of ECT on scores of BDI and SIS in patients of different grades of severity is shown in (Table 3).
Fig. 1.
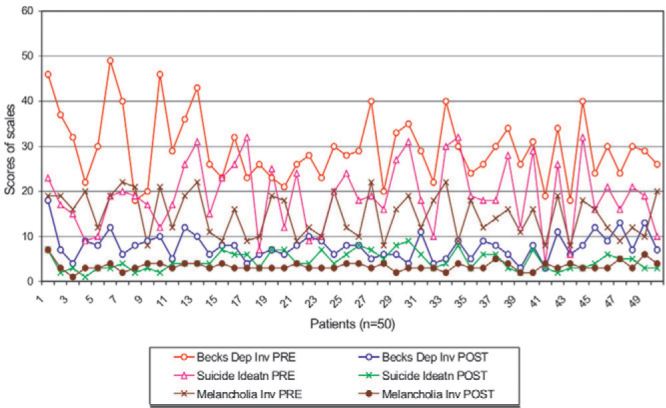
Changes in psychiatric rating scales before and after ECT
Fig. 2.
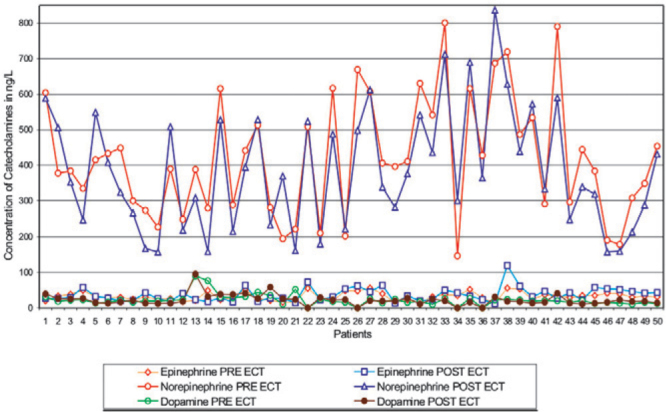
Effect of ECT on the levels of catecholamines in all patients
Table 3.
Effect of ECT on scores of SIS and BDI in patients with different grades of severity
| Scores BDI (0-62) | Number (%) | Number (%) | Scores SIS | Number (%) | Number (%) |
|---|---|---|---|---|---|
| Pre ECT | Post ECT | (0-38) | Pre ECT | Post ECT | |
| Normal 0-9 | 00 | 39 (78) | 0-9 | 5 (10) | 50 (100) |
| Mild to moderate 10 – 18 | 2 (4) | 11 (22) | 10 – 19 | 19 (38) | 00 |
| Moderate to Severe 19 – 29 | 25 (50) | 00 | 19 – 27 | 18 (36) | 00 |
| Extremely Severe 30-62 | 23 (46) | 00 | 28-38 | 8 (16) | 00 |
| Mean (Range) | 29.6 (18.0 – 49.0) | 7.8 (3.0 – 18.0) | Mean (Range) | 19.2 (4.0 – 32.0) | 4.6 (1.0 – 9.0) |
Correlation between Pre ECT levels of plasma NAd and Pre and Post ECT Scores of BDI (Fig. 3) as well as between Post ECT levels of plasma NAd and Pre and Post ECT Scores of BDI (Fig. 4) was positive but statistically not significant. Correlation between Pre ECT score of BDI and Pre and Post ECT levels of plasma Dp in all the patients was found to have R2 equal to 0.0276 and 0.0157 respectively. Correlation between Pre and Post ECT levels of plasma NAd levels in all the patients resulted in R2 = 0.7663, p= 0.001.
Fig. 3.
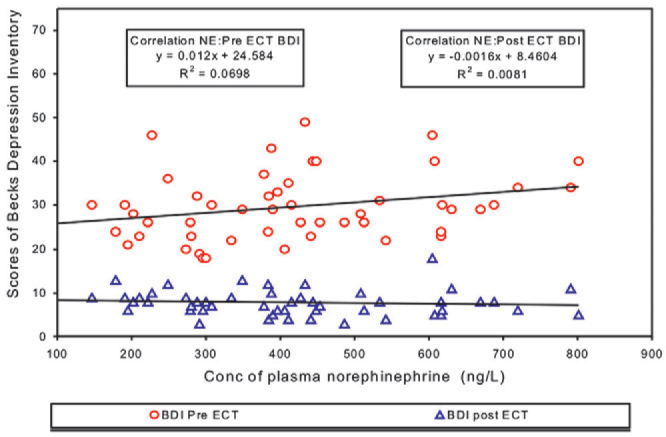
Correlation between Pre ECT plasma noradrenaline and scores of Pre & Post ECT Beck Depression Inventory
Fig. 4.
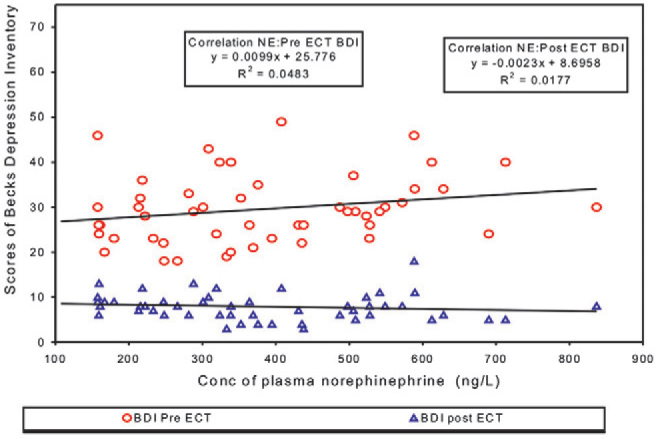
Correlation between Post ECT plasma noradrenaline and scores of BDI Pre & Post ECT
Out of 50 patients, 13 showed increased levels of NAd while remaining 37 showed decreased levels after ECT. Based on this effect of ECT on NAd, patients were divided into two groups: Group I (37 patients) which showed decreased NAd, (Mean ± SD before ECT was 418.8 ± 167.7 ng/L as compared to post ECT value of 344.7 ± 150.2 ng/L); Group II of 13 patients which showed increased NAd after ECT, (Mean ± SD before ECT was 421.87 ± 174.8 ng/L as compared to post ECT value of 503.9 ± 166.6 ng/L).
Discussion
Severity of depression assessed by BDI and SIS revealed that 50% cases had moderate to severe depression, 46% cases had extremely severe depression and 52% cases had SIS score of more than 18 on a scale of 38, indicating greater intention for suicide. After completion of ECT course there was significant decrease in the score. The mean ± SD of post ECT score of BDI, SIS and MIn (7.8 ± 2.9, 4.6 ± 2.0 and 3.4 ± 1.0 respectively) was significantly lower (p<0.01), than their corresponding pre ECT scores (29.6 ± 7.6, 19.2 ± 7.4 and 14.8 ± 4.7 respectively). Analysis of post ECT BDI revealed that 78% of all cases became normal (score < 9) while remaining 22% cases became mild to moderate (score between 10-18). The post ECT SIS score also decreased to less than 9, indicating normal in all 50 cases (100%) (Table 3). The post ECT score of all three scales were found decreased to almost normal score irrespective of pre ECT scores (Fig. 1).
Analysis of plasma Ad, NAd and Dp in patients before and after ECT revealed that only NAd levels decreased significantly (p<0.01) after ECT which is agreement with the findings of Werstiuk et al [15], Kelly & Cooper [3] and Cooper et al [16]. Some workers have reported role of Dp [17, 18, 19], but in our study no changes were seen after ECT, which is in agreement with the findings of Yoshida et al [17] and Mann [18].
Reference value of plasma Ad, NAd and Dp indicated statistically significant difference in NAd levels only between controls and pre ECT levels in patients (209.3 ± 76 in controls versus 419.3 ± 167.7 ng/L in patients before ECT, p< 0.01). No significant difference was noted in Ad and Dp levels between controls and patients. In our study, NAd levels in controls was found slightly higher than the value reported by Werstiuk et al [15] but lower than the value reported by Lake et al [21]. This deference may be due to different technique, different gender and age selection [20] and small sample size.
NAd levels in our study of patients before ECT (419.3 ± 167.7 ng/L) was similar to that reported by Werstiuk et al [15], but slightly lower than the value reported by other workers. The differences could be due to different age, gender, different type and severity of depression. Moreover these studies were on very small number of samples viz [18, 9, 15, 17]. Higher NAd level in patients as compared to normals as well as decrease in NAd level after ECT is in agreement with the existing data [3, 15, 21, 22]. However the percentage by which the ECT lowers the NAd concentration is lower than that mentioned in earlier studies. In addition, not all the patients showed decrease in NAd after ECT, with an increased levels seen in 13 patients (group II). Even most of the earlier studies have mentioned decreased NAd in all the patients but Kelly et al [3] has reported that in some patients of depressive illness plasma NAd increases after ECT thereby which is in agreement with our results. In none of the studies, the NAd concentration decreased to reach the normal mean level even though some patients might be falling within the normal range of NAd.
Pre ECT levels of NAd and Pre and Post ECT Scores of BDI, SIS, MIn yielded a positive but statistically not significant correlation with R2 = 0.069 and 0.0081 (Fig. 3) (p = 0.064 and 0.536), 0.0251 and 0.0013 (p = 0.271 and 0.807), and 0.0762, 0.0054 (p = 0.052 and 0.613) respectively. Even the Post ECT levels of plasma NAd did not correlate statistically with the Pre ECT or Post ECT Scores of BDI, SIS, MIn respectively resulting in R2 = 0.0483 and 0.0177 (Fig. 4) (p = 0.125 and 0.356); 0.0251 and 0.0013 (p = 0.649 & 0.874) and 0.0762 & 0.0054 (p = 0.117 & 0.860). Even in Group I and II no correlation was found between NAd levels and scores of psychiatric scales. Though ECT led to a statistically significant decrease in the concentration of NAd as well as fall in the scores of BDI, SIS, MIn indicating improvement, but none of the psychiatric scale ratings showed any association with the fall in NAd. The percentage by which the ECT was found to lower NAd levels was not appreciable, giving difference of only 33.280 ± 83.862. This finding is not in total agreement with the results of Kelly et al [3] who reported a trend indicating a fall in plasma NAd being associated with improvement in depression rating in the melancholic/psychotic patients only. This could be due to the difference in the psychiatric scale used in our study and the procedure adopted in estimating NAd and psychiatric evaluation. Kelly et al [3] used 17 item Hamilton Rating Scale for Depression (HRSD) and Hamilton Anxiety Scale (HAS). No association was reported between NAd and HRSD in whole group of patients, (p=0.39), (n=17) or for non-melancholic/psychotic subgroup, (p=0.23) (n=7). A trend was noticed only between fall in NAd and HRSD in melancholia/psychotic group consisting of only 10 patients. No statistically significant relationship was found by Kelly [3] between plasma NAd gradient and HAS rating in any of the group.
No statistical correlation was seen between Pre ECT score of BDI, and Pre and Post ECT levels of plasma Dp in all the patients (R2 = 0.0276 & 0.0157 respectively), and between Pre ECT score of BDI and Pre and Post ECT plasma NAd in all the patients (R2 = 0.0698 and 0.0483 resp).
Mean ± SD of NAd in Group I decreased from 418.8 ± 167.7 before ECT to 344.7 ± 150.2 ng/L post ECT, while in Group II 421.87 ± 174.8 was found increased to 503.9 ± 166.6 ng/L after ECT. Both Group I and II were assessed for correlation between the BDI score and pre and post ECT NAd levels. Analysis showed a poor and statistically insignificant correlation between Pre ECT score of BDI and Pre and Post ECT plasma NAd levels in Group I, R2 = 0.0645 and 0.0742, (p= 0.128 and 0.103) and Group II, R2 = 0.1067 and 0976.
Based only on the cut off value of plasma NAd, assuming that all patients of depressive illness have increased levels of NAd, McNemar Test was conducted to see the normal/abnormal status of all the 50 patients. All the 50 patients selected for the study were known cases of depression referred for ECT, but based on the cut off values of biochemical parameter NAd, only 62% cases could be categorized as abnormal by McNemar, which after ECT were reduced to 50% showing improvement in only 12% cases, whereas based on post ECT psychiatric ratings about 78% cases have been found to become normal (Table 3).
We conclude that there is no clinical significance of estimating NAd, Ad or Dp in depression. NAd neither appears to critically differentiate between different types of depressive illness nor it seems to act as a surrogate parameter to indicate clinical improvement in mentally depressed patients.
Conflicts of Interest
This study has been funded by research grants from the O/o DGAFMS.
Intellectual Contribution of Authors
Study Concept : V Ambade
Drafting & Manuscript Revision : V Ambade, Brig MM Arora
Statistical Analysis : D Basannar
Study Supervision : Col P Singh (Retd), B L Somani
References
- 1.Grover S, Mattoo SK, Gupta N. Theories on Mechanism of Action of Electroconvulsive Therapy. German J of Psychiatry. 2005;8:70–84. [Google Scholar]
- 2.Inoue T, Kitaichi Y, Koyama T. Treatment strategy of refractory depression and its presynaptic mechanism of action. Nihon Shinkei Seishin Yakurigaku Zasshi. 2003;23:11–20. [PubMed] [Google Scholar]
- 3.Kelly CB, Cooper SJ. Plasma noradrenaline response to electroconvulsive therapy in depressive illness. Br J Psychiatry. 1997;171:182–186. doi: 10.1192/bjp.171.2.182. [DOI] [PubMed] [Google Scholar]
- 4.Cooper SJ, Kelly CB. Plasma noradrenaline response to a cognitive stressor in subtypes of depressive illness. Hum Psychopharmacol. 2000;15:265–274. doi: 10.1002/1099-1077(200006)15:4<265::AID-HUP170>3.0.CO;2-7. [DOI] [PubMed] [Google Scholar]
- 5.Boomsma F, Alberts G, Van Eijk L. Optimal collection and storage conditions for catecholamine measurements in human plasma and urine. Clin Chem. 1993;39:2503–2508. [PubMed] [Google Scholar]
- 6.DeAlsandro M, Reed H, Robertson R, Lewis S. Simplified methods of collecting and processing whole blood for quantitation of plasma catecholamines. Lab Med. 1990;21:26–29. [Google Scholar]
- 7.Tsunoda M. Recent advances in methods for the analysis of catecholamines & their metabolites. Anal Bioanal Chem. 2006;386:506–514. doi: 10.1007/s00216-006-0675-z. [DOI] [PubMed] [Google Scholar]
- 8.Peaston RT, Weinkove C. Measurement of catecholamines and their metabolites. Ann Clin Biochem. 2004;41:17–38. doi: 10.1258/000456304322664663. [DOI] [PubMed] [Google Scholar]
- 9.Candito M, Billaud E, Chauffert M. Biochemical diagnosis of pheochromocytoma and neuroblastomas. Ann Biol Clin. 2002;60:15–36. [PubMed] [Google Scholar]
- 10.Westermann J, Hubl W, Kaiser N, Salewski L. Simple, rapid and sensitive determination of epinephrine and norepinephrine in urine and plasma by non-competitive enzyme immunoassay, compared with HPLC method. Clin Lab. 2002;48:61–71. [PubMed] [Google Scholar]
- 11.Passarinha LA, Bonif cio MJ, Queiroz JA. The effect of temperature on the analysis of metanephrine for catechol-Omethyltransferase activity assay by HPLC with electrochemical detection. Biomed Chromatogr. 2006;20:937–944. doi: 10.1002/bmc.623. [DOI] [PubMed] [Google Scholar]
- 12.Tareke E, Bowyer JF, Doerge DR. Quantification of rat brain neurotransmitters and metabolites using liquid chromatography/ electrospray tandem mass spectrometry and comparison with liquid chromatography/electrochemical detection. Rapid Commun Mass Spectrom. 2007;21:3898–3904. doi: 10.1002/rcm.3295. [DOI] [PubMed] [Google Scholar]
- 13.Sasaki T, Fukushima T, Ohishi M, Toyo'oka T. Development of a 6-hydroxychroman-based derivatization reagent: application to the analysis of 5-hydroxytryptamine and catecholamines by using high-performance liquid chromatography with electrochemical detection. Biomed Chromatogr. 2008;22:888–899. doi: 10.1002/bmc.1007. [DOI] [PubMed] [Google Scholar]
- 14.Gu Q, Shi X, Xu G. Advances in catecholamine analysis in biological samples. Se Pu. 2007;25:457–462. [PubMed] [Google Scholar]
- 15.Werstiuk ES, Coote M, Griffith L, Shannon H, Steiner M. Effects of electroconvulsive therapy on peripheral adrenoceptors, plasma noradrenaline, MHPG & cortisol in depressed patients. Br J Psychiatry. 1996;169:758–765. doi: 10.1192/bjp.169.6.758. [DOI] [PubMed] [Google Scholar]
- 16.Cooper SJ, Kelly JG, King DJ. Adrenergic receptors in depression: Effects of electroconvulsive therapy. Br J Psychiatry. 1985;147:23–29. doi: 10.1192/bjp.147.1.23. [DOI] [PubMed] [Google Scholar]
- 17.Yoshida K, Higuchi H, Kamata M, Yoshimoto M, Shimizu T, Hishikawa Y. Single and repeated electroconvulsive shocks activate dopaminergic and 5-hydroxytryptaminergic neurotransmission in the frontal cortex of rats Prog Neuropsychopharmacol. Biol Psychiatry. 1998;22:435–444. doi: 10.1016/s0278-5846(98)00015-3. [DOI] [PubMed] [Google Scholar]
- 18.Mann JJ. Neurobiological correlates of the antidepressant action of electroconvulsive therapy. J ECT. 1998;14:172–180. [PubMed] [Google Scholar]
- 19.Yoshida K, Higuchi H, Kamata M, Yoshimoto M, Shimizu T, Hishikawa Y. Dopamine releasing response in rat striatum to single and repeated electroconvulsive shock treatment. Prog Neuropsychopharmacol Biol Psychiatry. 1997;21:707–715. doi: 10.1016/s0278-5846(97)00043-2. [DOI] [PubMed] [Google Scholar]
- 20.Barens RF, Raskind M, Gumbrecht G, Halter JB. The effects of age on the plasma catecholamine response to mental stress in man. J Clin Endo and Metab. 1982;54:64–69. doi: 10.1210/jcem-54-1-64. [DOI] [PubMed] [Google Scholar]
- 21.Lake CR, Picker D, Ziegler MG, Lipper S, Slater S, Murphy DL. High plasma norepinephrine levels in patients with major affective disorder. J Psychiatry. 1982;139:10. doi: 10.1176/ajp.139.10.1315. [DOI] [PubMed] [Google Scholar]
- 22.Siever LJ, Pickar D, Lake CR, Cohen RM, Uhde TW, Murphy DL. Extreme elevation in plasma norepinephrine associated with decreased adrenergic responsitivity in major depressive disorder: two case reports. J Clin Psychopharmacology. 1983;3:39–41. [PubMed] [Google Scholar]