

Abstract
Background
Obstructive sleep apnea (OSA) is the most common cause of resistant hypertension, which has been proposed to result from activation of the renin–angiotensin–aldosterone system (RAAS). We meta-analyzed the effects of OSA on plasma levels of RAAS components.
Methods
Full-text studies published on MEDLINE and EMBASE analyzing fasting plasma levels of at least one RAAS component in adults with OSA with or without hypertension. OSA was diagnosed as an apnea-hypopnea index or respiratory disturbance index ≥ 5. Study quality was evaluated using the Newcastle-Ottawa Scale, and heterogeneity was assessed using the I2 statistic. Results from individual studies were synthesized using inverse variance and pooled using a random-effects model. Subgroup analysis, sensitivity analysis, and meta-regression were performed, and risk of publication bias was assessed.
Results
The meta-analysis included 13 studies, of which 10 reported results on renin (n = 470 cases and controls), 7 on angiotensin II (AngII, n = 384), and 9 on aldosterone (n = 439). AngII levels were significantly higher in OSA than in controls [mean differences = 3.39 ng/L, 95% CI: 2.00–4.79, P < 0.00001], while aldosterone levels were significantly higher in OSA with hypertension than OSA but not with hypertension (mean differences = 1.32 ng/dL, 95% CI: 0.58–2.07, P = 0.0005). Meta-analysis of all studies suggested no significant differences in aldosterone between OSA and controls, but a significant pooled mean difference of 1.35 ng/mL (95% CI: 0.88–1.82, P < 0.00001) emerged after excluding one small-sample study. No significant risk of publication bias was detected among all included studies.
Conclusions
OSA is associated with higher AngII and aldosterone levels, especially in hypertensive patients. OSA may cause hypertension, at least in part, by stimulating RAAS activity.
Keywords: Hypertension, Obstructive sleep apnea, Renin-angiotensin-aldosterone system
1. Introduction
Obstructive sleep apnea (OSA) is a sleep-related breathing disorder characterized by repeated episodes of upper airway occlusion during sleep.[1]–[3] It is the most common cause of resistant hypertension and is observed in 30%−40% of patients with hypertension. In particular, OSA is observed in 60%−70% of patients with resistant hypertension, which increases risk of cardiovascular disease-related morbidity and mortality.[4]–[7] How OSA contributes to hypertension is unclear, with various neurohumoral mechanisms proposed that involve intermittent hypoxia, sympathetic nervous system hyperactivity, activation of the renin-angiotensin-aldosterone system (RAAS), aldosterone-sodium interaction and sodium retention, oxidative stress, or endothelial dysfunction.[8]
RAAS activation is a well-established pathway contributing to hypertension. In the RAAS, renin converts angiotensin into angiotensin I (AngI), which is converted to AngII by angiotensin-converting-enzyme (ACE).[9] AngII binds to the AngII receptor type 1 (AT1), causing an increase in blood pressure. Elevated levels of renin and aldosterone in proximal tubules lead directly to hypertension, and inhibition of ACE, AngII or AT1 can lower blood pressure.[10],[11] In addition, activation of mineralocorticoid receptor, an aldosterone-dependent transcription factor, as a result of oxidative stress or sympathetic to reactivation has been linked to resistant hypertension.[10] Thus blockade of mineralocorticoid receptor can lower blood pressure.[10]
Given that both OSA and RAAS activation occur frequently in patients with resistant hypertension, several studies have examined whether OSA influences the RAAS and thereby contributes to hypertension. Some studies have associated OSA with excess aldosterone. Patients at high risk of OSA are more likely to suffer primary hyperaldosteronism, and risk of OSA is higher in patients with hyperaldosteronism and lower renin activity than in those without hyperaldosteronism.[12],[13] Excess aldosterone leads to edema of nasopharyngeal tissues, including tissues in the upper airway. This leads, in turn, to airway obstruction and exacerbates sleep apnea.[8],[13]–[21] The mineralocorticoid receptor antagonist spironolactone, often used as an add-on anti-hypertensive therapy, can reduce OSA severity by nearly 50% in patients with resistant hypertension.[22]
More systematic investigation of the potential association between OSA and RAAS activity is lacking with most studies assaying plasma levels of only one or two RAAS components, and results of these studies are sometimes conflicting.[4],[23] In order to obtain a more comprehensive understanding of the potential effects of OSA on RAAS, we meta-analyzed available evidence in MEDLINE and EMBASE.
2. Methods
2.1. Eligibility criteria
This meta-analysis was performed following the Preferred Reporting Items for Systematic Reviews and Meta-Analyses (PRISMA) guidelines.[24] We sought to identify all studies that explored the possible relationship between OSA and plasma levels of RAAS components, in the presence or absence of hypertension. Studies in any language and any year of publication were included in the meta-analysis if they: (1) analyzed participants who were at least 18 years old; (2) defined OSA based on a threshold value of at least 5 on the apnea–hypopnea index (AHI)or respiratory disturbance index (RDI), corresponding to at least 5 events measured by polysomnography;[25],[26] (3) reported plasma levels of at least one RAAS component as mean ± SD or median with range; and (4) were available as full text on-line.
2.2. Literature searching
Eligible studies were identified by searching the MEDLINE and EMBASE databases through July 31, 2015. Conference abstracts were not searched, since most abstracts do not provide enough data for meta-analysis. We independently searched the literature databases using keywords related to OSA, sleep disordered breathing and the RAAS. The detailed search strategy is shown in Figure 1.
Figure 1. Literature search strategy.

2.3. Study selection and data extraction
We identified eligible studies independently based on the inclusion criteria, and then independently extracted data from included studies using a predetermined form. Discrepancies in study selection and data extraction were resolved by discussion.
The following data were collected from each study to the extent possible: last name of first author, year of publication, sample size, demographic details of subjects, plasma levels of RAAS components, OSA definition, outcomes and primary results. We also collected data on whether subjects had hypertension or a history of antihypertensive medication since we planned to do subgroup analysis and meta-regression.
2.4. Quality assessment of included studies
We assessed the quality of each included study using the Newcastle-Ottawa Scale (NOS),[27] a tool for evaluating non-randomized studies. This tool evaluates a case-control/cohort study on eight items categorized into three groups: selection of study participants (0–4 stars); comparability of groups (0–2 stars); and ascertainment of exposure or outcome of interest (0–3 stars). The highest possible score is nine stars; a score of three or less is considered to indicate poor quality; four to six, moderate quality; and seven to nine, high quality. Discrepancies in study assessments between the two authors were resolved through discussion.
2.5. Statistical analysis
All statistical analyses were carried out using RevMan 5.2 (The Cochrane Collaboration), and the significance threshold was a two-tailed P < 0.05. To allow pooling of data for meta-analysis, we converted the plasma levels of RAAS components into standard units: ng/mL per hour for plasma renin activity (PRA), U/mL for plasma renin concentration (PRC), ng/L for AngII, and ng/dL for plasma aldosterone concentration (PAC). Conversions were carried out using the following molecular masses: renin, 40000 Da; angiotensin, 1046.19 Da; and aldosterone, 360.4 Da. Since we were unable to pool PRA and PRC values, each renin outcome was meta-analyzed separately.
Data were pooled using the inverse variance method to yield pooled mean differences (MDs) in the plasma levels of RAAS components. Heterogeneity of pooled data was assessed using the I2statistic, with values of 25%−49% considered to indicate low heterogeneity; 50%−74%, moderate; and 75%−100%, high. We planned to perform meta-analyses using a random-effects model in the event of high heterogeneity; otherwise, we planned to use a fixed-effects model.
To identify sources of heterogeneity, we assessed risk of publication bias using Egger's test. We also performed subgroup and sensitivity analyses as well as meta-regression. Egger's test and meta-regression were performed using STATA 12 (Stata Corp, College Station, TX).
3. Results
3.1. Study selection
A total of 444 potentially eligible studies were reviewed, and 37 were selected on the basis of the title and abstract (Figure 2). Of these studies, 21 were excluded based on full-text review because they focused on medical treatment of OSA and RAAS (n = 11), did not report results as MDs or as medians and interquartile ranges (n = 7), or assigned individuals with mild OSA to the control group (n = 3). In the end, we meta-analyzed plasma renin levels in 10 studies involving 470 subjects, AngII levels in 7 studies involving 384 subjects, and aldosterone levels in 9 studies involving 439 subjects.[23],[28]–[39]
Figure 2. Flowchart of study screening and inclusion in meta-analysis.

OSA: obstructive sleep apnea; RAAS: renin-angiotensin-aldosterone system.
3.2. Study characteristics
Key characteristics of the 13 unique studies in this review are outlined in Table 1. Most studies involved middle-aged men from Europe (Spain, Italy, Greece, Denmark and France) and Asia (Korea, China and Japan). Subgroup analysis was performed to compare patients with or without hypertension when examining the relationship between OSA and aldosterone levels. For this analysis, patients were included in the “hypertension” subgroup if they were reported to have abnormal blood pressure at baseline and the respective study defined abnormal blood pressure. Patients were included in the “no hypertension” subgroup only when they were explicitly described as normotensive in the respective study. One study examined the association between OSA and levels of RAAS components in subjects with or without metabolic syndrome (MS).[23] Given that patients without MS could safely be assumed not to have hypertension but that those with MS did not necessarily have hypertension, we included only patients without MS in the “no hypertension” subgroup.
Table 1. Characteristics of studies included in the meta-analysis relating OSA to the RAAS.
| Study | Design | Study population |
Sample size |
OSA definition | Hypertension | Antihypertensive drug history | Outcomes | Primary results | |||
| Age, yrs | male (%) | Country | Cases | Controls | |||||||
| Cho, et al. 2015[28] | Case-control | 49.5 | 55.2 | South Korea | 35 | 23 | AHI ≥ 5 | Yes | No | PRA | NSD in PRA or PAC |
| PAC | |||||||||||
| Barcelo, et al. 2014[23] | Case-control | 47.6 | N/R | Spain | 33 | 35 | AHI ≥ 10 | Metabolic syndrome | No | PRA | NSD in PRA; PAC significantly higher in OSA than in controls |
| PAC | |||||||||||
| Barcelo, et al. 2014[23] | Case-control | 47.6 | N/R | Spain | 33 | 35 | AHI ≥ 10 | No metabolic syndrome | No | PRA | NSD in PRA; PAC significantly higher in OSA than in controls |
| PAC | |||||||||||
| Wang, et al. 2011[37] | Cohort | 51.2 | 58.3 | China | 48 | 72 | AHI ≥ 20 | Yes | Yes, stopped 2 weeks before study | AngII | AngII significantly higher in OSA than in controls |
| Di Murro, et al. 2010[29] | Case-control | 50.2 | 67.9 | Italy | 35 | 18 | AHI ≥ 5 | Yes | Yes, stopped3 weeks before study | PRA | NSD in PAC; PRA significantly lower in OSA than in controls |
| PAC | |||||||||||
| Svatikova, et al. 2009[30] | Case-control | 42.5 | N/R | Greece | 19 | 21 | AHI ≥ 20 | No | No | PRA | PRA and PAC significantly higher in OSA than in controls |
| PAC | |||||||||||
| Ishikawa, et al. 2008[36] | Case-control | 61.5 | 71.4 | Japan | 25 | 24 | AHI > 15 | Yes | Yes | AngII | AngII and PAC significantly higher in OSA than in controls |
| PAC | |||||||||||
| Gjorup, et al. 2007[31] | Case-control | 45.5 | 76.5 | Denmark | 32 | 19 | AHI ≥ 5 | Yes | No | PRC | NSD in RAAS activity |
| AngII | |||||||||||
| PAC | |||||||||||
| Takahashi, et al. 2005[39] | Case-control | 52.4 | 100 | Japan | 8 | 8 | AHI > 5 | Yes | N/R | AngII | AngII significantly higher in OSA than in controls |
| Yao, et al. 2005[38] | Case-control | N/R | N/R | China | 54 | 20 | AHI > 40 | N/R | N/R | AngII | AngII significantly higher in OSA than in controls |
| Moller, et al. 2003[32] | Case-control | 49 | 90.8 | Denmark | 24 | 18 | AHI ≥ 10 | Yes | Yes, stopped 2 weeks before study | PRC | RAAS activity significantly higher in OSA than in controls |
| AngII | |||||||||||
| PAC | |||||||||||
| Hu, et al.2002[33] | Case-control | 45 | 95 | China | 16 | 16 | AHI = 54 ± 23 | N/R | N/R | PRC | PAC and AngII significantly higher in OSA than in controls |
| AngII | |||||||||||
| Xiao, et al. 2000[34] | Case-control | 49.8 | 87.9 | China | 22 | 11 | RDI ≥ 5 | Yes | Yes, stopped 2 days before study | PRC | NSD in PRA or PAC |
| PAC | |||||||||||
| Maillard,et al. 1997[35] | Case-control | 46.6 | N/R | France | 7 | 5 | AHI ≥ 15 | No | No | PRC | NSD in PRA; PAC significantly lower in OSA than in controls |
| PAC | |||||||||||
AHI: apnea-hypopnea index; AngII: angiotensin II; N/R: not reported; NSD: no significant difference; OSA: obstructive sleep apnea; PAC: plasma aldosterone concentration; PRA: plasma renin activity; PRC: plasma renin concentration; RAAS: renin-angiotensin-aldosterone system; RDI: respiratory disturbance index.
3.3. Quality assessment of studies
NOS scores for each included study are shown in Table 2. There were 12 case-control studies and one cohort study.[23],[28]–[39] Among these studies, six that accounted for 63.9% of subjects received an overall score of seven to nine points, indicating high NOS quality.[23],[28]–[31],[37] One study received only two points and was considered as poor quality.[33] All case-control studies defined the “selection” of cases adequately and all but one of these studies defined controls adequately, meaning that they used the same polysomnography method to define OSA and controls.[33] Four out of 12 case-control studies, accounting for 39% of subjects, enrolled patients consecutively and featured OSA groups that represented well the larger OSA patient population.[28],[29],[31],[36] Only one study relied on community-based controls, while the others used hospital populations.[31] When assessing the comparability of study groups, we awarded a study one star (one point) if it controlled for age and a second star if it controlled for body mass index (BMI), since these are among several variables that may confound observed associations of OSA and levels of RAAS components.[4],[40],[41] Seven out of the 12 studies, accounting for 57.1% of subjects, received the maximum of two stars;[23],[29],[30],[34],[35],[38],[39] three studies, accounting for 27.91% of subjects, received one star for controlling age;[28],[31],[32] and the remaining two studies received no stars.[33],[36] When assessing exposure, all studies rewarded one star for the ascertainment method they used to assure the OSA. We awarded stars to all studies because they used the same method to examine cases and controls; the exception was Hu, et al.[33], who did not explicitly mention whether they used the same or different method. Seven studies accounting for 72.8% subjects, reported non-response rates and rewarded a star.[23],[28]–[32],[36] Only one cohort studyreceived all possible nine stars on NOS scores.[37]
Table 2. Quality assessment of case-control studies included in the meta-analysis, based on the Newcastle-Ottawa Scale.
| Study ID | Selection |
Comparability |
Exposure |
Total score | |||||
| Case definition Adequate (maximum: ★) | Representativeness of cases (maximum: ★) | Selection of controls (maximum: ★) | Definition of controls(maximum: ★) | Comparability of cases and controls based on design or analysisDesign or Analysis (maximum: ★★)a | Ascertainment of exposure (maximum: ★) | Same method of ascertainment for cases and controls (maximum: ★) | Non-response rate (maximum: ★) | ||
| Cho, et al. [28] | ★ | ★ | — | ★ | ★ for age | ★ | ★ | ★ | 7 |
| Barcelo, et al. [23] | ★ | — | — | ★ | ★★ | ★ | ★ | ★ | 7 |
| Di Murro, et al. [29] | ★ | ★ | — | ★ | ★★ | ★ | ★ | ★ | 8 |
| Svatikova, et al. [30] | ★ | — | — | ★ | ★★ | ★ | ★ | ★ | 7 |
| Ishikawa[36] | ★ | ★ | — | ★ | — | ★ | ★ | ★ | 6 |
| Gjorup[31] | ★ | ★ | ★ | ★ | ★ for age | ★ | ★ | ★ | 8 |
| Takahashi[39] | ★ | — | — | ★ | ★★ | ★ | ★ | — | 6 |
| Yao[38] | ★ | — | — | ★ | ★★ | ★ | ★ | — | 6 |
| Moller[32] | ★ | — | — | ★ | ★ for age | ★ | ★ | ★ | 6 |
| Hu[33] | ★ | — | — | — | — | ★ | — | — | 2 |
| Xiao[34] | ★ | — | — | ★ | ★★ | ★ | ★ | — | 6 |
| Maillard[35] | ★ | — | — | ★ | ★★ | ★ | ★ | — | 6 |
aStudies could receive 2-4 ★ for each item, except for “Comparability of cases and controls”, for which one ★ was awarded if the study controlled for age as the most important factor and another ★ if it controlled for BMI as an additional factor. BMI: body mass index.
Table 3. Quality assessment of cohort study included in the meta-analysis, based on the Newcastle-Ottawa Scale.
| Study ID | Modified Newcastle-Ottawa Scale for Cohort study |
Total Score | |||||||
| Selection |
Comparability |
Exposure |
|||||||
| Representativeness of exposed cohort (max: ★) | Selection of non-exposed cohort (max: ★) | Ascertainment of exposure (max: ★) | Demonstration that outcome of interest was not present at start of study (max: ★) | Comparability of cohorts on the basis of the design or analysis (max: ★★)a | Assessment of outcome (max: ★) | Was follow up long enough for outcomes to occur (max: ★) | Adequacy of follow up of cohorts (max: ★) | ||
| Wang, et al. [37] | ★ | ★ | ★ | ★ | ★★ | ★ | ★ | ★ | 9 |
aStudies could receive 2-4 ★ for each item, except for “Comparability of cohorts”, for which one ★ was awarded if the study controlled for age as the most important factor and another ★ if it controlled for BMI as an additional factor. BMI: body mass index.
3.4. Association of OSA with PRA and PRC
Five studies were meta-analyzed for PRA and another five for PRC in order to identify relationships between renin levels and OSA.[23],[28]–[36] Heterogeneity was significant among the studies of PRA (I2 = 82%, P = 0.0002) as well as among the studies of PRC (I2 = 78%, P = 0.001). Using random-effects models, we calculated that the pooled MD in renin level was 0.17 ng/mL per hour (95% CI: –0.22 to 0.55, P = 0.40) for PRA and 0.95 ng/mL (95% CI: –0.58 to 2.48, P = 0.23) for PRC (Figures 3,4). These results indicate no significant association between OSA and renin levels.
Figure 3. Forest plot assessing the association between higher PRA (ng/mL/h) and OSA.

OSA: obstructive sleep apnea; PRA: plasma renin activity.
Figure 4. Forest plot assessing the association between higher PRC (U/mL) and OSA.

OSA: obstructive sleep apnea; PRC: plasma renin concentration.
3.5. Association of OSA with AngII
Data from seven studies on a possible association between OSA and plasma levels of AngII showed high heterogeneity (I2 = 95%, P < 0.00001);[31]–[33],[36]–[39] mean plasma levels ranged from 5.19 to 18.73 ng/L in OSA patients and 3.0 to 13.42 ng/L in controls. Meta-analysis using a random-effects model revealed a pooled MD of 3.39 ng/L (95% CI 2.00 to 4.79, P < 0.00001; Figure 5). These results suggest a significant association between OSA and higher AngII.
Figure 5. Forest plot assessing the association between plasma angiotensin II levels and OSA.

OSA: obstructive sleep apnea.
3.6. Association of OSA with PAC
Data from nine studies on a possible association of OSA with serum PAC showed high heterogeneity (I2 = 78%, P < 0.00001), with mean PAC ranging from 3.39 to 29.20 ng/dL in OSA patients and 2.24 to 26.21 ng/dL in controls.[23],[28]–[32],[34]–[36] Meta-analysis using a random-effects model indicated a pooled MD of 0.95 ng/dL (95% CI: –0.16 to 2.07, P = 0.09; Figure 6).These results suggest no significant association between OSA and PAC.
Figure 6. Forest plot of whole-group analysis assessing the association between plasma aldosterone concentration and OSA.

OSA: obstructive sleep apnea.
3.7. Subgroup analysis
To probe further for possible relationships between OSA and PAC, we performed subgroup analyses separately for patients with hypertension (n = 286) and for those with no hypertension (n = 120).[23],[28]–[36] We excluded the study by Barcelo, et al.[23] from the hypertension subgroup because their patients with metabolic syndrome did not necessarily have hypertension. Data in the resulting hypertension subgroup showed no significant heterogeneity (I2 = 19%, P = 0.29), and random-effects meta-analysis indicated a pooled MD of 1.32 ng/dL (95% CI: 0.58 to 2.07, P = 0.0005; Figure 7). Data for the no-hypertension subgroup showed high heterogeneity (I2 = 94%, P < 0.00001), and random-effects meta-analysis indicated a pooled MD of –1.63 ng/dL (95% CI: –7.74 to 4.49, P = 0.60). These results suggest that OSA is associated with higher PAC specifically in the presence of hypertension.
Figure 7. Forest plot of subgroup analysis assessing the association between PAC and OSA.

OSA: obstructive sleep apnea; PAC: plasma aldosterone concentration.
3.8. Meta-regression
Medications taken by OSA patients prior to RAAS measurements may have artificially increased or reduced AngII/aldosterone levels, causing so-called “AngII/aldosterone escape”.[23],[42]–[44] This confounding may have contributed to the high heterogeneity among all nine studies analyzing OSA and serum PAC. To explore this possibility, we performed a meta-regression comparing use of antihypertensive medication with PAC levels, which gave a regression coefficient of 0.07 (P = 0.958, Figure 8). This suggests that antihypertensive drug history did not contribute significantly to the heterogeneity in studies of OSA and PAC.
Figure 8. Regression analysis of effects of antihypertensive medication on differences in PAC between patients with OSA and controls.
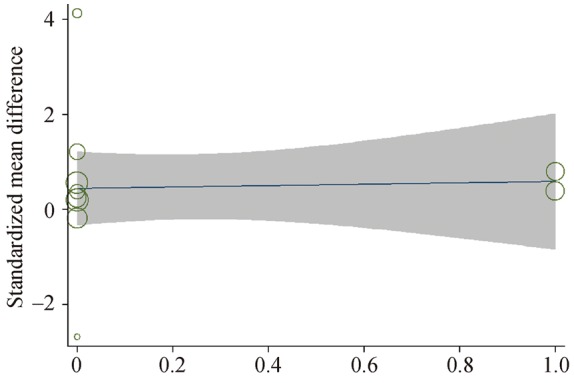
OSA: obstructive sleep apnea; PAC: plasma aldosterone concentration.
3.9. Sensitivity analysis
Our quality assessment revealed substantial differences among the studies, which may have contributed to the observed heterogeneity during data pooling. Therefore, we performed two sensitivity analyses. First, we removed the study by Maillard, et al.[35] because of its extremely small sample size (seven patients and five controls). This substantially reduced heterogeneity in both the hypertension subgroup (I2 = 0%, P = 0.91) and no-hypertension subgroup (I2 = 18%, P = 0.28), leading to a significant pooled MD of 1.47 ng/dL (95% CI: 0.73 to 2.20, P < 0.0001) for PAC in the no-hypertension subgroup (Figure 9). It also led to a significant pooled MD of 1.35 ng/dL (95% CI: 0.88 to 1.82, P < 0.00001) across all nine studies analyzing the potential association between OSA and PAC (Figure 10). In this way, deleting one small study changed the whole-group and subgroup analyses of the relationship between OSA and PAC. Meanwhile, we performed another sensitivity analysis by removing the study of Hu, et al.[33] because of the poor NOS score. This did not significantly change the relationship between PRC (µU/mL) and OSA (Figure 11), or that between plasma AngII and OSA (Figure 12).
Figure 9. Forest plot of subgroup analysis assessing the association between PAC and OSA after excluding the small study by Maillard, et al.[35].

OSA: obstructive sleep apnea; PAC: plasma aldosterone concentration.
Figure 10. Forest plot of whole group analysis assessing the association between PAC and OSA after excluding the small study by Maillard, et al.[35].

OSA: obstructive sleep apnea; PAC: plasma aldosterone concentration.
Figure 11. Forest plot of sensitivity analysis assessing the association between PRC (µU/mL) and OSA after excluding the poor-quality study by Hu, et al.[33].

OSA: obstructive sleep apnea; PRC: plasma renin concentration.
Figure 12. Forest plot of sensitivity analysis assessing the association between plasma angiotensin II levels and OSA after excluding the poor-quality study by Hu, et al. 2002.[33].

OSA: obstructive sleep apnea.
3.10. Risk of publication bias
Egger's test suggested no significant risk of publication bias among the seven studies examining OSA and plasma levels of AngII (P = 0.167) or among the nine studies examining OSA and serum PAC (P = 0.622).
4. Discussion
To our knowledge, this is the first meta-analysis to assess evidence for an association between OSA and RAAS components. Our results suggest that OSA is associated with RAAS activation, which may help explain the well-established link between OSA and hypertension, particularly resistant hypertension. Patients with OSA have higher serum levels of AngII than non-OSA controls, and hypertensive patients with OSA have higher aldosterone levels than controls. In contrast, renin levels are similar between OSA patients and controls.
Our results are consistent with those of a clinical study involving 71 subjects, in which plasma aldosterone levels, but not renin levels, were associated with severity of OSA (defined as AHI ≥ 5) in patients with resistant hypertension.[45] Another study found higher prevalence of OSA among patients with hyperaldosteronism (18%) than among controls (8.8%);[13] in fact, risk of OSA was 1.8-fold higher in patients with hyperaldosteronism after adjusting for risk factors associated with OSA and hypertension, including sex, age, body mass index, ethnicity, diabetes mellitus and chronic heart failure. Together, these previous results and the present study suggest that aldosterone may contribute to both OSA and resistant hypertension.
The small number of studies in this meta-analysis precluded subgroup analysis based on gender or ethnic differences. This question requires further study since one study reported higher incidence of OSA, more severe OSA and higher plasma aldosterone levels in men with resistant hypertension than in women with the same condition.[45] Another study has reported higher renin levels in men than women, and higher levels in Caucasians than in blacks.[42]
Since most studies in our review did not stratify patients by OSA severity, we were unable to examine whether the apparent effects of OSA on RAAS activation vary with severity. One study reported that AHI correlated negatively with renin levels but positively with aldosterone levels.[46] AHI > 30 was associated with significantly higher renin and aldosterone levels, both before and after saline load, than AHI 5–15. On the other hand, two studies involving 422 and 114 patients with hypertension found no significant differences in plasma levels of renin or aldosterone between patients with moderate/severe OSA or no/mild OSA based on polysomnography, or between patients at high or low risk of OSA based on the Berlin Questionnaire.[12],[47] Neither of these studies was included in the present meta-analysis because the control groups contained individuals with mild OSA. Future work is needed to examine whether the extent of RAAS activation depends on OSA severity.
This question is important for understanding the pathway(s) linking OSA and RAAS activation. Several pathways have been proposed, one of which involves hypoxia. The recurring upper airway collapse in OSA causes intermittent hypoxia, which increases plasma levels of both renin and aldosterone in animal models.[8],[48]–[50] Intermittent hypoxia also increases AT1 expression and AngII stimulation of the receptor in the carotid body in rats.[51],[52] Conversely, continuous positive airway pressure therapy to treat OSA down-regulates RAAS components and reduces blood pressure.[53]–[56] These findings, together with our meta-analysis showing higher AngII levels in patients with OSA than in controls and higher aldosterone levels specifically in patients with hypertension, argue that RAAS activation plays a role in OSA and in OSA-associated hypertension.
4.1. Strengths and limitations
This meta-analysis provides a reliable assessment of available evidence linking OSA and RAAS activation for several reasons. No language or date limitations were applied during our literature searches; in fact, several studies in the meta-analysis were published in Chinese. Our subgroup analyses comparing patients with or without hypertension provided specific evidence linking OSA, RAAS activation and hypertension. Meta-regression allowed us to rule out potential confounding effects of antihypertensive drug use on reported associations between OSA and RAAS.
At the same time, the present study has several limitations. First, significant heterogeneity was present in many of the meta-analyses. This is likely due in part to small sample size, since excluding the smallest study substantially reduced heterogeneity.[35] It likely also reflects that most studies in the meta-analysis grouped individuals with or without hypertension together in OSA cohorts. Consistent with this, we found that OSA was associated with aldosterone level only in patients with hypertension. Thus, more studies needed to explore the relationships among aldosterone, OSA and hypertension. Second, we did not perform subgroup analyses based on gender or ethnicity because of the small numbers of participants. Third, we had to perform subgroup analysis based on whether studies measured renin levels in terms of PRA or PRC, since the two types of measurement cannot be compared directly. Both approaches have advantages, since PRC assays are more reproducible but PRA assays measure very low levels of renin more accurately.[57] These three limitations highlight the need for much larger studies that will allow appropriate subgroup analyses.
A fourth limitation is that most studies did not consecutively enroll cases and all but one drew their controls from hospital populations, rather than from the community. This seriously limits the representativity of the study populations.
4.2. Conclusions
While the literature on OSA and RAAS is limited by small samples and lack of subgroup analyses to assess effects of various potential confounders, the available evidence suggests that OSA is associated with higher AngII and aldosterone levels, especially in hypertensive patients. This supports the idea that OSA may contribute to hypertension, at least in part, by stimulating the RAAS.
References
- 1.Kendzerska T, Gershon AS, Hawker G, et al. Obstructive sleep apnea and risk of cardiovascular events and all-cause mortality: a decade-long historical cohort study. PLoS Med. 2014;2:e1001599. doi: 10.1371/journal.pmed.1001599. [DOI] [PMC free article] [PubMed] [Google Scholar]
- 2.Marin JM, Carrizo SJ, Vicente E, et al. Long-term cardiovascular outcomes in men with obstructive sleep apnoea-hypopnoea with or without treatment with continuous positive airway pressure: an observational study. Lancet. 2005;9464:1046–1053. doi: 10.1016/S0140-6736(05)71141-7. [DOI] [PubMed] [Google Scholar]
- 3.Doherty LS, Kiely JL, Swan V, et al. Long-term effects of nasal continuous positive airway pressure therapy on cardiovascular outcomes in sleep apnea syndrome. Chest. 2005;6:2076–2084. doi: 10.1378/chest.127.6.2076. [DOI] [PubMed] [Google Scholar]
- 4.Konecny T, Kara T, Somers VK. Obstructive sleep apnea and hypertension: an update. Hypertension. 2014;2:203–209. doi: 10.1161/HYPERTENSIONAHA.113.00613. [DOI] [PMC free article] [PubMed] [Google Scholar]
- 5.Floras JS. Hypertension and sleep apnea. Can J Cardiol. 2015;7:889–897. doi: 10.1016/j.cjca.2015.05.003. [DOI] [PubMed] [Google Scholar]
- 6.Vongpatanasin W. Resistant hypertension: a review of diagnosis and management. JAMA. 2014;21:2216–2224. doi: 10.1001/jama.2014.5180. [DOI] [PubMed] [Google Scholar]
- 7.McEvoy RD, Anderson CS, Antic NA, et al. The sleep apnea cardiovascular endpoints (SAVE) trial: rationale and start-up phase. J Thorac Dis. 2010;3:138–143. doi: 10.3978/j.issn.2072-1439.2010.02.03.5. [DOI] [PMC free article] [PubMed] [Google Scholar]
- 8.Pimenta E, Calhoun DA, Oparil S. Sleep apnea, aldosterone, and resistant hypertension. Prog Cardiovasc Dis. 2009;5:371–380. doi: 10.1016/j.pcad.2008.02.004. [DOI] [PubMed] [Google Scholar]
- 9.Moon JY. Recent update of renin-angiotensin-aldosterone system in the pathogenesis of hypertension. Electrolyte Blood Press. 2013;2:41–45. doi: 10.5049/EBP.2013.11.2.41. [DOI] [PMC free article] [PubMed] [Google Scholar]
- 10.Shimosawa T. Salt, the renin-angiotensin-aldosterone system and resistant hypertension. Hypertens Res. 2013;8:657–660. doi: 10.1038/hr.2013.69. [DOI] [PubMed] [Google Scholar]
- 11.Lavoie JL, Lake-Bruse KD, Sigmund CD. Increased blood pressure in transgenic mice expressing both human renin and angiotensinogen in the renal proximal tubule. Am J Physiol Renal Physiol. 2004;5:F965–F971. doi: 10.1152/ajprenal.00402.2003. [DOI] [PubMed] [Google Scholar]
- 12.Calhoun DA, Nishizaka MK, Zaman MA, et al. Aldosterone excretion among subjects with resistant hypertension and symptoms of sleep apnea. Chest. 2004;1:112–117. doi: 10.1378/chest.125.1.112. [DOI] [PubMed] [Google Scholar]
- 13.Sim JJ, Yan EH, Liu IL, et al. Positive relationship of sleep apnea to hyperaldosteronism in an ethnically diverse population. J Hypertens. 2011;8:1553–1559. doi: 10.1097/HJH.0b013e3283492219. [DOI] [PubMed] [Google Scholar]
- 14.Avrahami E, Englender M. Relation between CT axial cross-sectional area of the oropharynx and obstructive sleep apnea syndrome in adults. AJNR Am J Neuroradiol. 1995;1:135–140. [PMC free article] [PubMed] [Google Scholar]
- 15.Yucel A, Unlu M, Haktanir A, et al. Evaluation of the upper airway cross-sectional area changes in different degrees of severity of obstructive sleep apnea syndrome: cephalometric and dynamic CT study. AJNR Am J Neuroradiol. 2005;10:2624–2629. [PMC free article] [PubMed] [Google Scholar]
- 16.Bucca CB, Brussino L, Battisti A, et al. Diuretics in obstructive sleep apnea with diastolic heart failure. Chest. 2007;2:440–446. doi: 10.1378/chest.07-0311. [DOI] [PubMed] [Google Scholar]
- 17.Shiota S, Ryan CM, Chiu KL, et al. Alterations in upper airway cross-sectional area in response to lower body positive pressure in healthy subjects. Thorax. 2007;10:868–872. doi: 10.1136/thx.2006.071183. [DOI] [PMC free article] [PubMed] [Google Scholar]
- 18.Gonzaga CC, Gaddam KK, Ahmed MI, et al. Severity of obstructive sleep apnea is related to aldosterone status in subjects with resistant hypertension. J Clin Sleep Med. 2010;4:363–368. [PMC free article] [PubMed] [Google Scholar]
- 19.Parati G, Ochoa JE, Bilo G, et al. Obstructive sleep apnea syndrome as a cause of resistant hypertension. Hypertens Res. 2014;7:601–613. doi: 10.1038/hr.2014.80. [DOI] [PubMed] [Google Scholar]
- 20.Calhoun DA. Obstructive sleep apnea and hypertension. Curr Hypertens Rep. 2010;3:189–195. doi: 10.1007/s11906-010-0112-8. [DOI] [PubMed] [Google Scholar]
- 21.Dudenbostel T, Calhoun DA. Resistant hypertension, obstructive sleep apnoea and aldosterone. J Hum Hypertens. 2012;5:281–287. doi: 10.1038/jhh.2011.47. [DOI] [PMC free article] [PubMed] [Google Scholar]
- 22.Gaddam K, Pimenta E, Thomas SJ, et al. Spironolactone reduces severity of obstructive sleep apnoea in patients with resistant hypertension: a preliminary report. J Hum Hypertens. 2010;8:532–537. doi: 10.1038/jhh.2009.96. [DOI] [PMC free article] [PubMed] [Google Scholar]
- 23.Barcelo A, Pierola J, Esquinas C, et al. Relationship between aldosterone and the metabolic syndrome in patients with obstructive sleep apnea hypopnea syndrome: effect of continuous positive airway pressure treatment. PLoS One. 2014;1:e84362. doi: 10.1371/journal.pone.0084362. [DOI] [PMC free article] [PubMed] [Google Scholar]
- 24.Moher D, Liberati A, Tetzlaff J, et al. Preferred reporting items for systematic reviews and meta-analyses: the PRISMA statement. Int J Surg. 2010;8:336–341. doi: 10.1016/j.ijsu.2010.02.007. [DOI] [PubMed] [Google Scholar]
- 25.Qaseem A, Dallas P, Owens DK, et al. Diagnosis of obstructive sleep apnea in adults: a clinical practice guideline from the American College of Physicians. Ann Intern Med. 2014;3:210–220. doi: 10.7326/M12-3187. [DOI] [PubMed] [Google Scholar]
- 26.Epstein LJ, Kristo D, Strollo PJ, et al. Clinical guideline for the evaluation, management and long-term care of obstructive sleep apnea in adults. J Clin Sleep Med. 2009;3:263–276. [PMC free article] [PubMed] [Google Scholar]
- 27.Wells GA, Shea B, O'Connell D, et al. The Newcastle-Ottawa Scale (NOS) for assessing the quality of nonrandomised studies in meta-analysis. 2015 http://www.ohri.ca/programs/clinical_epidemiology/oxford.asp (accessed March 17, 2015) [Google Scholar]
- 28.Cho JS, Ihm SH, Kim CJ, et al. Obstructive sleep apnea using watch-PAT 200 is independently associated with an increase in morning blood pressure surge in never-treated hypertensive Patients. J Clin Hypertens (Greenwich) 2015;17:675–681. doi: 10.1111/jch.12581. [DOI] [PMC free article] [PubMed] [Google Scholar]
- 29.Di Murro A, Petramala L, Cotesta D, et al. Renin-angiotensin-aldosterone system in patients with sleep apnoea: prevalence of primary aldosteronism. J Renin Angiotensin Aldosterone Syst. 2010;3:165–172. doi: 10.1177/1470320310366581. [DOI] [PubMed] [Google Scholar]
- 30.Svatikova A, Olson LJ, Wolk R, et al. Obstructive sleep apnea and aldosterone. Sleep. 2009;12:1589–1592. doi: 10.1093/sleep/32.12.1589. [DOI] [PMC free article] [PubMed] [Google Scholar]
- 31.Gjorup PH, Sadauskiene L, Wessels J, et al. Abnormally increased endothelin-1 in plasma during the night in obstructive sleep apnea: relation to blood pressure and severity of disease. Am J Hypertens. 2007;1:44–52. doi: 10.1016/j.amjhyper.2006.05.021. [DOI] [PubMed] [Google Scholar]
- 32.Moller DS, Lind P, Strunge B, et al. Abnormal vasoactive hormones and 24-hour blood pressure in obstructive sleep apnea. Am J Hypertens. 2003;4:274–280. doi: 10.1016/s0895-7061(02)03267-3. [DOI] [PubMed] [Google Scholar]
- 33.Hu X, Kang J, Xiao D, et al. The influence of nasal continual positive airway pressure on some vasoactive substances in patients with obstructive sleep apnea syndrome. Zhonghua Jie He He Hu Xi Za Zhi. 2002;1:36–38. [Article in Chinese] [PubMed] [Google Scholar]
- 34.Xiao Y, Yin K, Zheng P. Significance of the changes of urinary uric acid, ANP, renin and aldosterone in sleep apnea syndrome patients. Zhonghua Jie He He Hu Xi Za Zhi. 2000;1:27–30. [Article in Chinese] [PubMed] [Google Scholar]
- 35.Maillard D, Fineyre F, Dreyfuss D, et al. Pressure-heart rate responses to alpha-adrenergic stimulation and hormonal regulation in normotensive patients with obstructive sleep apnea. Am J Hypertens. 1997;1:24–31. doi: 10.1016/s0895-7061(96)00252-x. [DOI] [PubMed] [Google Scholar]
- 36.Ishikawa J, Hoshide S, Eguchi K, et al. Increased low-grade inflammation and plasminogen-activator inhibitor-1 level in nondippers with sleep apnea syndrome. J Hypertens. 2008;6:1181–1187. doi: 10.1097/HJH.0b013e3282fd9949. [DOI] [PMC free article] [PubMed] [Google Scholar]
- 37.Wang HL, Wang Y, Zhang Y, et al. Changes in plasma angiotensin II and circadian rhythm of blood pressure in hypertensive patients with sleep apnea syndrome before and after treatment. Chin Med Sci J. 2011;1:9–13. doi: 10.1016/s1001-9294(11)60013-8. [DOI] [PubMed] [Google Scholar]
- 38.Yao X, Sun Y, Chu Y, et al. The changes of some vasoactive substances after operation in patients with obstructive sleep apnea-hypopnea syndrome. Lin Chuang Er Bi Yan Hou Ke Za Zhi. 2005;20:937–938. [Article in Chinese] [PubMed] [Google Scholar]
- 39.Takahashi S, Nakamura Y, Nishijima T, et al. Essential roles of angiotensin II in vascular endothelial growth factor expression in sleep apnea syndrome. Respir Med. 2005;9:1125–1131. doi: 10.1016/j.rmed.2005.02.027. [DOI] [PubMed] [Google Scholar]
- 40.Rossi GP, Belfiore A, Bernini G, et al. Body mass index predicts plasma aldosterone concentrations in overweight-obese primary hypertensive patients. J Clin Endocrinol Metab. 2008;7:2566–2571. doi: 10.1210/jc.2008-0251. [DOI] [PubMed] [Google Scholar]
- 41.Bauer JH. Age-related changes in the renin-aldosterone system. Physiological effects and clinical implications. Drugs Aging. 1993;3:238–245. doi: 10.2165/00002512-199303030-00005. [DOI] [PubMed] [Google Scholar]
- 42.Te RL, van Esch JH, Roks AJ, et al. Hypertension: renin-angiotensin-aldosterone system alterations. Circ Res. 2015;6:960–975. doi: 10.1161/CIRCRESAHA.116.303587. [DOI] [PubMed] [Google Scholar]
- 43.Nussberger J, Brunner DB, Waeber B, et al. Specific measurement of angiotensin metabolites and in vitro generated angiotensin II in plasma. Hypertension. 1986;6:476–482. doi: 10.1161/01.hyp.8.6.476. [DOI] [PubMed] [Google Scholar]
- 44.van den Meiracker AH, Admiraal PJ, Janssen JA, et al. Hemodynamic and biochemical effects of the AT1 receptor antagonist irbesartan in hypertension. Hypertension. 1995;1:22–29. doi: 10.1161/01.hyp.25.1.22. [DOI] [PubMed] [Google Scholar]
- 45.Pratt-Ubunama MN, Nishizaka MK, Boedefeld RL, et al. Plasma aldosterone is related to severity of obstructive sleep apnea in subjects with resistant hypertension. Chest. 2007;2:453–459. doi: 10.1378/chest.06-1442. [DOI] [PubMed] [Google Scholar]
- 46.Soltysiak M, Miazgowski T, Jaroszynska E, et al. Impaired aldosterone response to the saline infusion test in patients with resistant hypertension and obstructive sleep apnea. Nadcisnienie Tetnicze. 2015;1:13–18. [Google Scholar]
- 47.Baessler A, Nadeem R, Harvey M, et al. Treatment for sleep apnea by continuous positive airway pressure improves levels of inflammatory markers-a meta-analysis. J Inflamm (Lond) 2013;10:13. doi: 10.1186/1476-9255-10-13. [DOI] [PMC free article] [PubMed] [Google Scholar]
- 48.May AM, Mehra R. Obstructive sleep apnea: role of intermittent hypoxia and inflammation. Semin Respir Crit Care Med. 2014;5:531–544. doi: 10.1055/s-0034-1390023. [DOI] [PubMed] [Google Scholar]
- 49.Fletcher EC, Bao G, Li R. Renin activity and blood pressure in response to chronic episodic hypoxia. Hypertension. 1999;2:309–314. doi: 10.1161/01.hyp.34.2.309. [DOI] [PubMed] [Google Scholar]
- 50.Fletcher EC, Orolinova N, Bader M. Blood pressure response to chronic episodic hypoxia: the renin-angiotensin system. J Appl Physiol (1985) 2002;2:627–633. doi: 10.1152/japplphysiol.00152.2001. [DOI] [PubMed] [Google Scholar]
- 51.Fung ML, Tipoe GL, Leung PS. Mechanisms of maladaptive responses of peripheral chemoreceptors to intermittent hypoxia in sleep-disordered breathing. Sheng Li Xue Bao. 2014;1:23–29. [Article in Chinese] [PubMed] [Google Scholar]
- 52.Lam SY, Liu Y, Ng KM, et al. Upregulation of a local renin-angiotensin system in the rat carotid body during chronic intermittent hypoxia. Exp Physiol. 2014;1:220–231. doi: 10.1113/expphysiol.2013.074591. [DOI] [PubMed] [Google Scholar]
- 53.Lloberes P, Sampol G, Espinel E, et al. A randomized controlled study of CPAP effect on plasma aldosterone concentration in patients with resistant hypertension and obstructive sleep apnea. J Hypertens. 2014;8:1650–1657. doi: 10.1097/HJH.0000000000000238. [DOI] [PubMed] [Google Scholar]
- 54.Nicholl DDM, Hanly PJ, Poulin MJ, et al. Evaluation of continuous positive airway pressure therapy on renin-angiotensin system activity in obstructive sleep apnea. Am J Respir Crit Care Med. 2014;5:572–580. doi: 10.1164/rccm.201403-0526OC. [DOI] [PubMed] [Google Scholar]
- 55.Lloberes P, Sampol G, Espinel E, et al. Effect of 3-month CPAP treatment on blood pressure and serum aldosterone concentration in patients with resistant hypertension. Eur Respir J. 2013;(Suppl. 57):307. [Google Scholar]
- 56.Zhang XL, Li YQ. Efficacy of continuous positive airway pressure therapy upon resistant hypertension in patients with obstructive sleep apnea hypopnea syndrome. Zhonghua Yi Xue Za Zhi. 2009;26:1811–1814. [Article in Chinese] [PubMed] [Google Scholar]
- 57.Lonati C, Bassani N, Gritti A, et al. Measurement of plasma renin concentration instead of plasma renin activity decreases the positive aldosterone-to-renin ratio tests in treated patients with essential hypertension. J Hypertens. 2014;3:627–634. doi: 10.1097/HJH.0000000000000076. [DOI] [PubMed] [Google Scholar]