

Abstract
Objective
Characterize the cellular and molecular events responsible for lipodystrophy in AGPAT2 deficient mice.
Methods
Adipose tissue and differentiated MEF were assessed using light and electron microscopy, followed by protein (immunoblots) and mRNA analysis (qPCR). Phospholipid profiling was determined by electrospray ionization tandem mass spectrometry (ESI-MS/MS).
Results
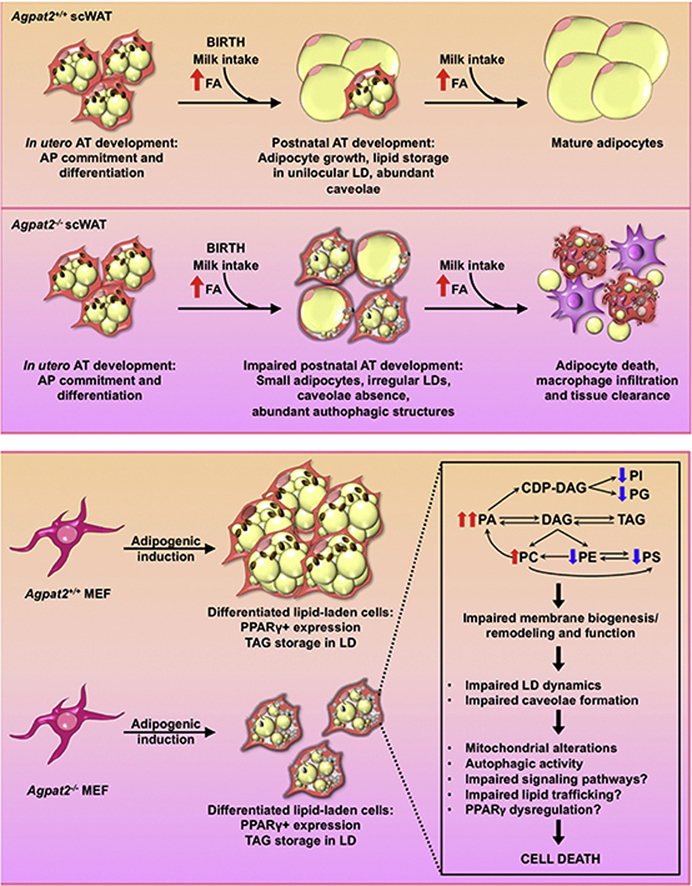
In contrast to adult Agpat2−/− mice, fetuses and newborn Agpat2−/− mice have normal mass of white and brown adipose tissue. Loss of both the adipose tissue depots occurs during the first week of postnatal life as a consequence of adipocyte death and inflammatory infiltration of the adipose tissue. At the ultrastructural level, adipose tissue of newborn Agpat2−/− mice is virtually devoid of caveolae and has abnormal mitochondria and lipid droplets. Autophagic structures are also abundant. Consistent with these findings, differentiated Agpat2−/− mouse embryonic fibroblasts (MEFs) also have impaired adipogenesis, characterized by a lower number of lipid-laden cells and ultrastructural abnormalities in lipid droplets, mitochondria and plasma membrane. Overexpression of PPARγ, the master regulator of adipogenesis, increased the number of Agpat2−/− MEFs that differentiated into adipocyte-like cells but did not prevent morphological abnormalities and cell death. Furthermore, differentiated Agpat2−/− MEFs have abnormal phospholipid compositions with 3-fold increased levels of phosphatidic acid.
Conclusion
We conclude that lipodystrophy in Agpat2−/− mice results from postnatal cell death of adipose tissue in association with acute local inflammation. It is possible that AGPAT2 deficient adipocytes have an altered lipid filling or a reduced capacity to adapt the massive lipid availability associated with postnatal feeding.
Keywords: AGPAT2, Adipose tissue, Adipogenesis, Phospholipid, Lipodystrophy
Graphical abstract
Highlights
-
•
Post weaning Agpat2−/− mice are lipodystrophic.
-
•
However, they are born with normal mass of white and brown adipose tissue.
-
•
Adipose tissue in Agpat2−/− mice undergoes postnatal inflammatory cell death.
-
•
Differentiated Agpat2−/− MEFs recapitulate abnormalities of Agpat2−/− adipocytes.
-
•
Abnormal phospholipid composition might underlies lipodystrophy in Agpat2−/− mice.
1. Introduction
Congenital generalized lipodystrophy (CGL, Berardinelli-Seip syndrome) is a rare autosomal recessive disorder characterized by a lack of adipose tissue (AT). Affected individuals are prone to metabolic complications including insulin resistance, diabetes mellitus, hepatic steatosis and hypertriglyceridemia [1], [2].
Mutations in the AGPAT2 gene, encoding 1-acylglycerol-3-phosphate O-acyltransferase 2, cause the most common form of CGL, designated CGL-1 [3]. Patients with CGL-1 have total absence of metabolically active adipose tissue, which is present in most subcutaneous regions, intra-abdominal and intra-thoracic regions and bone marrow; mechanical adipose tissue, which is present in the palms, soles, scalp, peri-articular regions and orbits, is completely preserved [4]. Similarly, mice lacking AGPAT2 (Agpat2−/−mice) have complete loss of both white and brown adipose tissue and manifest severe insulin resistance and hyperglycemia [5], [6]. The mechanisms underlying the loss of adipose tissue in Agpat2−/− mice remain unknown.
AGPAT2 belongs to a family of enzymes catalyzing the sn-2 acylation of the glycerol-3-phosphate backbone. This reaction converts lysophosphatidic acid (LPA) to phosphatidic acid (PA) in the de novo glycerolipid synthesis pathway [7]. In humans and mice, AGPAT2 is a ∼31 KDa protein with four predicted transmembrane domains [8] and specificity for LPA and acyl-CoA substrates [9], [10]. Epitope tagged AGPAT2 localizes to the endoplasmic reticulum (ER) of CHO cells and primary mouse hepatocytes [10].
Lipodystrophy can result from either insufficient generation of mature adipocytes, i.e. defective adipogenesis, or accelerated adipocytes loss, i.e., defective adipose maintenance. Previous work with cell lines [11], [12] and muscle-derived multipotent cells isolated from subjects harboring AGPAT2 mutations [12] has suggested that AGPAT2 is required for adipogenic differentiation; however, the roles of AGPAT2 for in vivo adipose tissue dynamics is unknown.
Herein, we characterized morphological, ultrastructural, and molecular changes of AT from Agpat2−/− mice and assessed adipogenic differentiation in Agpat2−/− mouse embryonic fibroblasts (MEFs).
2. Materials and methods
2.1. Mice
Agpat2−/− mice were generated as described previously [5]. Agpat2−/− and Agpat2+/+ mice were obtained by mating of Agpat2+/− mice. Genotyping was performed by the PCR protocol as described [5]. Adult mice were fed chow ad libitum. All mouse procedures were reviewed and approved by the Institutional Animal Care and Use Committee at Pontificia Universidad Católica de Chile and University of Texas Southwestern Medical Center (UTSW).
2.2. Mouse embryonic fibroblasts (MEFs)
Agpat2+/− pregnant females (14.5 d.p.c.) were sacrificed by isoflurane overdose. The embryos were removed, washed with ice cold sterile PBS, and sacrificed by decapitation. Maternal tissues, placental membranes, and internal organs were removed, and carcasses were rinsed with PBS and manually minced. The resulting material was digested with 0.25% trypsin/1 mM EDTA for 3 h at 4 °C and centrifuged. Cells were resuspended in DMEM 4.5 g/L glucose, supplemented with 10% heat-inactivated fetal bovine serum (FBS), 2 mM l-glutamine, 0.1 mM nonessential amino acids, 100 μg/ml penicillin/streptomycin, and 0.1 mM 2-β-mercaptoethanol and seeded onto 150 mm plastic dishes. Because of Agpat2+/− mice mating, the embyros are of all three genotypes: Agpat2+/+; Agpat2+/− and Agpat2−/−. Genomic DNA was isolated from tail biopsies of each embryo and only those of Agpat2+/+ and Agpat2−/− genotypes were further processed. Genotyping PCR conditions are similar as mentioned before [5]. MEFs were cultured until 100% confluence and frozen in liquid nitrogen at passage 1. All the experiments were performed at passage 3.
2.3. MEFs adipogenic differentiation
4 × 10⁵ MEFs/well were seeded on 12-well plates and cultured in DMEM 4.5 g/L glucose, supplemented with 10% heat-inactivated FBS, 2 mM l-glutamine, 0.1 mM nonessential amino acids, 100 μg/ml penicillin/streptomycin, and 0.1 mM 2-β-mercaptoethanol. Adipogenesis was induced 2 days after confluency with induction medium (standard medium plus 1 μM dexamethasone, 0.5 mM 3-isobutyl-1-methylxanthine (IBMX), 10 μg/ml insulin) for 3 days. After induction, MEFs were fed an adipogenic differentiation medium (standard medium plus 10 μg/ml insulin and 10 μM rosiglitazone) for 2 additional days and then cultured in adipogenic maintenance medium (standard medium supplemented with 10 μg/ml insulin).
2.4. Histology and immunofluorescence
E18.5 embryos and newborn mice were euthanized by CO2 anesthesia following cervical decapitation. Immediately, they were rinsed with 1X PBS and fixed overnight in 4% PFA/PBS and then transferred into 30–18% sucrose/PBS gradient. For histological studies in dorsal skin and interscapular BAT (iBAT) of P0-P6.5 mice, tissues were fixed in 4% PFA/PBS and then embedded in paraffin. Cryo and paraffin embedding, sectioning, H&E and Oil Red O staining were performed at UTSW Molecular Pathology Core. For Perilipin-1 and MAC-2 immunofluorescence in AT, sections were deparaffinized in xylene and rehydrated in a graded series of ethanol followed by dH2O. Antigen unmasking was carried out by heating slices in 10 mM sodium citrate buffer (pH 6.0) at 95–99 °C for 10 min. Tissue sections were blocked and then incubated overnight at 4 °C with primary antibodies. After the washing steps, fluorochrome-conjugated secondary antibodies were incubated for 1 h at room temperature. For immunofluorescence detection in cultured cells, MEFs were seeded on glass coverslips and adipogenic differentiation was induced as described above. At the indicated days, differentiated MEFs were fixed in 4% PFA, washed with PBS and permeabilizated/blocked in 0.3% Triton X-100; 3% BSA/PBS. Primary and secondary antibody incubation steps were performed as described above. Finally, all stained slides and coverslips were mounted with ProLong® Gold Antifade Reagent with 4′,6′-diamidino-2-phenylindole (DAPI) (Molecular Probes). Images were captured with Leica SP5 Tandem Scanner Spectral 2-photon confocal microscope (Leica Microsystems, Inc., Buffalo Grove, IL) and processed with ImageJ (NIH, Bethesda, MD, US) and Bitplane Imaris software v. 7.3.1 (Andor Technology PLC, Belfast, N. Ireland). The following antibodies and dilutions were used: rabbit anti-Perilipin-1 (1:300, Cell Signalling), rabbit anti-Caveolin-1 (1:100, Cell Signalling), rabbit anti-PPARγ (1:100, Cell Signalling) and rat anti-MAC-2 (1:200, Cedarlane). Alexa Fluor® 488 or 594 goat anti-rabbit IgG (H + L) and Alexa Fluor® 488 goat anti-rat IgG (Molecular Probes) were diluted 1:300 in blocking buffer. F-actin was stained with rhodamine phalloidin (1:30 in PBS, Molecular Probes). For neutral lipid staining in MEFs, samples were incubated with 1 μg/ml BODIPY 493/503 (Molecular Probes).
2.5. TUNEL assay
Apoptotic cells were detected by the terminal deoxynucleotidyl-transferase-mediated deoxyuridine-triphosphate-biotin nick-end labeling (TUNEL) method using DeadEnd Fluorometric TUNEL System (Promega, Madison, WI) according the manufacturer's protocol. For TUNEL/Perilipin-1 double-labeled assay, paraffin sections of adipose tissue were first treated for TUNEL staining followed by immunofluorescent detection of Perilipin-1. Nuclei were counterstained with propidium iodide or DAPI as indicated. Stained samples were examined by confocal scanning laser microscopy.
2.6. Transmission electron microscopy
Dissected tissues from anterior subcutaneous regions and differentiated MEFs were fixed in 2% glutaraldehyde; 0.1 M cacodylate buffer and processed at the UTSW Electron Microscopy Core Facility. Sections were examined with a TEM Tecnai Spirit electron microscope and photographed with a Morada CCD camera.
2.7. Immunoblot analysis and antibodies
MEF protein extracts were prepared in RIPA buffer (50 mM Tris pH 8.0, 180 mM NaCl, 1% NP-40, 1% sodium deoxycholic acid, 0.1 mM EGTA and 0.1% sodium dodecyl sulfate (SDS)) supplemented with protease and phosphatase inhibitor cocktails (Roche) and 1 mM phenylmethylsulfonyl fluoride (PMSF). Proteins (50 μg) were denaturated in Laemmli's sample buffer (62.5 mM Tris, pH 6.8, 2% SDS, 25% glycerol, 0.01% bromophenol blue, and 5% β-mercaptoethanol), separated in a SDS-polyacrylamide gel and electrotransferred onto a nitrocellulose membrane. Membranes were blocked with 5% bovine serum albumin (BSA)/tris phosphate buffer 0.1% Tween 20 (TBS-T) and incubated overnight at 4 °C with primary antibodies diluted in 5% BSA/TBS-T solution. Rabbit antibodies against PPARγ, C/EBPα, C/EBPβ, C/EBPγ, β-actin, ATG12, Beclin, Akt (pan) and anti-rabbit IgG, HRP-linked antibodies were all purchased from Cell Signalling. Blots were visualized by chemiluminescence detection using Super Signal® West Pico Reagents (Pierce).
2.8. Real-time reverse transcription PCR
Total RNA was extracted from iBAT, posterior subcutaneous AT and MEFs using RNA STAT-60 reagent (TEL-TEST). 2 μg of total RNA were reverse transcribed with High Capacity cDNA Reverse Transcription Kit (Applied Biosystems). Real-time PCR was performed on ABI Prism® 7900 HT thermalcycler (Applied Biosystems) using SYBR® Green PCR Master Mix (Applied Biosystems) as reported [5]. Individual mRNA levels were normalized to 36B4 and expressed as fold-change relative to non-differentiated Agpat2+/+ MEFs or wild type mice AT, with the ΔΔCt method. Primer sequences used for real time PCR are provided in Supplementary Table 1.
2.9. Recombinant adenovirus
PPARγ2 encoding adenovirus was generated with ViraPower adenoviral expression system (Invitrogen). The PPARγ2 cDNA was amplified with Phusion high fidelity DNA polymerase (New England Biolabs) from a mouse liver cDNA library. PCR products were gel-purified and cloned into pENTR/D-TOPO vector (Invitrogen). The orientation and the sequence of the inserted cDNAs were confirmed by sequencing. Recombinant adenoviral vectors were generated by Clonase II mediated recombination between PPARγ2-pENTR/D-TOPO and pAd/CMV/V5-DEST vector (Invitrogen). Resulting recombinant plasmids were confirmed by sequencing. Infecting adenoviral particles were generated by transfecting 1 μg of PacI digested PPARγ2-pAD/CMV/V5-DEST in 293A cells using FuGENE 6 reagent (Roche Diagnostics). Adenoviral particles were purified in CsCl gradients and quantified by OD at 260 nm. 6 × 10⁹ adenoviral particles were used to transduce MEFs in 60 mm dishes.
2.10. Lipid extraction and phospholipid composition analysis
Total triglycerides from differentiated MEFs were extracted and measured using Triglyceride Colorimetric Assay Kit (Cayman Chemicals) according to the manufacturer's instructions. To extract total glycerophospholipids, differentiated MEFs were collected and snap-frozen immediately in liquid nitrogen. Next, samples were homogenized with 2 ml of ice-cold Tris–HCl 20 mM containing protease inhibitors. Then, 0.8 the homogenized sample was vigorously mixed with CHCl3 and 0.1 N HCl:CH3OH methanol in a 0.8:1:1 ratio. Next, an equal amount of CHCl3 was added to the mix, manually shaken and centrifuged at 600 × g for 10 min at 4 °C. The lower phase was carefully removed and washed with a small volume of 1 M KCl. Extracted lipids were sent to Kansas Lipidomics Research Center (KLRC) for quantitation of phospholipid species. Automated electrospray ionization-tandem mass spectrometry approach was used, and data acquisition, analysis and identification were carried out as KLRC described previously [13], [14]. The data are presented as mol% of the total lipids analyzed.
2.11. Imaging analysis
To quantify the number and size of adipocytes in histological sections of adipose tissue, adipocyte area was measured on hematoxylin and eosin stained slides using Adiposoft and ImageJ software as previously described [15]. To determine the relative percentage of lipid-laden cells (cells containing LDs) after 6 days of differentiation, MEFs were grown on glass coverslips and differentiated. At day 6, cells were fixed and stained with BODIPY 493/503 to detect neutral lipids, rhodamine-phalloidin to detect cortical actin lining the inner surface of the plasma membrane in adipocytes [16], [17]), and DAPI to stain cell nuclei. Samples were imaged using a confocal microscope. For cell counting, five non-overlapping fields were analyzed and quantified using Image J software (each field contained approximately 150 cells). The relative percentage of lipid-laden cells was determined as the ratio of BODIPY/cortical F-actin labeled cells to the total cell number per field. For time-course experiments, lipid-laden cells were monitored under an inverted microscope with phase contrast objectives at different days of differentiation. Images from the sample fields were captured at each time and then analyzed with Image J software. Quantitative image analysis of fluorescence intensity was performed with Image J software as previously described [18].
2.12. Statistical analysis
GraphPad Prism 5.00 (GraphPad, La Jolla, CA) was used for plotting and statistical analyses. Unpaired, two-sided Student's t-test was used to determine the statistical significance of the differences observed in two-group experiments. One-way ANOVA was used to compare three or more groups in some experiments. P-values of <0.05 were considered significant. (*), 0.01(**), and 0.001(***).
3. Results
3.1. Newborn Agpat2−/− mice are born with subcutaneous white and brown adipose tissues, which are lost during the first week of life
As we previously reported, AGPAT2 deficient adult mice are completely devoid of all white adipose tissue (WAT) and brown adipose tissue (BAT) depots [5]. Surprisingly, and in contrast, fetuses and newborn Agpat2−/− mice have preserved adipose tissue, as indicated by Oil Red O and Perilipin-1 staining of thoracic transversal section of E18.5 and newborn mice (Figure 1). Indeed, BAT was observed in the interscapular, subscapular, intercostal, and neck regions and had similar anatomic distribution and mass in both genotypes (Figure 1A). Analysis of the dorsal area showed a well-defined layer of subcutaneous Oil-red O stained (Figure 1B), Perilipin-1 expressing adipocytes (Figure 1C) located throughout the hypodermis as well as the dermis of all examined Agpat2+/+ and Agpat2−/− mice. The thin layer of anterior-subcutaneous WAT (scWAT) was nearly intact in the Agpat2−/− mice (Figure 1B–C). Interestingly, interscapular WAT, which normally covers the two lobes of interscapular BAT in adult mice [19], [20], was absent in E18.5 embryos and newborn (P0.5) Agpat2+/+ and Agpat2−/− mice but it was detectable soon after birth exclusively in Agpat2+/+ (data not shown). This suggests that this particular WAT depot is always absent in the Agpat2−/− mice, possibly because most of its development is postnatal and coincides with times when adipose degeneration is already active in these animals. Interestingly, depots of posterior-subcutaneous WAT, which are located mainly in the dorsal-lumbar and lower ventral regions of the adult mice [20], [21], [22], [23], were observed in transverse sections of the inguinal region of both Agpat2+/+ and Agpat2−/− newborn mice (Supplementary Figure 1A–B).
Figure 1.

Late fetuses and newborn Agpat2−/−mice have normal adipose tissue mass, anatomical distribution and Perilipin-1 expression. (A) Oil red O/hematoxylin stained transversal thoracic sections revealed normal distribution of adipose tissue in E18.5 fetuses and newborn Agpat2+/+ and Agpat2−/− mice. (B) Higher magnification of the dorsal areas stained with Oil red O showed a thin layer of lipid-laden cells in the hypodermis corresponding to developing subcutaneous white adipose tissue (scWAT) in animals of both genotypes. scWAT is separated from the interscapular brown adipose tissue (iBAT) by the panniculus carnosus muscle (outlined by dashed line) (C) Perilipin-1 immunofluorescence staining (green) revealed that lipid-laden cells correspond to adipocytes expressing Perilipin-1. F-actin was detected with Phalloidin/rhodamine (red), indicating skeletal muscle. Nuclei were stained with DAPI (blue). Images are representative of 6 embryos or fetuses per genotype and age.
Histological analysis at postnatal times showed that subcutaneous adipocytes in wild type mice continuously increased their cell volume over the course of the first week (Figure 2A, upper panels). In Agpat2−/− newborn mice at day P0.5, subcutaneous adipocytes were smaller and their size did not increase during the following days (Figure 2A, lower panels). Instead, the subcutaneous space of Agpat2−/− mice was filled with multilocular cells that lacked adipocyte morphology (Figure 2A, lower panels).
Figure 2.

Postnatal adipose tissue development and growth are impaired in Agpat2−/−mice. (A–B) Paraffin-embedded sections of anterior scWAT and iBAT from Agpat2+/+ and Agpat2−/− mice were obtained at different days of postnatal life and stained with Hematoxylin and Eosin. Slides were photographed at 40× magnification. Images are representative of N > 6 per genotype and age (C, F) Three-dimension digital reconstruction of Perilipin-1 stained (green) adipose tissue depots from Agpat2+/+ and Agpat2−/− mice at P0.5 (C) and P4.5 (F), DAPI was used to stain nuclei (blue). (D) Histogram shows adipocyte size distribution in scWAT of Agpat2+/+ and Agpat2−/− newborn mice (P0.5). (E) Quantitative comparison of total number of adipocyte per field in scWAT of newborn and P4.5 Agpat2−/− mice. Adipocyte number and size were analyzed using Adiposoft software. At least 1000 adipocytes and 5–6 different areas per mouse (N = 4) were analyzed. (G–H) Adipose tissue mRNA markers were assessed by qPCR in scWAT and iBAT depots at different pre and postnatal time points. Graphs represent the relative abundance of each transcript normalized to 36B4 mRNA. The bars show the mean ± standard deviation (SD) of N = 6. ***p < 0.001 compared to Agpat2+/+ mice at E18.5.
In contrast to scWAT, abundant BAT was present in newborn Agpat2−/− mice. Analysis of interscapular BAT (iBAT) showed normal multilocular brown adipocytes in the Agpat2−/− mice at the time of birth (P0.5) (Figure 2B), indicating that brown adipocyte commitment and differentiation is normal in AGPAT2 deficient fetuses. Starting from P2.5, the iBAT of Agpat2−/− mice showed aberrant lipid accumulation in brown adipocytes and progressive tissue deterioration, including a reduced number of multilocular adipocytes, abundant unilocular lipid laden cells, and inflammatory cell infiltration. At day P6.5, BAT was completely replaced by an amorphous basophilic material, cell debris, mononuclear cells and giant histiocytes surrounding large lipid drops, possibly reflecting coalesced material from dead adipocytes (Figure 2B).
Three-dimensional reconstruction of Perilipin-1 stained scWAT from newborn mice (Figure 2C) and adipocyte size quantification confirmed that most adipocytes were smaller in the Agpat2−/− mice (Figure 2D). In addition, adipocyte number was drastically reduced at P2.5 in Agpat2−/− mice (Figure 2E). Three-dimensional reconstruction of Perilipin-1 stained scWAT and iBAT sections from P4.5 mice supported that the AT in Agpat2−/− mice had abnormal adipocytes and disorganized architecture (Figure 2F).
Gene expression analysis of adipocyte markers and adipogenic transcription factors was performed in AT at various times during the postnatal period. In the scWAT of wild type mice, mRNA levels of Leptin, Adiponectin, Perilipin-1, PPARγ and AGPAT2, progressively increased during the first week of life (Figure 2G) as has been previously observed [22]. In contrast, the mRNA level of these genes remained either undetectable (Leptin) or very low (Adiponectin, Perilipin-1, PPARγ) in Agpat2−/− scWAT (Figure 2G). In agreement with the morphological normality of BAT in newborn Agpat2−/− mice (Figure 2B), transcript levels of Adiponectin, UCP1, CIDEA and PPARγ were similar between Agpat2+/+ and Agpat2−/− mice at day P0.5 (Figure 2H). However, and matching the morphological deterioration of BAT in aging Agpat2−/− mice, the expression levels of these genes progressively decreased after birth (Figure 2H). Interestingly, AT degeneration coincides with increased lipid accumulation in the livers of Agpat2−/− mice (Supplementary Figure 1C), suggesting that the development of the lipodystrophic phenotype triggers insulin resistance in these mice.
Transmission electron microscopy (TEM) analysis of adipocytes from anterior scWAT sections revealed a number of ultrastructural anomalies in white adipocytes of newborn Agpat2−/− mice. Whereas Agpat2+/+ adipocytes were large, with one or two big sized LDs (Figure 3A), and had normally structured mitochondria (Figure 3C) and abundant caveolae in the plasma membrane (Figure 3C, red arrowheads); Agpat2−/− adipocytes were smaller, had multiple LDs (Figure 3B), their mitochondria showed abnormal internal complexity (Figure 3D), and they had a markedly decreased number of caveolae (Figure 3D–E). Furthermore, Agpat2−/− adipocytes showed abundant autophagic structures (Figure 3F–I, encircled in dashed red lines; 3J). To evaluate whether the lack of caveolae in Agpat2−/− adipocytes is due to reduced levels of Caveolin-1, a major structural protein of caveolae [24], Caveolin-1 was inmunostained in the scWAT of these mice. Intriguingly, three-dimensional reconstruction of confocal images showed equivalent levels of Caveolin-1 in Agpat2+/+ and Agpat2−/− adipocytes (Figure 3K–L). However, most Agpat2−/− adipocytes showed abnormal distribution of Caveolin-1 (Figure 3K), possibly indicating altered trafficking or mislocalization of this protein in structures other than caveolae.
Figure 3.

Transmission electron microscopy reveals ultrastructural abnormalities in scWAT from newborn Agpat2−/−mice. (A–D) Representatives images of scWAT of Agpat2+/+ and Agpat2−/− mice. Caveolae are depicted by red arrowhead. (E) Quantification of caveolae normalized against membrane length. (F–I) scWAT of Agpat2−/− mice show small adipocytes with numerous lipid droplets (LD), abnormal mitochondria (m), autophagic structures (enclosed by dashed red lines for clarity), and absence of plasma membrane caveolae. (J) Representative quantification of autophagic structures per adipocyte on section. For image comparative analysis and quantification, 20 adipocytes per sample were analyzed with a total of N = 3 samples per experimental group. (K) Representative confocal co-immunofluorescence of caveolin-1 (red) and CD31 (magenta) on scWAT of newborn mice. Asterisks indicate Agpat2−/− adipocytes with plasma membrane-associated Caveolin-1. (L) Quantitation of caveolin-1 immunofluorescence signal in adipocytes.
Combined, these observations suggest that both BAT and subcutaneous WAT adipocyte precursor commitment and differentiation take place normally in Agpat2−/− fetuses and that postnatal lipodystrophic degeneration affects both lineages equally in these mice. Even though Agpat2−/− mice are born with near normal BAT at the histological and molecular level the scWAT has distinct morphological abnormalities.
3.2. Lack of AGPAT2 triggers postnatal adipocyte death in mice
To evaluate the mechanism of postnatal AT degeneration in Agpat2−/− mice, cell death was assessed by TUNEL staining and TEM. TUNEL-positive cells were undetectable in AT of wild type mice at days P0.5 and P4.5 (Figure 4A, left panels). In contrast, at day P0.5, TUNEL-positive cells were present in the scWAT of Agpat2−/− mice and were very abundant in both scWAT and BAT at day P4.5 (Figure 4A, right panels). Three-dimensional reconstruction and surface rendering of confocal data from TUNEL/Perilipin-1 double-labeled scWAT (Figure 4B, upper panel) or BAT (Figure 4B, lower panel) sections revealed that most of the TUNEL-positive nuclei belonged to adipocytes in the Agpat2−/− mice. Moreover, pyknotic nuclei were abundant in Agpat2−/− BAT (Figure 2B, dashed area in high magnification panel).
Figure 4.

The loss of adipose tissue in Agpat2−/−mice is associated with massive cell death and adipose inflammation. (A) Paraffin-embedded sections of scWAT and iBAT from Agpat2+/+ and Agpat2−/− littermates were assessed by TUNEL staining. (B) 3D slide reconstruction and surface rendering of confocal data from TUNEL/Perilipin-1 double-labeled scWAT and iBAT from P2.5 mice. Volume-rendering in yellow color highlights TUNEL and DAPI co-localization. (C) TEM of degenerating adipocytes in scWAT and iBAT from Agpat2−/− mice at P4.5. scWAT: red arrows indicate apoptotic bodies, yellow arrows indicate free lipid material (free “LDs”), red arrowhead indicates a phagocytic cell, blood vessel is outlined by a red dashed line. iBAT: red dashed areas show trace of extensive cell disintegration and leakage of intracellular components including lipid material. (D) Paraffin-embedded sections of scWAT and iBAT from Agpat2+/+ and Agpat2−/− littermates were stained with anti-MAC-2 and detected by immunofluorescence. (E) The mRNA level of genes involved in inflammatory response were assessed by qPCR at different postnatal time points in iBAT of Agpat2+/+ and Agpat2−/− mice. Graphs show the relative abundance of each transcript normalized to 36B4 mRNA. The bars show the means ± SD of N = 8. *** denote significant difference (p < 0.001) compared to Agpat2+/+ mice at E18.5.
TEM analysis revealed that the degeneration of the scWAT in Agpat2−/− mice was also characterized by abundant apoptotic bodies of varying size (Figure 4C, red arrows), residual “free LDs” in the interstitial space (Figure 4C, yellow arrows) and neighboring phagocyte (Figure 4C, yellow arrowhead) surrounding the free lipid material extruded from dead adipocytes. Interestingly, “free LDs” have been previously described in models of obesity-associated adipocyte death, which is characterized by morphological features of necrosis, apoptosis, and pyroptosis [25], [26]. The examination of degenerating BAT also showed large areas of terminal cell disintegration with fragments of intracellular components, including abundant “free lipid” material (Figure 4C, areas outlined by red dashed lines) suggesting secondary necrosis [27].
Abundant non-adipocyte cells were detected in the AT of Agpat2−/− mice (Figure 2, Figure 4C). We speculated that they corresponded to inflammatory cells infiltrating the degenerating AT of Agpat2−/− mice. To determine the identity of these cells, the macrophage cell-surface marker MAC-2 was assessed by immunofluorescence. At day P0.5, MAC-2 expressing cells were undetectable in the AT of both genotypes (data not shown); however, abundant MAC-2 positive macrophages were exclusively present in AT from Agpat2−/− mice at day P4.5, remaining undetectable in the wild type mice at that time (Figure 4D). Consistent with this observation, mRNA levels for NFκB, Caspase-1, TNFα and IL-6 were increasingly abundant in the iBAT of Agpat2−/− mice (Figure 4E).
These observations indicate that massive adipocyte death precludes the postnatal expansion and maintenance of WAT and BAT in Agpat2−/− newborn mice and suggest that inflammatory infiltration plays a role in the lipodystrophic phenotype of these mice.
3.3. AGPAT2 deficient MEFs have impaired adipocyte differentiation in vitro
To further analyze the importance of AGPAT2 for adipocyte differentiation, we evaluated the capacity of post-confluent mouse embryonic fibroblasts (MEFs) to differentiate into adipocyte-like cells in vitro.
After 6 days of adipogenic differentiation, nearly 50% of Agpat2+/+ MEFs accumulated neutral lipids as determined by BODIPY staining and cellularity analysis (Figure 5A–B). By contrast, only 28% of Agpat2−/− MEFs differentiated to adipocyte-like cells (Figure 5A–B) and the total concentration of triglycerides was significantly lower in these cells (Figure 5C). The mRNA levels of key transcriptional regulators, enzymes, lipid transporters, lipid droplet (LD) associated proteins, and adipokines were also lower in adipogenically differentiated Agpat2−/− MEFs (Figure 5D).
Figure 5.

Adipogenic differentiation of Agpat2−/−MEFs results in significantly fewer neutral lipid-laden cells after 6 days of differentiation. (A) Representative images (N > 10) from 6 days differentiated MEFs stained with the neutral lipid dye BODIPY and DAPI. (B) Graph shows the grade of adipogenic differentiation expressed as percentage of BODIPY stained cells. (C) Graph shows total cellular triglycerides quantified by an enzymatic-colorimetric method. (D) mRNA levels of adipogenic transcription factors and adipocyte related markers were quantified by qPCR. Gene expression was normalized to 36B4 mRNA levels and presented as fold-change relative to non-differentiated Agpat2+/+ MEFs. Data correspond to the means ± SD of six independent experiments (N > 10). ***p < 0.001 and **p < 0.01 denote statistically significant difference compared to differentiated Agpat2+/+ MEFs after 6 days of differentiation. (E) Three dimensional digital reconstruction of fluorescence stacks of differentiated Agpat2+/+ and Agpat2−/− MEFs stained with BODIPY and anti-Perilipin-1 antibody. (F) Representative confocal images of Caveolin-1 (red) and lipid droplets (green) in MEFs after 6 days of adipogenic differentiation. Caveolin-1 preferentially marks the plasma membrane but also intracellular structures, possibly the Golgi complex (white arrowheads).
Perilipin-1 and Caveolin-1, both highly enriched proteins in mature adipocytes, were immunostained in MEFs after 6 days of differentiation to determine the phenotype of the lipid-laden cells. Abundant Perilipin-1 (Figure 5E) and Caveolin-1 (Figure 5F) were coating LDs and decorating the plasma membrane, respectively, in differentiated lipid-laden Agpat2+/+ MEFs. Interestingly, although lipid-laden cells were smaller in cultured Agpat2−/− MEFs, Perilipin-1 properly coated LDs (Figure 5E). By contrast, Caveolin-1 was irregularly distributed, with a higher proportion localized in intracellular structures, possibly the Golgi complex (Figure 5F, white arrowheads). This abnormal distribution of Caveolin-1 was also present in subcutaneous adipocytes of Agpat2−/− mice (Figure 3K).
TEM analysis of differentiated MEFs revealed ultrastructural differences between genotypes (Figure 6). Along with their characteristic large LDs, differentiated Agpat2+/+ MEFs showed abundant well-structured mitochondria (Figure 6A). In contrast, differentiated lipid-laden Agpat2−/− MEFs had fewer mitochondria and the internal structure of these organelles was altered (Figure 6A–B). Similar to subcutaneous adipocytes of Agpat2−/− mice (Figure 3F–I), AGPAT2 deficient MEFs had significant accumulation of autophagic structures (Figure 6A, C, yellow arrowheads; 6D). Also as observed in mice adipocytes (Figure 3C–D), caveolae were abundant in the plasma membrane of differentiated Agpat2+/+ MEFs but were virtually absent in Agpat2−/− MEFs (Figure 6E–F). To further characterize autophagy in differentiating Agpat2−/− MEFs, autophagy-related (ATG) proteins were assessed by immunoblotting. ATG12-ATG5 conjugate is essential for autophagosome formation [28], [29] and has been shown to increase during the adipogenic differentiation in MEFs [30]. Here, we observed that ATG12-ATG5 conjugates were progressively increased as differentiation progressed in MEFs of both genotypes, but were significantly higher in Agpat2−/− MEFs at all the time points (Supplementary Figure 2A). In contrast, levels of Beclin, which is an important regulator of vesicle nucleation during the initial steps of autophagy [28], were similar between Agpat2+/+ and Agpat2−/− MEFs during adipogenic differentiation (Supplementary Figure 2B).
Figure 6.

AGPAT2 deficiency is associated with ultrastructural abnormalities in differentiated MEFs. Transmission electron microscopy of differentiated Agpat2+/+ and Agpat2−/− MEFs at day 6 post adipogenic induction. (A) Comparative images show lipid-laden cells from differentiated Agpat2−/− MEFs (right panel) have aberrant mitochondria (m) and numerous autophagic structures (yellow arrowheads) in comparison with differentiated Agpat2+/+ MEFs (left panel). (B) Representative imaging of mitochondria from differentiated Agpat2−/− MEFs. (C) Representative imaging of autophagic structures that were observed only in differentiated Agpat2−/− MEFs. (D) Relative percentage of lipid-laden cells containing more than 20 autophagic compartments per whole cell. (E) Representative imaging of plasma membrane contrasting the differences in the density of caveolae (red arrowheads) in differentiated MEFs of both genotypes. (F) Quantification of plasma membrane-associated caveloae normalized against membrane area. For image analysis and quantification, 10 differentiated lipid-laden cells per independent sample were imaged in each experiment with a total of N = 4 samples per experimental group).
Taken together, our results support the idea that Agpat2−/− MEFs are able to initiate the process of adipogenic differentiation; however, they undergo a wide variety of cellular abnormalities that finally block the terminal phase of adipogenesis.
3.4. PPARγ overexpression partially rescues adipogenesis in Agpat2−/− MEFs
The nuclear receptor PPARγ, as well as the C/EBP family of transcription factors, are critical regulators of adipogenesis [31], [32]. Therefore, we assessed the expression levels of C/EBPs and PPARγ during the adipogenic differentiation of MEFs. As expected, adipogenic induction resulted in early expression of C/EBPβ and C/EBPδ, followed by upregulation of C/EBPα and PPARγ mRNA and protein levels in Agpat2+/+ MEFs (Figure 7A–B). C/EBPβ, -δ, -α, and PPARγ were also increased after adipogenic induction of Agpat2−/− MEFs, but the expression level of these markers was significantly lower at all the time points (Figure 7A–B). In spite of these differences, differentiated lipid-laden Agpat2−/− MEFs have similar intensity of PPARγ immunofluorescence signal than wild type differentiated lipid-laden MEFs (Figure 7C).
Figure 7.

Overexpression of PPARγ2 increases the proportion of lipid laden-cells and the gene expression profile but not the morphology of differentiated Agpat2−/−MEFs. (A) qPCR quantification of C/EBPs and PPARγ mRNA levels at early and late stages of adipogenic differentiation. Data were normalized to 36B4 mRNA levels and expressed as relative fold changes to non-differentiated Agpat2+/+ MEFs at day 0. (B) Immunoblot analysis of whole-cell protein extracts from Agpat2+/+ and Agpat2−/− MEFs at different days of differentiation. 50 μg of proteins were loaded, β-actin was used as loading control. (C) Confocal immunofluorescence analysis of PPARγ in Agpat2+/+ and Agpat2−/− MEFs at two different stages of adipocyte differentiation. Graphs show the relative total immunofluorescence signal of nuclear PPARγ per cell. (D) Time-line showing the adipogenic differentiation protocol used on primary cultures of Agpat2+/+ and Agpat2−/− MEFs previously infected with recombinant adenoviruses. (E) Adipogenic differentiation expressed as percentage of BODIPY stained cell after 6 days of differentiation. (F) Total cellular triglycerides quantified by an enzymatic-colorimetric method. (G) mRNA levels of adipogenic transcription factors and adipocyte related markers were quantified by qPCR. Gene expression was normalized to 36B4 mRNA levels and presented as fold-change relative to non-differentiated Agpat2+/+ MEFs. (H) Three dimensional digital reconstruction of fluorescence stacks of differentiated Agpat2+/+ and Agpat2−/− MEFs immunostained with anti-Perilipin-1 antibody (pink). Neutral lipids were stained with BODIPY (green). All bar graphs show mean ± SD of three independent experiments (N > 6). *** (p < 0.001), **(p < 0.01) and *(p < 0.05) denote significant difference compared to Agpat2+/+ MEFs.
To test if PPARγ overexpression could rescue the capacity of Agpat2−/− MEFs to undergo full adipogenesis in vitro, post-confluent MEFs were infected with a PPARγ2 encoding adenovirus 24 h before adipogenic induction (Figure 7D). As previously reported [33], [34], [35], [36], we observed that overexpression of PPARγ2 enhanced the adipogenic potential of Agpat2+/+ MEFs in comparison with Agpat2+/+ MEFs uninfected or infected with a LacZ encoding adenovirus (data not shown). In Agpat2−/− MEFs, PPARγ2 overexpression significantly increased the proportion of adipocyte-like cells after 6 days of differentiation (Figure 7E), as well as the total TG concentration (Figure 7F) and mRNA levels of adipocyte markers (Figure 7G) in comparison with Agpat2−/− MEFs infected with a LacZ encoding adenovirus. Overexpression of PPARγ2 was unable to rescue the abnormal cellular morphology of differentiated Agpat2−/− MEFs (Figure 7H). We noted that the proportion of lipid-laden Agpat2−/− cells progressively declined during the course of the differentiation, in contrast with wild type cells that remained constant (Supplementary Figure 2B). This anomaly was not corrected by PPARγ2 overexpression (Supplementary Figure 2B), suggesting that PPARγ defects are not the main driving force for abnormal adipogenesis in AGPAT2 deficient adipocytes. To evaluate whether this decreasing number of Agpat2−/− lipid-laden cells was the result of increased cell death, TUNEL analysis was performed in adipogenically induced MEFs cultures. Similar to our findings in postnatal adipose tissue of Agpat2−/− mice (Figure 4A), a higher number of differentiated Agpat2−/− MEFs was TUNEL-positive, in comparison with wild type MEFs (Supplementary Figure 2C, left panels) and PPARγ2 overexpression was unable revert the cell death of Agpat2−/− MEFs (Supplementary Figure 2C, right panels).
3.5. Accumulation of phosphatidic acid and altered phospholipid composition in differentiated Agpat2−/− MEFs
An altered phospholipid composition may perturb membrane remodeling, intracellular signaling, autophagy, and LD expandibility during adipogenesis [37], [38] and thus may be a determinant of death in AGPAT2 deficient adipocytes. Supporting this idea, it was previously reported that Caveolin-1 deficient adipocytes have abnormal phospholipid composition which is a determinant of small-sized LDs [39]. Moreover, epidimal WAT and BAT depots from adipose-specific Seipin knockout mice have accumulation of several lipid species, including phospholipids, which is accompanied with cell stress and cell death of AT [40].
Since the conversion of LPA to PA by AGPATs is an intermediary step involved in glycerophospholipid biosynthesis pathway (Figure 8A) and AGPAT2 expression is strongly elevated during adipocyte differentiation [11], we aimed to determine whether the absence of AGPAT2 generates unbalanced levels of LPA, PA and potentially other phospholipids during adipogenesis. Therefore, we quantified the abundance of total LPA, PA and major phospholipids in differentiated Agpat2−/− MEFs. Mass spectrometry analysis revealed no significant differences in the LPA content between differentiated Agpat2−/− and Agpat2+/+ MEFs. In contrast, levels of PA were ∼3-fold higher in differentiated Agpat2−/− MEFs in comparison with wild type MEFs (Figure 8B), indicating that alternative pathway(s) exist for the synthesis of PA in the absence of AGPAT2. Although the specific molecular identity of the fatty acid moieties composing PA were not revealed by our mass spectrometry analysis, differentiated Agpat2−/− MEFs had significantly elevated levels of 32:1, 32:0 and 34:1 PA species (Figure 8C). In addition, increased levels of phosphatidylcholine (PC) and decreased levels of phosphatidylserine (PS), phosphatidylinositol (PI) and phosphatidylglycerol (PG), were detected in differentiated Agpat2−/− MEFs (Figure 8D). Therefore, complex changes in the phospholipid composition may disrupt not only the production of lipid mediators but also the membrane properties, lipid droplet expansion, and adipocyte survival of AGPAT2 deficient adipocytes.
Figure 8.

Phospholipid quantification in differentiated Agpat2+/+and Agpat2−/−MEFs. (A) Pathways for PA and phospholipid synthesis in mammals. (B–C) Electron spray ionization-mass spectrometric analysis of phospholipids in differentiated Agpat2+/+ and Agpat2−/− MEFs. AGPAT: 1-acyl-sn-glycerol-3-phosphate acyltransferase; CL: cardiolipin; DAG: diacylglycerol; LPA: lysophosphatidic acid; PA: phosphatidic acid; PC: phosphatidylcholine; PE: phosphatidylethanolamine; PG: phosphatidylglycerol; PI: phosphatidylinositol; PS: phosphatidylserine; TAG: triacylglycerol. All bar graphs show mean ± SD of three independent experiments (N > 6). ***p < 0.001, **p < 0.01 and *p < 0.05 denote significant difference compared to differentiated Agpat2+/+ MEFs.
4. Discussion
Here we report that, in contrast to adult Agpat2−/− mice, late fetuses and newborn Agpat2−/− mice have near normal scWAT and iBAT with similar distribution and mass as in the wild type littermates and that lipodystrophy results from massive adipocyte death during the first week of life. At the ultrastructural level, white adipocytes in newborn Agpat2−/− were smaller and had a marked reduction of plasma membrane caveolae, abnormally structured mitochondria and irregular LDs. In addition, enhanced accumulation of autophagic structures observed in Agpat2−/− adipocytes suggests that alternative pathways might be responsible for the widespread adipocyte death observed in the days following birth.
Our in vitro studies underscore the importance of AGPAT2 during adipogenesis. It is noteworthy that Agpat2−/− MEF cells were able to differentiate into adipocyte-like cells but in a lower proportion than Agpat2+/+ MEFs. This difference was evident at early stages of adipogenesis and manifested by severely reduced abundance of C/EBPs and PPARγ at both the mRNA and protein levels. Nonetheless, immunofluorescence analysis suggested that the levels of nuclear PPARγ was equivalent between differentiated lipid-laden Agpat2−/− and wild type MEFs. Treatment of Agpat2−/− MEFs with the PPARγ agonist, rosiglitazone, during adipogenic induction did not improve adipogenesis (data not shown); however, overexpression of PPARγ2 increased the proportion of Agpat2−/− MEFs with adipocyte-like phenotype after adipogenic induction, although it did not prevent the increased death of differentiated Agpat2−/− MEFs. Importantly, Agpat2−/− lipid-laden MEFs also exhibit other additional hallmarks of adipogenic differentiation, including neutral lipid accumulation, presence of Perilipin-1 coated LDs and the expression of downstream adipogenic marker proteins such aP2/FABP4 and ATGL (data not shown). Combined, these results suggest that adipogenic actions of AGPAT2 may operate upstream of PPARγ and that PPARγ deficiency is not a major determinant of the impaired adipogenesis of Agpat2−/− MEFs.
In spite of these findings, we observed several ultrastructural abnormalities in differentiated Agpat2−/− MEFs, suggesting that these cells lack the ability to sustain the differentiation process to reach a fully mature adipocyte phenotype and eventually they die.
Interestingly, the small cellular size, the irregular localization of Caveolin-1 and the remarkable absence of caveolae in differentiated Agpat2−/− MEFs suggest that the lipodystrophy associated with mutations in AGPAT2, CAV1, or PTRF genes [41], [42], [43], [44] may be mechanistically connected. Indeed, recent studies have shown that: 1) caveolae protect adipocytes against lipotoxicity-induced autolysis [45]; 2) changes in Caveolin-1 distribution are related with the disappearance of caveolae in the plasma membrane [46]; 3) autophagosome formation is constitutively activated in Caveolin-1 deficient adipocytes and in differentiated Cav1−/− MEFs [47]; and 4) Cav1−/− adipocytes have increased levels of reactive species oxygen (ROS) and mitochondrial dysfunction in association with widespread adipocyte death [48], [49].
Notably, excessive accumulation of autophagic structures was also present in differentiated Agpat2−/− MEFs, in association with increased ATG12/ATG5 complex but not Beclin levels. It is possible that the extensive accumulation of autophagic structures observed in Agpat2−/− lipid-laden cells, as well as in Agpat2−/− adipocytes in vivo, result from an altered autophagic flux or failed elimination of autophagic debris in these cells. It is also possible that the intracellular dysregulation of lipid species in differentiated Agpat2−/− MEFs plays a role on this phenomenon. Therefore, detailed studies on autophagy dynamics will be needed to determine the actual status of autophagic processes in Agpat2−/− adipocytes and its role in the lipodystrophy of Agpat2−/− mice [50].
We found an altered phospholipid composition in AGPAT2 deficient MEFs. At this point, we do not know whether the altered phospholipid levels are a consequence of abnormal lipid metabolism during adipogenesis of AGPAT2 deficient MEFs. Similarly, our studies do not allow us to conclude a causal role of phospholipid composition abnormalities on the adipogenic inability of Agpat2−/− MEFs. Interestingly, increased levels of PA have been reported in other cellular models of adipogenic impairment, including OP9 and 3T3-L1 cells in which AGPAT2 [11] and Seipin [51] were knocked down, respectively. Indeed, mutations in the Bscl2/Seipin gene also cause CGL in humans [52] and mice [40], [53], [54], and in vitro studies with Seipin deficient cells have shown impaired adipogenesis [53], [55], altered lipid metabolism [56], high levels of PA and supersized LD [57], [58], [59]. Additionally, epidimal WAT and BAT depots from adipose-specific Seipin knockout mice have increased levels of total PA, ER-stress, inflammation and cell death [40].
Interestingly, a recent study demonstrated that Seipin, AGPAT2, and Lipin-1 physically interact with each other forming a complex in the ER during adipogenesis [60]. This interaction may regulate an efficient flux of PA to specific pathways during adipogenic differentiation and also may be important for adipocyte growth. Therefore, a tentative hypothesis is that the disruption of Seipin-AGPAT2-Lipin-1 complex by the absence of one of these proteins may dysregulate other intracellular processes in which PA is implicated, including signaling, membrane trafficking and remodeling and autophagy. In support of this hypothesis, it was recently reported that increased PA levels due to Lipin-1 deficiency have deleterious effects on mitochondrial function and also impairs the autophagy flux in muscle, leading to accumulation of autophagy-related structures [61].
Although the mechanisms responsible for the elevated PA levels in AGPAT2 deficient cells remain unknown, alternative metabolic pathways must be activated to allow the synthesis of PA in these cells. In addition to the AGPAT-dependent synthesis, PA can be generated by hydrolysis of phosphatidylcholine or cardiolipin by phospholipase D superfamily members [62], [63], [64]. PA can also be generated by phosphorylation of diacylglycerol (DAG) through the action of DAG kinases (DAGK) [65] or by the addition of a fatty acid side chain to LPA through the action of other-non AGPAT LPA acyl transferases [66], [67]. A recent study did show the upregulation of Dagk and Pld in the livers of Agpat2−/− mice [68]. Further studies will be required to biochemically dissect these pathways and to elucidate the mechanism of abnormal phospholipid composition in adipogenically differentiated Agpat2−/− MEFs.
A limitation of our study is that we could not study the in vivo lipid composition of Agpat2−/− adipocytes. This was due to our technical inability to dissect the very minute mass of scWAT in embryos and newborn mice. Ongoing strategies are aimed to generate mouse models to purify specific cell populations in Agpat2−/− mice. These will provide new tools to assess the role of specific lipid species in the ultrastructural anomalies dependent on AGPAT2 deficiency in adipocytes and for dissecting the specific mechanisms by which adipocyte cell death causes lipodystrophy in Agpat2−/− mice.
In summary, we show that Agpat2−/− mice are born with AT, which undergoes a rapid degenerative process that leads to the total destruction of AT during the first week after birth. At the ultrastructural level, Agpat2−/− adipose tissue has decreased caveolae, abnormally conformed mitochondria and LDs amid abundant autophagic structures. Adipocyte-like cells from differentiated Agpat2−/− MEFs recapitulate the abnormal phenotype observed in scWAT of Agpat2−/− newborn mice and have an abnormal phospholipid composition.
Based on our in vivo and in vitro findings, we propose AGPAT2 deficient adipocytes have an impaired capacity to adapt to the massive lipid availability associated with postnatal feeding, leading to cellular stress, death and inflammatory destruction of adipose tissue.
Author contributions
V.A.C. and J.D.H designed and wrote the grant. K.M.C designed specific aims, experiments and procedures. K.M.C performed the experiments and data analysis under the guidance of V.A.C. and J.D.H., which also contributed with additional funding and research support. C.O.L performed TUNEL/Perilipin-1 double-staining in tissues. Further reagents, materials, analysis tools and advice were provided by C.O.L., P.J.T., A.G and A.A. The manuscript was written by K.M.C. and V.A.C. All authors critically read and contributed to the manuscript.
Acknowledgments
The authors want to thank Dr. Philip Scherer for reviewing the manuscript and providing critical comments and suggestions, and to Dr. Ana Maria Cuervo for her advice on the analysis and interpretation of autophagy-related structures. We also want to thank Mr. John M. Shelton from UTSW for histological suggestions and discussions in processing tissue samples, Mrs. Judy Sanchez from UTSW for her invaluable technical support with the mouse colony and Katie Tunison from UTSW for technical assistance and copyediting in the manuscripts. V.A.C was funded by Fondecyt Grant 1141134 (Chile). K.M.C. was supported by CONICYT Doctoral Fellowship program grants 21090704, 24120971, 75120111 (Chile). J.D.H was funded by the NIH (U.S.) grant P01 DK088761. A.G and A.K.A. were supported by National Institutes of Health Grants DK54387 and the Southwestern Medical Foundation. Phospholipid composition analysis was performed at the Kansas Lipidomics Research Center Analytical Laboratory, supported by National Science Foundation grants EPS 0236913, MCB 0455318 and 0920663, and DBI 0521587, NIH P20RR16475, Kansas State University, the Kansas Technology Enterprise Corp., and K-IDeA Networks of Biomedical Research Excellence.
Footnotes
Supplementary data related to this article can be found online at http://dx.doi.org/10.1016/j.molmet.2016.05.004.
Contributor Information
Jay D. Horton, Email: jay.horton@utsouthwestern.edu.
Víctor A. Cortés, Email: vcortes@med.puc.cl.
Conflict of interest
The authors declare no financial or commercial conflict of interest.
Appendix A. Supplementary data
The following are the Supplementary data related to this article:
Supplementary Figure 1.

(A) Oil red O/hematoxylin stained transversal sections at the inguinal level of newborn Agpat2−/− mice. Bilateral subcutaneous inguinal WAT depots (left and middle images) are located between the skin and muscle fascia just anterior to the lower segment of the hind limbs. Higher magnification of the inguinal WAT depots stained with Oil red O (right image). (B) Perilipin-1 immunofluorescence staining (green) of inguinal WAT. F-actin was detected with phalloidin/rhodamine (red), indicating skeletal muscle. Nuclei were stained with DAPI (blue). (C) Development of hepatic steatosis matches adipose tissue destruction in Agpat2−/− mice. Histological analysis (hematoxylin-eosin staining) shows growing lipids build up in the liver of Agpat2−/− mice starting at P2.5. No differences between female and male Agpat2−/− mice were detected.
Supplementary Figure 2.

(A) Immunoblot analysis of whole-cell protein extracts from Agpat2+/+ and Agpat2−/− MEFs at different days of differentiation. 50 μg of proteins were loaded, total Akt was used as loading control. (B) At the indicated times, the number of lipid-laden cells were counted as previously described. Graph shows the percentage of lipid-laden cells. (C) TUNEL assay in 10 days differentiated MEFs.
References
- 1.Garg A. Lipodystrophies: genetic and acquired body fat disorders. Journal of Clinical Endocrinology & Metabolism. 2011;96:3313–3325. doi: 10.1210/jc.2011-1159. [DOI] [PMC free article] [PubMed] [Google Scholar]
- 2.Cortes V.A., Fernandez-Galilea M. Lipodystrophies: adipose tissue disorders with severe metabolic implications. Journal of Physiology and Biochemistry. 2015;71:471–478. doi: 10.1007/s13105-015-0404-1. [DOI] [PubMed] [Google Scholar]
- 3.Agarwal A.K., Arioglu E., De Almeida S., Akkoc N., Taylor S.I., Bowcock A.M. AGPAT2 is mutated in congenital generalized lipodystrophy linked to chromosome 9q34. Nature Genetics. 2002;31:21–23. doi: 10.1038/ng880. [DOI] [PubMed] [Google Scholar]
- 4.Garg A., Fleckenstein J.L., Peshock R.M., Grundy S.M. Peculiar distribution of adipose tissue in patients with congenital generalized lipodystrophy. Journal of Clinical Endocrinology & Metabolism. 1992;75:358–361. doi: 10.1210/jcem.75.2.1639935. [DOI] [PubMed] [Google Scholar]
- 5.Cortes V.A., Curtis D.E., Sukumaran S., Shao X., Parameswara V., Rashid S. Molecular mechanisms of hepatic steatosis and insulin resistance in the AGPAT2-deficient mouse model of congenital generalized lipodystrophy. Cell Metabolism. 2009;9:165–176. doi: 10.1016/j.cmet.2009.01.002. [DOI] [PMC free article] [PubMed] [Google Scholar]
- 6.Cortes V.A., Smalley S.V., Goldenberg D., Lagos C.F., Hodgson M.I., Santos J.L. Divergent metabolic phenotype between two sisters with congenital generalized lipodystrophy due to double AGPAT2 homozygous mutations. A clinical, genetic and in silico study. PLoS One. 2014;9 doi: 10.1371/journal.pone.0087173. [DOI] [PMC free article] [PubMed] [Google Scholar]
- 7.Agarwal A.K., Garg A. Congenital generalized lipodystrophy: significance of triglyceride biosynthetic pathways. Trends in Endocrinology and Metabolism. 2003;14:214–221. doi: 10.1016/s1043-2760(03)00078-x. [DOI] [PubMed] [Google Scholar]
- 8.Eberhardt C., Gray P.W., Tjoelker L.W. Human lysophosphatidic acid acyltransferase. cDNA cloning, expression, and localization to chromosome 9q34.3. Journal of Biological Chemistry. 1997;272:20299–20305. doi: 10.1074/jbc.272.32.20299. [DOI] [PubMed] [Google Scholar]
- 9.Hollenback D., Bonham L., Law L., Rossnagle E., Romero L., Carew H. Substrate specificity of lysophosphatidic acid acyltransferase beta – evidence from membrane and whole cell assays. Journal of Lipid Research. 2006;47:593–604. doi: 10.1194/jlr.M500435-JLR200. [DOI] [PubMed] [Google Scholar]
- 10.Agarwal A.K., Sukumaran S., Cortes V.A., Tunison K., Mizrachi D., Sankella S. Human 1-acylglycerol-3-phosphate O-acyltransferase isoforms 1 and 2: biochemical characterization and inability to rescue hepatic steatosis in Agpat2(-/-) gene lipodystrophic mice. Journal of Biological Chemistry. 2011;286:37676–37691. doi: 10.1074/jbc.M111.250449. [DOI] [PMC free article] [PubMed] [Google Scholar]
- 11.Gale S.E., Frolov A., Han X., Bickel P.E., Cao L., Bowcock A. A regulatory role for 1-acylglycerol-3-phosphate-O-acyltransferase 2 in adipocyte differentiation. Journal of Biological Chemistry. 2006;281:11082–11089. doi: 10.1074/jbc.M509612200. [DOI] [PubMed] [Google Scholar]
- 12.Subauste A.R., Das A.K., Li X., Elliot B., Evans C., El Azzouny M. Alterations in lipid signaling underlie lipodystrophy secondary to AGPAT2 mutations. Diabetes. 2012;61:2922–2931. doi: 10.2337/db12-0004. [DOI] [PMC free article] [PubMed] [Google Scholar]
- 13.Devaiah S.P., Roth M.R., Baughman E., Li M., Tamura P., Jeannotte R. Quantitative profiling of polar glycerolipid species from organs of wild-type Arabidopsis and a phospholipase Dalpha1 knockout mutant. Phytochemistry. 2006;67:1907–1924. doi: 10.1016/j.phytochem.2006.06.005. [DOI] [PubMed] [Google Scholar]
- 14.Welti R., Li W., Li M., Sang Y., Biesiada H., Zhou H.E. Profiling membrane lipids in plant stress responses. Role of phospholipase D alpha in freezing-induced lipid changes in Arabidopsis. Journal of Biological Chemistry. 2002;277:31994–32002. doi: 10.1074/jbc.M205375200. [DOI] [PubMed] [Google Scholar]
- 15.Galarraga M., Campion J., Munoz-Barrutia A., Boque N., Moreno H., Martinez J.A. Adiposoft: automated software for the analysis of white adipose tissue cellularity in histological sections. Journal of Lipid Research. 2012;53:2791–2796. doi: 10.1194/jlr.D023788. [DOI] [PMC free article] [PubMed] [Google Scholar]
- 16.Kanzaki M., Pessin J.E. Insulin-stimulated GLUT4 translocation in adipocytes is dependent upon cortical actin remodeling. Journal of Biological Chemistry. 2001;276:42436–42444. doi: 10.1074/jbc.M108297200. [DOI] [PubMed] [Google Scholar]
- 17.Kanzaki M., Pessin J.E. Caveolin-associated filamentous actin (Cav-actin) defines a novel F-actin structure in adipocytes. Journal of Biological Chemistry. 2002;277:25867–25869. doi: 10.1074/jbc.C200292200. [DOI] [PubMed] [Google Scholar]
- 18.McCloy R.A., Rogers S., Caldon C.E., Lorca T., Castro A., Burgess A. Partial inhibition of Cdk1 in G(2) phase overrides the SAC and decouples mitotic events. Cell Cycle. 2014;13:1400–1412. doi: 10.4161/cc.28401. [DOI] [PMC free article] [PubMed] [Google Scholar]
- 19.de Jong J.M., Larsson O., Cannon B., Nedergaard J. A stringent validation of mouse adipose tissue identity markers. American Journal of Physiology. Endocrinology and Metabolism. 2015;308:E1085–E1105. doi: 10.1152/ajpendo.00023.2015. [DOI] [PubMed] [Google Scholar]
- 20.Sanchez-Gurmaches J., Guertin D.A. Adipocytes arise from multiple lineages that are heterogeneously and dynamically distributed. Nature Communications. 2014;5 doi: 10.1038/ncomms5099. [DOI] [PMC free article] [PubMed] [Google Scholar]
- 21.Cinti S. The adipose organ at a glance. Disease Models & Mechanisms. 2012;5:588–594. doi: 10.1242/dmm.009662. [DOI] [PMC free article] [PubMed] [Google Scholar]
- 22.Birsoy K., Berry R., Wang T., Ceyhan O., Tavazoie S., Friedman J.M. Analysis of gene networks in white adipose tissue development reveals a role for ETS2 in adipogenesis. Development. 2011;138:4709–4719. doi: 10.1242/dev.067710. [DOI] [PMC free article] [PubMed] [Google Scholar]
- 23.Vitali A., Murano I., Zingaretti M.C., Frontini A., Ricquier D., Cinti S. The adipose organ of obesity-prone C57BL/6J mice is composed of mixed white and brown adipocytes. Journal of Lipid Research. 2012;53:619–629. doi: 10.1194/jlr.M018846. [DOI] [PMC free article] [PubMed] [Google Scholar]
- 24.Rothberg K.G., Heuser J.E., Donzell W.C., Ying Y.S., Glenney J.R., Anderson R.G. Caveolin, a protein component of caveolae membrane coats. Cell. 1992;68:673–682. doi: 10.1016/0092-8674(92)90143-z. [DOI] [PubMed] [Google Scholar]
- 25.Cinti S., Mitchell G., Barbatelli G., Murano I., Ceresi E., Faloia E. Adipocyte death defines macrophage localization and function in adipose tissue of obese mice and humans. Journal of Lipid Research. 2005;46:2347–2355. doi: 10.1194/jlr.M500294-JLR200. [DOI] [PubMed] [Google Scholar]
- 26.Giordano A., Murano I., Mondini E., Perugini J., Smorlesi A., Severi I. Obese adipocytes show ultrastructural features of stressed cells and die of pyroptosis. Journal of Lipid Research. 2013;54:2423–2436. doi: 10.1194/jlr.M038638. [DOI] [PMC free article] [PubMed] [Google Scholar]
- 27.Silva M.T., do Vale A., dos Santos N.M. Secondary necrosis in multicellular animals: an outcome of apoptosis with pathogenic implications. Apoptosis. 2008;13:463–482. doi: 10.1007/s10495-008-0187-8. [DOI] [PMC free article] [PubMed] [Google Scholar]
- 28.Maiuri M.C., Zalckvar E., Kimchi A., Kroemer G. Self-eating and self-killing: crosstalk between autophagy and apoptosis. Nature Reviews Molecular Cell Biology. 2007;8:741–752. doi: 10.1038/nrm2239. [DOI] [PubMed] [Google Scholar]
- 29.Walczak M., Martens S. Dissecting the role of the Atg12-Atg5-Atg16 complex during autophagosome formation. Autophagy. 2013;9:424–425. doi: 10.4161/auto.22931. [DOI] [PMC free article] [PubMed] [Google Scholar]
- 30.Baerga R., Zhang Y., Chen P.H., Goldman S., Jin S. Targeted deletion of autophagy-related 5 (atg5) impairs adipogenesis in a cellular model and in mice. Autophagy. 2009;5:1118–1130. doi: 10.4161/auto.5.8.9991. [DOI] [PMC free article] [PubMed] [Google Scholar]
- 31.Rosen E.D., Walkey C.J., Puigserver P., Spiegelman B.M. Transcriptional regulation of adipogenesis. Genes & Development. 2000;14:1293–1307. [PubMed] [Google Scholar]
- 32.Rosen E.D., MacDougald O.A. Adipocyte differentiation from the inside out. Nature Reviews Molecular Cell Biology. 2006;7:885–896. doi: 10.1038/nrm2066. [DOI] [PubMed] [Google Scholar]
- 33.Jin W., Takagi T., Kanesashi S.N., Kurahashi T., Nomura T., Harada J. Schnurri-2 controls BMP-dependent adipogenesis via interaction with Smad proteins. Developmental Cell. 2006;10:461–471. doi: 10.1016/j.devcel.2006.02.016. [DOI] [PubMed] [Google Scholar]
- 34.Tontonoz P., Hu E.D., Spiegelman B.M. Stimulation of adipogenesis in fibroblasts by Ppar-gamma-2, a lipid-activated transcription factor. Cell. 1994;79:1147–1156. doi: 10.1016/0092-8674(94)90006-x. [DOI] [PubMed] [Google Scholar]
- 35.Ren D.L., Collingwood T.N., Rebar E.J., Wolffe A.P., Camp H.S. PPAR gamma knockdown by engineered transcription factors: exogenous PPAR gamma 2 but not PPAR gamma 1 reactivates adipogenesis. Genes & Development. 2002;16:27–32. doi: 10.1101/gad.953802. [DOI] [PMC free article] [PubMed] [Google Scholar]
- 36.Thuillier P., Baillie R., Sha X.M., Clarke S.D. Cytosolic and nuclear distribution of PPAR gamma 2 in differentiating 3T3-L1 preadipocytes. Journal of Lipid Research. 1998;39:2329–2338. [PubMed] [Google Scholar]
- 37.Eto M., Shindou H., Koeberle A., Harayama T., Yanagida K., Shimizu T. Lysophosphatidylcholine acyltransferase 3 is the key enzyme for incorporating arachidonic acid into glycerophospholipids during adipocyte differentiation. International Journal of Molecular Sciences. 2012;13:16267–16280. doi: 10.3390/ijms131216267. [DOI] [PMC free article] [PubMed] [Google Scholar]
- 38.Hishikawa D., Hashidate T., Shimizu T., Shindou H. Diversity and function of membrane glycerophospholipids generated by the remodeling pathway in mammalian cells. Journal of Lipid Research. 2014;55:799–807. doi: 10.1194/jlr.R046094. [DOI] [PMC free article] [PubMed] [Google Scholar]
- 39.Blouin C.M., Le Lay S., Eberl A., Kofeler H.C., Guerrera I.C., Klein C. Lipid droplet analysis in caveolin-deficient adipocytes: alterations in surface phospholipid composition and maturation defects. Journal of Lipid Research. 2010;51:945–956. doi: 10.1194/jlr.M001016. [DOI] [PMC free article] [PubMed] [Google Scholar]
- 40.Liu L., Jiang Q., Wang X., Zhang Y., Lin R.C., Lam S.M. Adipose-specific knockout of SEIPIN/BSCL2 results in progressive lipodystrophy. Diabetes. 2014;63:2320–2331. doi: 10.2337/db13-0729. [DOI] [PubMed] [Google Scholar]
- 41.Razani B., Combs T.P., Wang X.B., Frank P.G., Park D.S., Russell R.G. Caveolin-1-deficient mice are lean, resistant to diet-induced obesity, and show hypertriglyceridemia with adipocyte abnormalities. Journal of Biological Chemistry. 2002;277:8635–8647. doi: 10.1074/jbc.M110970200. [DOI] [PubMed] [Google Scholar]
- 42.Liu L., Brown D., McKee M., Lebrasseur N.K., Yang D., Albrecht K.H. Deletion of Cavin/PTRF causes global loss of caveolae, dyslipidemia, and glucose intolerance. Cell Metabolism. 2008;8:310–317. doi: 10.1016/j.cmet.2008.07.008. [DOI] [PMC free article] [PubMed] [Google Scholar]
- 43.Hayashi Y.K., Matsuda C., Ogawa M., Goto K., Tominaga K., Mitsuhashi S. Human PTRF mutations cause secondary deficiency of caveolins resulting in muscular dystrophy with generalized lipodystrophy. Journal of Clinical Investigation. 2009;119:2623–2633. doi: 10.1172/JCI38660. [DOI] [PMC free article] [PubMed] [Google Scholar]
- 44.Kim C.A., Delepine M., Boutet E., El Mourabit H., Le Lay S., Meier M. Association of a homozygous nonsense caveolin-1 mutation with Berardinelli-Seip congenital lipodystrophy. Journal of Clinical Endocrinology & Metabolism. 2008;93:1129–1134. doi: 10.1210/jc.2007-1328. [DOI] [PubMed] [Google Scholar]
- 45.Meshulam T., Breen M.R., Liu L., Parton R.G., Pilch P.F. Caveolins/caveolae protect adipocytes from fatty acid-mediated lipotoxicity. Journal of Lipid Research. 2011;52:1526–1532. doi: 10.1194/jlr.M015628. [DOI] [PMC free article] [PubMed] [Google Scholar]
- 46.Briand N., Prado C., Mabilleau G., Lasnier F., Le Liepvre X., Covington J.D. Caveolin-1 expression and cavin stability regulate caveolae dynamics in adipocyte lipid store fluctuation. Diabetes. 2014;63:4032–4044. doi: 10.2337/db13-1961. [DOI] [PMC free article] [PubMed] [Google Scholar]
- 47.Le Lay S., Briand N., Blouin C.M., Chateau D., Prado C., Lasnier F. The lipoatrophic caveolin-1 deficient mouse model reveals autophagy in mature adipocytes. Autophagy. 2010;6:754–763. doi: 10.4161/auto.6.6.12574. [DOI] [PubMed] [Google Scholar]
- 48.Bosch M., Mari M., Herms A., Fernandez A., Fajardo A., Kassan A. Caveolin-1 deficiency causes cholesterol-dependent mitochondrial dysfunction and apoptotic susceptibility. Current Biology. 2011;21:681–686. doi: 10.1016/j.cub.2011.03.030. [DOI] [PMC free article] [PubMed] [Google Scholar]
- 49.Asterholm I.W., Mundy D.I., Weng J., Anderson R.G., Scherer P.E. Altered mitochondrial function and metabolic inflexibility associated with loss of caveolin-1. Cell Metabolism. 2012;15:171–185. doi: 10.1016/j.cmet.2012.01.004. [DOI] [PMC free article] [PubMed] [Google Scholar]
- 50.Klionsky D.J., Abdelmohsen K., Abe A., Abedin M.J., Abeliovich H., Acevedo Arozena A. Guidelines for the use and interpretation of assays for monitoring autophagy (3rd edition) Autophagy. 2016;12:1–222. doi: 10.1080/15548627.2015.1100356. [DOI] [PMC free article] [PubMed] [Google Scholar]
- 51.Sim M.F., Dennis R.J., Aubry E.M., Ramanathan N., Sembongi H., Saudek V. The human lipodystrophy protein seipin is an ER membrane adaptor for the adipogenic PA phosphatase lipin 1. Molecular Metabolism. 2012;2:38–46. doi: 10.1016/j.molmet.2012.11.002. [DOI] [PMC free article] [PubMed] [Google Scholar]
- 52.Magre J., Delepine M., Khallouf E., Gedde-Dahl T., Jr., Van Maldergem L., Sobel E. Identification of the gene altered in Berardinelli-Seip congenital lipodystrophy on chromosome 11q13. Nature Genetics. 2001;28:365–370. doi: 10.1038/ng585. [DOI] [PubMed] [Google Scholar]
- 53.Chen W., Yechoor V.K., Chang B.H., Li M.V., March K.L., Chan L. The human lipodystrophy gene product Berardinelli-Seip congenital lipodystrophy 2/seipin plays a key role in adipocyte differentiation. Endocrinology. 2009;150:4552–4561. doi: 10.1210/en.2009-0236. [DOI] [PMC free article] [PubMed] [Google Scholar]
- 54.Cui X., Wang Y., Tang Y., Liu Y., Zhao L., Deng J. Seipin ablation in mice results in severe generalized lipodystrophy. Human Molecular Genetics. 2011;20:3022–3030. doi: 10.1093/hmg/ddr205. [DOI] [PubMed] [Google Scholar]
- 55.Chen W., Chang B., Saha P., Hartig S.M., Li L., Reddy V.T. Berardinelli-seip congenital lipodystrophy 2/seipin is a cell-autonomous regulator of lipolysis essential for adipocyte differentiation. Molecular and Cellular Biology. 2012;32:1099–1111. doi: 10.1128/MCB.06465-11. [DOI] [PMC free article] [PubMed] [Google Scholar]
- 56.Chen W., Zhou H., Liu S., Fhaner C.J., Gross B.C., Lydic T.A. Altered lipid metabolism in residual white adipose tissues of Bscl2 deficient mice. PLoS One. 2013;8:e82526. doi: 10.1371/journal.pone.0082526. [DOI] [PMC free article] [PubMed] [Google Scholar]
- 57.Szymanski K.M., Binns D., Bartz R., Grishin N.V., Li W.P., Agarwal A.K. The lipodystrophy protein seipin is found at endoplasmic reticulum lipid droplet junctions and is important for droplet morphology. Proceedings of the National Academy of Sciences of the United States of America. 2007;104:20890–20895. doi: 10.1073/pnas.0704154104. [DOI] [PMC free article] [PubMed] [Google Scholar]
- 58.Fei W., Shui G., Gaeta B., Du X., Kuerschner L., Li P. Fld1p, a functional homologue of human seipin, regulates the size of lipid droplets in yeast. Journal of Cell Biology. 2008;180:473–482. doi: 10.1083/jcb.200711136. [DOI] [PMC free article] [PubMed] [Google Scholar]
- 59.Fei W., Shui G., Zhang Y., Krahmer N., Ferguson C., Kapterian T.S. A role for phosphatidic acid in the formation of “supersized” lipid droplets. PLOS Genetics. 2011;7:e1002201. doi: 10.1371/journal.pgen.1002201. [DOI] [PMC free article] [PubMed] [Google Scholar]
- 60.Talukder M.M.U., Sim M.F.M., O'Rahilly S., Edwardson J.M., Rochford J.J. Seipin oligomers can interact directly with AGPAT2 and lipin 1, physically scaffolding critical regulators of adipogenesis. Molecular Metabolism. 2015;4:199–209. doi: 10.1016/j.molmet.2014.12.013. [DOI] [PMC free article] [PubMed] [Google Scholar]
- 61.Zhang P., Verity M.A., Reue K. Lipin-1 regulates autophagy clearance and intersects with statin drug effects in skeletal muscle. Cell Metabolism. 2014;20:267–279. doi: 10.1016/j.cmet.2014.05.003. [DOI] [PMC free article] [PubMed] [Google Scholar]
- 62.Huang H., Frohman M.A. Lipid signaling on the mitochondrial surface. Biochimica et Biophysica Acta. 2009;1791:839–844. doi: 10.1016/j.bbalip.2009.05.012. [DOI] [PMC free article] [PubMed] [Google Scholar]
- 63.Foster D.A., Salloum D., Menon D., Frias M.A. Phospholipase D and the maintenance of phosphatidic acid levels for regulation of mammalian target of rapamycin (mTOR) Journal of Biological Chemistry. 2014;289:22583–22588. doi: 10.1074/jbc.R114.566091. [DOI] [PMC free article] [PubMed] [Google Scholar]
- 64.Choi S.Y., Huang P., Jenkins G.M., Chan D.C., Schiller J., Frohman M.A. A common lipid links Mfn-mediated mitochondrial fusion and SNARE-regulated exocytosis. Nature Cell Biology. 2006;8:1255–1262. doi: 10.1038/ncb1487. [DOI] [PubMed] [Google Scholar]
- 65.Cai J., Abramovici H., Gee S.H., Topham M.K. Diacylglycerol kinases as sources of phosphatidic acid. Biochimica et Biophysica Acta. 2009;1791:942–948. doi: 10.1016/j.bbalip.2009.02.010. [DOI] [PMC free article] [PubMed] [Google Scholar]
- 66.Yamashita A., Hayashi Y., Matsumoto N., Nemoto-Sasaki Y., Oka S., Tanikawa T. Glycerophosphate/Acylglycerophosphate acyltransferases. Biology (Basel) 2014;3:801–830. doi: 10.3390/biology3040801. [DOI] [PMC free article] [PubMed] [Google Scholar]
- 67.Shindou H., Hishikawa D., Harayama T., Yuki K., Shimizu T. Recent progress on acyl CoA: lysophospholipid acyltransferase research. Journal of Lipid Research. 2009;(Suppl. 50):S46–S51. doi: 10.1194/jlr.R800035-JLR200. [DOI] [PMC free article] [PubMed] [Google Scholar]
- 68.Sankella S., Garg A., Horton J.D., Agarwal A.K. Hepatic gluconeogenesis is enhanced by phosphatidic acid which remains uninhibited by insulin in lipodystrophic Agpat2-/- mice. Journal of Biological Chemistry. 2014;289:4762–4777. doi: 10.1074/jbc.M113.530998. [Epub 2014 Jan 14]. PMID: 24425876. [DOI] [PMC free article] [PubMed] [Google Scholar]
Associated Data
This section collects any data citations, data availability statements, or supplementary materials included in this article.