

Abstract
Aims: Polyphenolic phytochemicals have anticancer properties. However, in mechanistic studies, lack of correlation with the bioavailable concentrations is a critical issue. Some reports had suggested that these molecules downregulate the stress response, which may affect growth and the antioxidant protection of malignant cells. Initially, we studied this potential underlying mechanism using different human melanomas (with genetic backgrounds correlating with most melanomas), growing in nude mice as xenografts, and pterostilbene (Pter, a natural dimethoxylated analog of resveratrol). Results: Intravenous administration of Pter decreased human melanoma growth in vivo. However, Pter, at levels measured within the tumors, did not affect melanoma growth in vitro. Pter inhibited pituitary production of the adrenocorticotropin hormone (ACTH), decreased plasma levels of corticosterone, and thereby downregulated the glucocorticoid receptor- and nuclear factor (erythroid-derived 2)-like 2 (Nrf2)-dependent antioxidant defense system in growing melanomas. Exogenous corticosterone or genetically induced Nrf2 overexpression in melanoma cells prevented the inhibition of tumor growth and decreased antioxidant defenses in these malignant cells. These effects and mechanisms were also found in mice bearing different human pancreatic cancers. Glutathione depletion (selected as an antimelanoma strategy) facilitated the complete elimination by chemotherapy of melanoma cells isolated from mice treated with Pter. Innovation: Although bioavailability-related limitations may preclude direct anticancer effects in vivo, natural polyphenols may also interfere with the growth and defense of cancer cells by downregulating the pituitary gland-dependent ACTH synthesis. Conclusions: Pter downregulates glucocorticoid production, thus decreasing the glucocorticoid receptor and Nrf2-dependent signaling/transcription and the antioxidant protection of melanoma and pancreatic cancer cells. Antioxid. Redox Signal. 24, 974–990.
Introduction
Phytochemicals of polyphenolic structure, commonly named natural polyphenols (PFs), are secondary metabolites of plants involved in the defense against different types of stresses, including ultraviolet radiation, aggression by pathogens, low soil fertility, high/low temperatures, severe drought, and grazing pressure (58). Their potential benefits for human health are numerous and include anticancer properties (5). Abundant information is available on mechanisms by which PFs may interfere with carcinogenesis, tumor growth, and dissemination (5, 27, 38). However, a main problem with PFs is their short half-life and low bioavailability under in vivo conditions (4, 5, 38). Indeed, the main discrepancy between health claims and clinical observations is the frequent use of nonphysiologically relevant concentrations of these compounds in mechanistic studies (5, 39). This discrepancy represents a fundamental question that remains unsolved.
Innovation.
Anticancer effects elicited by polyphenols and correlation with their bioavailability remain unclear. Pterostilbene (Pter) (administered i.v.) decreases human melanoma and pancreatic cancer growth (50–70%, xenografts) in vivo (not in vitro) and weakens its antioxidant defense. This report demonstrates a novel systemic link between Pter-induced inhibition of pituitary adrenocorticotropin hormone production, lower levels of circulating glucocorticoids, and the downregulation of glucocorticoid receptor- and nuclear factor (erythroid-derived 2)-like 2 (Nrf2)-dependent cancer antioxidant defense system, thus facilitating identification of molecular targets to sensitize aggressive cancers to oncotherapy.
Different PFs have been shown to inhibit cancer growth in vivo (5, 41, 61). Nevertheless, it is unclear how potential underlying mechanisms can be correlated with bioavailable concentrations and biological half-life. In the present report, we have addressed this question using different human melanomas and pancreatic cancers, growing in mice as xenografts, and pterostilbene (trans-3,5-dimethoxy-4′-hydroxystilbene; Pter), a natural dimethoxylated analog of resveratrol, but with higher biological half-life (23). Our results indicate that Pter-induced melanoma or pancreatic cancer growth inhibition involves an indirect mechanism where physiological glucocorticoids play a key role.
Results
Effect of Pter on melanoma growth
Three different human melanoma cell lines [see Supplementary Table S1 for their genetic background; Supplementary Data are available online at www.liebertpub.com/ars) and ref. (62)] were used to investigate the effect of Pter. As shown in Figure 1A, i.v. administration of 30 mg Pter/kg (every 48 h) caused a significant inhibition of tumor growth (∼70% in A2058 on day 35, 65% in Mewo on day 42, and 49% in MelJuso melanoma-bearing mice on day 42) compared with controls. Remarkably, the rate of control growth also differs among the models (Fig. 1A). At a lower dose (20 mg/kg), Pter was less effective, whereas a higher dose (40 mg/kg) caused no further inhibition (Fig. 1A).
FIG. 1.

In vivo and in vitro effect of Pter on human melanoma growth and its relationship with bioavailable Pter concentrations. (A) Effect of Pter on melanoma growth in vivo. Pter was administered i.v. every 48 h for a period of 5 weeks, starting 1 week after tumor cell inoculation. (B) Plasma versus tumor levels of Pter after its i.v. administration (30 mg/kg). (C) Effect of Pter on melanoma cell growth and viability in vitro (15 μM × 60 min every 24 h starting 24 h after seeding). (D) Effect of Pter on the rates of tumor cell proliferation and apoptotic death in vivo. For each experimental condition, a representative picture is shown: immunohistochemical detection of melanoma cells using HMB45 monoclonal antibodies, cell proliferation detection using anti-Ki-67 monoclonal antibodies, and TUNEL staining showing melanoma cells with apoptotic nuclei. Proliferation and apoptotic indexes (expressed as % of Ki-67- and TUNEL-positive cells relative to controls, respectively) were calculated using ten 10 × 10-mm2 sections per tumor and randomly selecting four different areas per section. At the doses assayed no deaths were observed in controls or the Pter-treated mice. All data are mean values ± SD of 9–10 different animals or experiments. *Significantly different p < 0.01, comparing Pter-treated mice versus controls. Pter, pterostilbene. To see this illustration in color, the reader is referred to the web version of this article at www.liebertpub.com/ars
To correlate tumor growth inhibition and bioavailable Pter concentrations, we investigated Pter levels in plasma and in the tumor. As shown in Figure 1B, after i.v. administration of 30 mg Pter/kg, its highest concentration in plasma (112 ± 17, 116 ± 23, and 98 ± 13 μM in A2058, MeWo, and MelJuso melanoma-bearing mice, respectively, 5 min after administration) decreased rapidly to reach the lowest concentration (∼1 μM) at 240–480 min. After that last time point, Pter levels in plasma were undetectable (not shown). Pter levels in tumors were measured in parallel and also reached the highest concentration (28 ± 7, 33 ± 7, and 25 ± 7 μM in A2058, MeWo, and MelJuso melanoma-bearing mice, respectively) 5 min after administration, whereas the lowest concentration (∼1 μM) was measured at 180 min. From the data in Figure 1B, we calculated a half-life of Pter in circulating plasma of melanoma-bearing mice of 70–73 min (not significantly different from that calculated in nontumor-bearing mice where the same dose of Pter was administered i.v., not shown) and of 36–40 min in the melanoma tumors.
Measurement of the main Pter metabolites in plasma (Supplementary Fig. S1) confirmed previous observations (7), which showed that pterostilbene-4′-sulfate (Pter-S) is the main Pter-derived metabolite generated under in vivo conditions.
Based on the Pter levels measured in the tumors (Fig. 1B), our next step was to assay the effect of this stilbene on melanoma cell proliferation and viability under in vitro conditions. To mimic in vivo conditions, we incubated melanoma cells in the presence of Pter (15 μM) for a limited period (60 min) (this represents an approximate mean value of the Pter concentration measured within the tumor during the first hour after i.v. administration of 30 mg Pter/kg) (Fig. 1C). Pter was added to the incubation medium every 24 h and, as indicated, was present only for 60 min. After addition to the culture medium, Pter levels remained unchanged during the incubation time (not shown), which suggests that human melanoma cells do not metabolize Pter. As shown in Figure 1C, neither tumor cell proliferation nor viability was significantly affected by Pter (similar results were found using Pter-S and Pter-glucuronide [Pter-G, Supplementary Table S2]).
However, it is possible that even very low concentrations, as suggested for other PFs (54), are effective in vitro. Thus, we incubated the three melanoma cell lines used for 72 h in the presence of 1–5 μM Pter (approximate mean Pter levels found in plasma of tumor-bearing mice in the 120–180 min period after its i.v. administration, Fig. 1B). Since melanoma cells do not metabolize the stilbene, its levels remained constant through the incubation period. However, under in vitro conditions, melanoma cell growth and viability were not altered in the presence of the low concentrations of Pter (compared with controls—which were not significantly different from the data displayed in Fig. 1B) (not shown).
However, histopathological studies of tumors, obtained from melanoma-bearing mice treated with Pter (as in Fig. 1B), revealed that Pter administration causes a decrease in melanoma cell proliferation (Ki-67 staining) and an increase in apoptotic cell death (TUNEL) (Fig. 1D). Previously, we observed (22) that short-term exposure (60 min/day) to Pter (40 μM) and quercetin (Quer) (20 μM) (approximate mean values of the plasma concentrations measured within the first hour after i.v. administration of 20 mg of each polyphenol/kg) downregulated inducible nitric oxide synthase (iNOS) in murine B16-F10 melanoma cells and upregulated endothelial nitric oxide synthase (eNOS) in the vascular endothelium. Pter and Quer induced an NO shortage-dependent decrease in CREB phosphorylation, a positive regulator of bcl-2 expression, in the B16-F10 cells, thereby facilitating endothelium-induced tumor cytotoxicity (22).
As shown in Supplementary Figure S2, in our present experimental conditions, Pter treatment downregulated iNOS expression and activity in the melanoma cells growing in vivo (no significant effect compared with controls was observed on eNOS in isolated endothelial cells). Therefore, it is plausible that the NO shortage-dependent mechanism indicated above also contributes to the increased rate of apoptotic death (Fig. 1D).
Our results suggest that Pter-induced inhibition of melanoma growth, under in vivo conditions, must involve other factor(s) and may not be the consequence of a direct antitumor effect elicited by Pter. In this regard, some primary observations suggested a possible relationship between PFs and the hypothalamic–pituitary–adrenal (HPA)-dependent stress response (1, 55, 59, 73).
Effect of Pter on stress hormones in melanoma-bearing mice
Stress-related responses in rodents under stressful conditions can be evaluated by measuring plasma levels of corticosterone and noradrenaline (NORA) (main circulating glucocorticoid and catecholamine, respectively) (67).
As shown in Figure 2A, corticosterone levels in plasma of control nontumor-bearing mice peak at 12 h, just before the beginning of the dark active phase in mice. However, in melanoma-bearing mice, corticosterone levels were higher than in controls and remained rather constant through the 24-h period (Fig. 2A). Treatment with Pter (30 mg/kg every 48 h, as in Fig. 1A) induced a decrease of corticosterone in plasma of melanoma-bearing mice to practically control values (Fig. 2A). Adrenocorticotropin hormone (ACTH) levels also followed a circadian pattern in control nontumor-bearing mice (ACTH was higher before corticosterone levels peaked, and lower during the dark active phase) (Fig. 2B). ACTH levels were also higher in melanoma-bearing mice than in controls and were also decreased by Pter treatment (Fig. 2B) [Pter can cross the blood–brain barrier (7, 23)].
FIG. 2.

Effect of Pter treatment on corticosterone, ACTH, and NORA levels, and CRH expression in melanoma-bearing mice. Corticosterone (A), ACTH (B), and NORA (D) levels in circulating plasma, and CRH expression (C) in the hypothalamic PVN (optical density arbitrary units, a.u.) were measured as indicated under the Materials and Methods section. Blood was collected from the tail vein during a 24-h period (tumors were allowed to grow for 35 days; see Fig. 1). All groups were treated as in Figure 1. Data are mean values ± SD of seven to eight different animals. *Significantly different p < 0.01, comparing melanoma-bearing mice (untreated or treated with Pter) versus nontumor-bearing mice; +Significantly different p < 0.01, comparing both melanoma-bearing mice groups. Data obtained from melanoma-bearing mice treated with vehicle were not significantly different from those calculated for the untreated group (not shown). ACTH, adrenocorticotropin hormone; CRH, corticotropin-releasing hormone; NORA, noradrenaline; PVN, paraventricular nucleus. To see this illustration in color, the reader is referred to the web version of this article at www.liebertpub.com/ars
Therefore, changes in plasma corticosterone levels follow those of ACTH, which stimulates synthesis and release of glucocorticoids from the adrenal glands (21). However, corticotropin-releasing hormone (CRH) mRNA expression in the hypothalamic paraventricular nucleus (PVN) was lower in melanoma-bearing mice (Fig. 2C) [in agreement with a similar finding in mice bearing highly metastatic B16-F10 melanoma (67)].
This apparent biological paradox (a decrease in CRH associated with an increase in ACTH) can be explained, for example, by direct activation of pituitary ACTH production by melanoma-released interleukin (IL)-6 (67). Pter treatment caused a further decrease in CRH expression, which was statistically significant in MeWo- and MelJuso-bearing mice (Fig. 2C). A fact in agreement with recent reports showing that hesperidin (a polyphenolic flavanone glycoside) or Quer (a polyphenolic flavonol) also decrease mRNA CRH expression in rat models of chronic (12) or acute stress (36), respectively. Hence, since CRH expression is lower in melanoma-bearing mice than in nontumor-bearing mice, whereas ACTH increases, the Pter-induced decrease in corticosterone generation appears probably due to Pter-induced inhibition of pituitary ACTH production.
NORA in plasma was also higher in melanoma-bearing mice than in control nontumor-bearing mice (Fig. 2D). However, NORA levels were not significantly different when melanoma-bearing mice, treated or not treated with Pter, were compared (Fig. 2D).
Pter inhibits ACTH production in AtT-20 cells
To assay if Pter affects ACTH production, we used, as a model AtT-20, an ACTH-secreting cell line cloned from cultures established after alternate passage of mouse pituitary tumor cells as tumors in animals and in cell culture (www.lgcstandards-atcc.org). As shown in Figure 3A, Pter levels in mouse whole brain peak 5 min after its i.v. administration (30 mg/kg), and then rapidly decrease to ∼1 nmol/g at 60 min and to nondetectable levels at 120 min. To assay if these levels may reflect pharmacokinetics within the pituitary gland, we used a parapharyngeal approach, modified by Hoff et al. (32) from previously published surgical techniques, to rapidly perform hypophysectomy in Pter-treated mice. As shown in Figure 3A, Pter levels in the hypophysis follow a similar pattern compared with the whole brain, but were found to be significantly higher. Hypothetically, this may reflect the fact that the pituitary gland is the most irrigated region of the body (blood flow: 0.8 ml/g × min) (10).
FIG. 3.
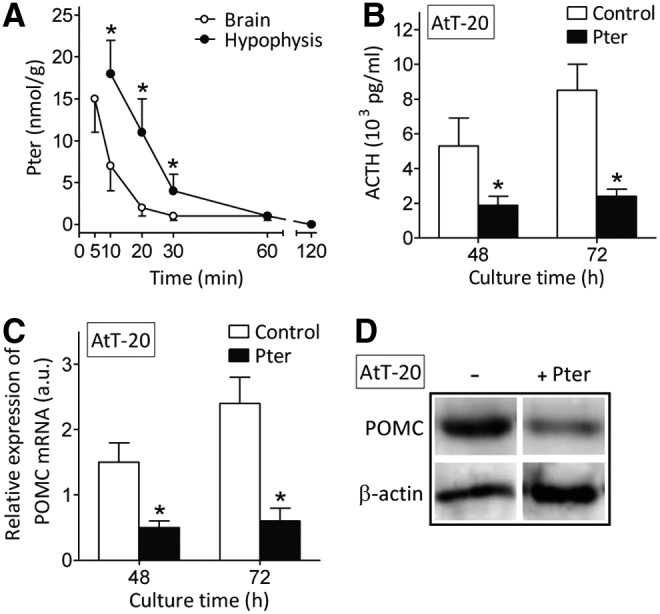
Pter bioavailability in brain and the pituitary gland and its effect on ACTH synthesis and POMC expression in AtT-20 cells. (A) Whole brain and pituitary gland levels of Pter after its i.v. administration (30 mg/kg) (n = 6–7 mice; *Significantly different p < 0.01, comparing hypophysis vs. whole brain levels). Data in (A) correspond to tissues obtained from nontumor-bearing mice (results obtained in A2058 or MeWo melanoma-bearing mice were not significantly different, not shown). (B) Effect of Pter on ACTH production by AtT-20 cells in a 24 h-period (measured between 24 and 48 h or between 48 and 72 h). (C) Effect of Pter on POMC expression and (D) POMC protein levels (72 h of culture time) in AtT-20 cells (n = 6 for B, C, and D; *Significantly different p < 0.01, comparing +Pter vs. controls). For the in vitro experiments (B, C, and D), Pter (15 μM, see under the Results section) and CRH (100 nM) were added at time 0 and every 24 h through the culture time and were present, after each addition, for only 30 min. After the 30-min period, culture flasks were washed out (thrice with PBS) and the medium was renewed (controls received identical treatment). POMC, proopiomelanocortin.
The effect of Pter on ACTH production was measured in cultured AtT-20 cells. As shown in Figure 3B, Pter (15 μM, an ∼mean value of the Pter levels measured in the hypophysis 10–30 min after i.v. administration of 30 mg/kg, see the caption) decreases ACTH production.
Proopiomelanocortin (POMC) is a common precursor of melanocortin-related peptides in the pituitary. ACTH is produced in pituitary corticotrophs when POMC is cleaved to β-lipotropic hormone and ACTH by the prohormone, convertase-1/3 processing enzyme (26). Pter also decreased POMC expression and levels in AtT-20 cultured cells (Fig. 3C, D), thus further indicating that Pter suppresses ACTH synthesis and secretion in corticotroph cells, as suggested by the data displayed in Figure 2. None of the main Pter conjugates (Pter-S and Pter-G; incubated as in Supplementary Table S2) decreased ACTH production in AtT-20 cells (not shown), thus indicating that the natural structure, and not its in vivo generated metabolites, is responsible for inhibiting ACTH production.
Exogenous administration of corticosterone antagonizes the effect of Pter on melanoma growth
Human melanoma cells express high-affinity glucocorticoid receptors (GRs) (16). As shown in Table 1, treatment with Pter reduced circulating corticosterone levels and melanoma growth in all models assayed, but without affecting the number of GRs. However, Pter was unable to significantly affect in vivo melanoma growth if mice received at the same time a constant i.v. infusion of exogenous corticosterone (which resets its pathophysiological levels in melanoma-bearing mice) (Table 1). Therefore, since Pter does not directly affect melanoma growth under in vitro conditions (Fig. 1C), our results suggest that Pter-induced inhibition of melanoma growth indirectly requires glucocorticoids and, consequently, GR-derived intracellular signaling.
Table 1.
GR Number in Growing Melanoma Cells in Mice Treated With Pter and/or CRC
| A2058 | MeWo | MelJuso | |||||||
|---|---|---|---|---|---|---|---|---|---|
| Treatment | Tumor vol. (mm3) | 103 GR/cell | CRC (ng/ml plasma) | Tumor vol. (mm3) | 103 GR/cell | CRC (ng/ml plasma) | Tumor vol. (mm3) | 103 GR/cell | CRC (ng/ml plasma) |
| None | 1049 ± 267 | 73 ± 6 | 247 ± 36 | 507 ± 166 | 52 ± 4 | 195 ± 35 | 286 ± 69 | 55 ± 5 | 179 ± 37 |
| Pter | 258 ± 66* | 71 ± 5 | 123 ± 29* | 167 ± 53* | 45 ± 6 | 87 ± 17* | 145 ± 35* | 47 ± 4 | 80 ± 15* |
| CRC | 857 ± 185 | 80 ± 7 | 205 ± 48 | 426 ± 116 | 49 ± 7 | 177 ± 29 | 240 ± 94 | 46 ± 6 | 164 ± 41 |
| Pter+CRC | 906 ± 214 | 72 ± 5 | 196 ± 37 | 451 ± 159 | 50 ± 5 | 186 ± 35 | 229 ± 77 | 51 ± 5 | 175 ± 35 |
Melanoma cells stably expressing the red fluorescence protein (RFP) were inoculated, as in Figure 1, and allowed to grow for 35 days. Treatment with Pter (as in Fig. 1) and/or costicosterone (using ALZET minipumps [ALZET Osmotic Pumps] and jugular vein catheterism [following manufacturer's instructions]; the mean rate of infusion was 0.3 μg of CRC/h) started 1 week after tumor inoculation. Treatment of tumor-bearing mice with vehicles (DMSO-ethanol for Pter as indicated under the Materials and Methods section; or polyethylene glycol 400 for CRC) did not significantly affect the rate of melanoma growth compared with controls (not shown). The number of GRs (expressed as binding sites/cell) was not significantly different when 72 h cultured A2058-RFP, MeWo-RFP, or MelJuso-RFP cells were compared with their wild-type A2058, MeWo, or MelJuso cell counterparts (not shown). Data for GR number, tumor volume (Tumor vol.), and CRC (blood samples were obtained at 12 h circadian time, Fig. 2) displayed in this table were obtained 35 days after tumor inoculation. All tumors had 50–70 mm3 of volume on day 7 after inoculation. GR number on day 7 was not significantly different from GR number on day 35 (not shown). Data are mean values ± SD of six to seven different animals.
Significantly different p < 0.01, comparing all groups versus controls (untreated). Data obtained in melanoma-bearing mice treated with vehicle were not significantly different from those calculated for the untreated group (not shown).
CRC, corticosterone; GR, glucocorticoid receptor; Pter, pterostilbene.
Effect of Pter treatment on the Nrf2-dependent antioxidant system in growing melanomas
However, Pter treatment decreases circulating corticosterone (Fig. 2A) without affecting the number of GRs in melanoma cells (Table 1). Therefore, it is uncertain whether Pter treatment may also affect the Nrf2 [nuclear factor (erythroid-derived 2)-like 2]-dependent battery of antioxidant and xenobiotic-metabolizing enzymes. Compared with cultured HEMa-LP human melanocytes, expression of practically all checked Nrf2-dependent enzymes, excepting a decrease in catalase (CAT), increases in A2058, MeWo, and MelJuso melanoma cells growing in vivo (Fig. 4A), thus suggesting that cancer cells, compared with their normal counterparts, tend to reinforce their antioxidant defenses. However, Pter treatment causes a decrease in the expression of all Nrf2-dependent enzymes tested, with some exceptions, that is, γ-glutamyl transpeptidase 1 (GGT1) and NADPH oxidase 1 (NOX1) (Fig. 4B).
FIG. 4.

Effect of Pter treatment on nuclear Nrf2 and its transcription activity in melanoma-bearing mice. (A) Expression of different Nrf2-dependent genes in A2058-RFP, MeWo-RFP, and MelJuso-RFP cells, isolated by laser microdissection (as indicated under the Materials and Methods section) from in vivo growing tumors 35 days after tumor inoculation, was compared versus 48 h cultured HEMa-LP cells (*Significantly different p < 0.05). (B) Expression of the same genes was compared in in vivo growing A2058-RFP, MeWo-RFP, and MelJuso-RFP cells treated and untreated with Pter (as in Fig. 1A) (*Significantly different p < 0.05). All data for (A) and (B), expressing fold change (quantitative RT-PCR, see under the Materials and Methods section for calculations), show mean values ± SD for five to six different experiments. No significant differences in expression of the genes displayed were found when control A2058, MeWo, and MelJuso cells and their RFP counterparts were compared under in vitro conditions (not shown). (C) Nuclear accumulation of Nrf2 from in vivo growing A2058-RFP, MeWo-RFP, and MelJuso-RFP cells was measured by Western blotting (no significant differences were found when these data were compared with those found in control A2058, MeWo, and MelJuso cells, not shown) (mean values ± SD for five different experiments, *Significantly different p < 0.01, comparing Pter treatment vs. controls). (D) Effect of Nrf2 overexpression (see under the Materials and Methods section) on the tumor growth of control and Pter-treated (as in Fig. 1A) A2058-bearing mice. Results obtained in these cells transfected with lentiviral vector not harboring any gene (negative control) were not different from control values (not shown). Data are mean values ± SD from six to seven different experiments (*Significantly different p < 0.01, comparing Pter treatment vs. controls; no significant differences were found when A2058/Tet-Nrf2 cells, ± Pter treatment, were compared with control A2058 untreated cells). Nrf2, nuclear factor (erythroid-derived 2)-like 2. To see this illustration in color, the reader is referred to the web version of this article at www.liebertpub.com/ars
The Pter-induced decrease in melanoma antioxidant defense was confirmed by measuring many different GSH (glutathione, γ-L-glutamyl-L-cysteinyl-glycine)-, reactive oxygen species (ROS)-, and cellular redox state-related enzyme activities and metabolites (Table 2 and Supplementary Fig. S3). Pter induction also associated with an increase of isoprostanes (a molecular marker of oxidative stress) in the cancer cells (Supplementary Fig. S4). As shown in Figure 4C, and compared with control melanoma-bearing mice, these effects associate with a decrease in nuclear Nfr2 in melanoma cells from in vivo Pter-treated mice. As shown in Supplementary Figure S5, and compared with controls, a decrease in nuclear Nrf2 associated with an increase in Keap1 [a negative regulator of Nrf2 signaling (63)] in tumors from Pter-treated mice, a fact that may reflect Pter-induced upregulation of Keap1 expression and/or a decrease in its (proteasome-independent) degradation. Moreover, melanoma cells engineered to overexpress Nrf2 were able to grow in vivo as controls, despite treatment with Pter (Fig. 4D).
Table 2.
Effect of Pter Treatment on Different Nrf2- and Redox State-Related Enzyme Activities and Metabolites in Melanoma Cells Growing In Vivo
| A2058 | MeWo | MelJuso | ||||
|---|---|---|---|---|---|---|
| − | + Pter | − | + Pter | − | + Pter | |
| GSH and TXN | ||||||
| GCL (mU/106 cells) | 133 ± 25 | 58 ± 17† | 77 ± 19 | 35 ± 12† | 112 ± 31 | 49 ± 12† |
| GSS (mU/106 cells) | 16.3 ± 4.7 | 8.5 ± 2.0* | 12.4 ± 3.6 | 7.4 ± 1.6* | 13.6 ± 2.4 | 7.8 ± 1.5† |
| GPX (mU/106 cells) | 6.1 ± 2.2 | 3.9 ± 1.1 | 4.6 ± 2.0 | 2.8 ± 1.0 | 5.3 ± 1.7 | 2.1 ± 0.5† |
| GSR (mU/106 cells) | 10.0 ± 3.0 | 6.1 ± 1.6 | 8.5 ± 1.7 | 4.9 ± 1.2* | 9.0 ± 3.0 | 5.1 ± 1.0† |
| GST (mU/106 cells) | 15.1 ± 2.8 | 7.5 ± 1.3† | 10.3 ± 2.2 | 6.5 ± 1.3* | 7.8 ± 1.5 | 4.7 ± 1.3* |
| GGT (mU/106 cells) | 20.5 ± 4.5 | 19.6 ± 2.7 | 15.3 ± 3.7 | 16.0 ± 2.4 | 17.5 ± 3.4 | 15.9 ± 3.5 |
| GSH (nmol/106 cells) | 22.4 ± 3.9 | 10.5 ± 2.1† | 12.3 ± 2.9 | 7.3 ± 1.7† | 19.6 ± 3.7 | 10.8 ± 2.9† |
| GSSG (nmol/106 cells) | 0.3 ± 0.1 | 0.3 ± 0.1 | 0.1 ± 0.05 | 0.1 ± 0.03 | 0.1 ± 0.03 | 0.1 ± 0.04 |
| TXN (μg/106 cells) | 1.0 ± 0.3 | 0.5 ± 0.1* | 1.4 ± 0.4 | 0.8 ± 0.2* | 0.9 ± 0.2 | 0.3 ± 0.1† |
| TXNRD (U/106 cells) | 1.3 ± 0.3 | 0.7 ± 0.2* | 1.6 ± 0.3 | 0.9 ± 0.2† | 1.2 ± 0.3 | 0.6 ± 0.1† |
| ROS | ||||||
| SOD1 (U/106 cells) | 1.5 ± 0.5 | 0.6 ± 0.2† | 1.1 ± 0.3 | 0.5 ± 0.2* | 0.8 ± 0.2 | 0.4 ± 0.2* |
| SOD2 (U/106 cells) | 0.3 ± 0.1 | 0.1 ± 0.05† | 0.2 ± 0.1 | 0.1 ± 0.05 | 0.2 ± 0.05 | 0.1 ± 0.05* |
| CAT (mU/106 cells) | 3.8 ± 0.7 | 1.7 ± 0.3† | 2.7 ± 0.4 | 1.6 ± 0.4† | 3.9 ± 1.1 | 1.1 ± 0.3† |
| NOX (R.L.U./106 cells) | 162 ± 38 | 177 ± 4.5 | 146 ± 37 | 132 ± 25 | 155 ± 26 | 142 ± 37 |
| H2O2 (nmol/106 cells x min) | 1.2 ± 0.4 | 0.7 ± 0.2† | 1.5 ± 0.3 | 0.7 ± 0.2† | 1.6 ± 0.4 | 0.8 ± 0.2† |
| O2• − (ΔFL1, a.u.) | 2.4 ± 0.5 | 3.9 ± 0.6* | 2.9 ± 0.8 | 3.5 ± 0.7 | 3.2 ± 0.7 | 5.0 ± 1.3* |
| NADPH supplying dehydrogenases | ||||||
| G6PDH (mU/106 cells) | 660 ± 113 | 305 ± 78† | 437 ± 55 | 266 ± 39† | 512 ± 49 | 366 ± 63† |
| ME (mU/106 cells) | 76 ± 16 | 43 ± 12† | 44 ± 11 | 32 ± 11 | 38 ± 12 | 25 ± 7† |
| IDH (U/106 cells) | 2.2 ± 0.5 | 1.2 ± 0.4* | 2.4 ± 0.4 | 1.5 ± 0.4* | 2.6 ± 0.4 | 1.5 ± 0.4† |
| Redox state | ||||||
| NADPH (nmol/mg prot) | 0.14 ± 0.2 | 0.06 ± 0.02† | 0.12 ± 0.06 | 0.05 ± 0.002* | 0.11 ± 0.3 | 0.05 ± 0.02† |
| NADP+ (nmol/mg prot) | 0.01 ± 0.005 | 0.05 ± 0.01† | 0.01 ± 0.005 | 0.04 ± 0.01† | 0.005 ± 0.001 | 0.03 ± 0.01 |
| GSH/GSSG | 75 ± 6 | 35 ± 5† | 123 ± 11 | 73 ± 11† | 196 ± 21 | 108 ± 17† |
| NADPH/NADP+ | 14.1 ± 2.1 | 1.2 ± 0.3† | 12.0 ± 3.5 | 1.2 ± 0.2† | 22.0 ± 4.2 | 1.7 ± 0.3† |
Tumor-bearing mice were treated as in Figure 1A. All parameters (see under the Materials and Methods section) were measured in melanoma cells isolated from tumors 35 days after inoculation. Data are mean values ± SD for seven to eight different tumors per parameter and experimental condition.
Significantly different p < 0.05, †p < 0.01.
CAT, catalase; GCL, γ-glutamylcysteine ligase; GGT, γ-glutamyltranspeptidase; GSR, glutathione reductase; GSS, GSH synthase; NOX, NADPH oxidase; GPX, glutathione peroxidase; Nrf2, nuclear factor (erythroid-derived 2)-like 2; ROS, reactive oxygen species; SOD, superoxide dismutase.
These results are relevant for three main reasons: (i) Pter treatment decreases the Nrf2-dependent cancer cell antioxidant defense; (ii) as previously shown by, for example, Homma et al. (33) in human lung cancer, Nrf2 enhances cell proliferation and resistance to anticancer drugs; and (iii) Pter treatment may facilitate identification of potential key targets for melanoma therapy. This could be the case, for example, for GSH [the most prevalent nonprotein thiol in mammalian cells (20)] or superoxide dismutase (SOD) activities (active O2• − production and low SOD activity in cancer cells could render malignant cells highly dependent on SOD for survival) (34) (Fig. 4B and Table 2).
Melanoma cells from Pter-treated mice are highly sensitive to combined chemotherapy and Nrf2-related target therapy
GSH depletion only appears therapeutically effective when very low levels of this tripeptide can be achieved within the cancer cells (19). Experimentally, GSH can be rapidly depleted using diethylmaleate (DEM, an α,β-unsaturated carbonyl compound) (19). On the other hand, downregulation of SOD activities can be achieved using (i) the known SOD inhibitor, diethyldithiocarbamate, but it has antagonistic effects on apoptosis by triggering both cytochrome c release and caspase inhibition and has not been tried in vivo (17); or (ii) using antisense oligonucleotides.
We used the A2058 cell line bearing BRAFV600E [the most common mutation in melanoma (62)] under in vitro controlled conditions. As shown in Figure 5A, cultured A2058 cells, isolated from Pter-treated mice (30 mg/kg every 48 h for a period of 5 weeks, as in Fig. 1A), were completely eliminated by the combination of DEM-induced GSH depletion and paclitaxel protein-bound particles (PAC.PBP, 100 ng/ml [approximate mean values in human plasma obtained after administration of the standard i.v. dose of 260 mg/m2 regularly used in, for example, patients bearing a metastatic breast cancer] [www.cancer.gov]). It is important to remark (as indicated by the data in Figure 5A) that the combination of DEM and PAC.PBP (compared with the effect of each drug alone) shows synergy. PAC.PBP was selected as the best drug candidate against the A2058 melanoma (IC50 = 0.23 ± 0.04 μM [n = 5]) after screening most drugs currently used against melanoma (i.e., PAC, PAC.PBP, cisplatin, dacarbazine, vinblastine, vincristine, valproic acid, BCNU, methotrexate, arsenate, temozolomide, and daunorubicin [Supplementary Table S3]).
FIG. 5.

Chemosensitization effect of GSH depletion (A) or sod1-AS (B) in melanoma cells isolated from Pter-treated mice. Melanoma cells were cultured as in Figure 1C. PAC.PBP (100 ng/ml) was added to the culture flasks 24 h after seeding. DEM (0.1 mM) was added 6 h later, whereas sod1-AS (10 μM) were added 12 h after seeding [complexation with lipofectamine 2000 (Invitrogen) (44) was used to facilitate sod1-AS uptake by the cells]. Data are mean values ± SD for five to six different experiments (*p < 0.01, comparing all experimental conditions vs. controls). DEM, diethylmaleate; PAC.PBP, paclitaxel protein-bound particles; sod1-AS, antisense oligonucleotides anti-sod1. To see this illustration in color, the reader is referred to the web version of this article at www.liebertpub.com/ars
As shown in Figure 5B, the combination of antisense oligonucleotides anti-sod1 (sod1-AS) (which targets the main intracellular SOD activity, Table 2) and PAC.PBP was less effective. Incubation of A2058 cells, isolated from control (non-Pter-treated mice), with DEM and PAC.PBP or sod1-AS and PAC.PBP (as in Fig. 5A, B) only decreased the melanoma cell number to 51% ± 12% or 73% ± 7% of control values, respectively (n = 5 in both cases, p < 0.01).
This proof-of-concept assay suggests the pretreatment with Pter and GSH depletion as a potential chemosensitizing strategy against malignant melanoma.
Glucocorticoid- and Nrf2-dependent inhibition of human pancreatic growth by Pter
Is the action of Pter restricted to melanoma cells? To begin preliminary studies regarding this question, we selected pancreatic cancer, one of the most aggressive and lethal cancers, with 1- and 5-year relative survival rates for all stages combined of 25% and 6%, respectively (www.cancer.gov). Overexpression of GRs in human pancreatic cancer and in xenografts has been reported (8). However, the absence of further reports indicates that no particular attention has been paid to this issue. Our results in two different and highly aggressive human pancreatic carcinoma cell lines (AsPC-1 and BxPC-3), bearing the most common mutations in this type of cancer (KRAS, TP53 CDKN2A/p16, and SMAD4/DPC4) (15), show that (i) i.v. administration of Pter inhibits xenograft growth (Supplementary Fig. S6); (ii) i.v. administration of Pter into pancreatic cancer-bearing mice decreases blood levels of ACTH and corticosterone, whereas exogenously administered corticosterone prevents the antitumor effect of Pter (Supplementary Table S4); (iii) Pter decreases nuclear Nrf2 in pancreatic cancer cells under in vivo conditions (Supplementary Fig. S5); and (iv) Pter treatment downregulates different Nrf2- and redox state-related enzyme activities and metabolites in pancreatic cancer cells growing in vivo (Supplementary Table S5). From these additional sets of experiments, we can conclude that Pter effects are not restricted to melanoma.
Evaluation of therapy-induced systemic toxicity
Does i.v. administration of Pter show any toxicity that could preclude its use? Standard hematology, clinical chemistry, and urinalysis were evaluated in nontumor-bearing mice and in A2058- and AsPC-1-bearing mice treated with vehicle or Pter to evaluate potential side effects of the treatment regimen. As shown in the Supplementary Table S6, tumor growth-related side effects included anemia, neutropenia, low natural killer cell count, and an increase of several tissue damage-related enzyme activities in plasma, including aspartate aminotransferase, alanine aminotransferase, GGT, alkaline phosphatase, and lactate dehydrogenase (all commonly observed in cancer patients). Most of these deleterious effects were found partially or totally prevented in Pter-treated mice (Supplementary Table S6). Moreover, during the treatment period, none of the tumor-bearing mice died (either treated with vehicle or Pter).
Rates of glucose utilization by isolated hepatocytes and of glutamine and glucose by isolated lymphocytes were similar in tumor-bearing mice treated with Pter and in control nontumor-bearing mice (Supplementary Table S6), which suggest normal rates of utilization of main energy-supplying substrates. Moreover, GSH levels, cell volume, and rates of glucose and glutamine utilization were not significantly different when isolated hepatocytes or lymphocytes from Pter-treated tumor-bearing mice and control nontumor-bearing mice were compared (Supplementary Table S6), further indicating that these normal cells appear to preserve their physiological status. Moreover, when isolated hepatocytes from Pter-treated tumor-bearing mice and control nontumor-bearing mice were cultured, their rates of growth were also similar (not shown). The decrease of GSH content in hepatocytes and CD2+ lymphocytes isolated from tumor-bearing mice (compared with nontumor-bearing mice) is a known tumor growth-derived effect (20) (Supplementary Table S6). These results clearly suggest that i.v. administration of Pter, per se, causes no significant in vivo toxicity.
Discussion
In vivo administration of different PFs inhibits growth of several cancer types (5, 43, 58). Based on the assumption that their antitumor effects should involve a direct interaction with the cancer cells, most mechanistic studies have ignored the uncomfortable limitation associated with their low bioavailability (which imply time-limited and very low intratumoral concentrations) (5). The present results show that under in vivo conditions, the main anticancer effect elicited by Pter is indirect and depends on stress-related neuroendocrine signaling mechanisms.
Moreover, as shown by the additional set of experiments performed using two other PFs, curcumin (Curc) and (−)-epigallocatechin gallate (EGCG), this mechanism is not restricted to the use of Pter (see the Supplementary Results section, including Supplementary Figs. S7 and S8 and Supplementary Table S7).
Hypothetically, Pter could promote microenvironment (tissue specific?)-related and/or systemic antitumor mechanisms. Regarding the second option, it has been reported that chronic Curc administration (5 or 10 mg/kg, p.o.) reverses some effects linked to chronic stress such as an abnormal adrenal gland weight-to-body weight ratio and increased thickness of the adrenal cortex, as well as elevated serum corticosterone levels and reduced GR mRNA expression (73). Another report showed that EGCG can attenuate acute stress responses through the GABAergic system in the brain (1). Moreover, dietary Quer attenuates the HPA axis activation by suppression of the CRH mRNA expression (36). These primary observations are examples of particular interest since stress has been suggested as a promoter of tumor growth and angiogenesis in different in vivo models (55, 59). Thus, we decided to explore first possible links between Pter administration and the HPA-dependent stress response in different tumor-bearing mice.
Up to now, it has been assumed that whatever occurs under in vitro conditions can be reproduced in the whole organism by the oral administration of sufficiently large doses. As a recent example, it has been argued that sulfate metabolites can provide an intracellular pool for resveratrol generation and induce autophagy with senescence in human colon adenocarcinoma cells (54). However, the concentrations used in these in vitro experiments with colonic cells (e.g., 50–75 μM of the resveratrol monosulfate mixture incubated for days, hence without taking into account the time limitation associated with the actual bioavailability) were those extrapolated from peak plasma levels in healthy human volunteers receiving 2.5–5.0 g of resveratrol daily for 29 days. It was concluded that conjugates may act as a reservoir of the natural structure and that at doses considered (not proven) to be safe in humans, resveratrol generated via this route may be of greater importance than the unmetabolized form.
Nevertheless, a phase II clinical trial (www.clinicaltrials.gov) sponsored by GlaxoSmithKline to assess the safety and activity of SRT501 (a formulation of resveratrol claimed to increase its in vivo bioavailability) alone or in combination with bortezomib was terminated due to safety concerns after kidney damage (cast nephropathy) developed in some patients. In this trial, 5 g SRT501/day was administered orally for 20 consecutive days in a 21-day cycle for a maximum of 12 cycles. However, this resveratrol dose was much higher than that used in safety studies (5). In our study, melanoma growth inhibition is achieved by administering 30 mg of Pter/kg every 48 h into mice (human equivalent dose of ∼2.4 mg/kg or 170 mg for a human being of 70 kg according to FDA guidelines). Recently, data from the first clinical trial on Pter were released (www.clinicaltrials.gov). It was concluded that Pter reduced blood pressure in adults at an oral and safe dose of 125 mg given twice per day. The dose of 30 mg i.v. of Pter/kg per day, used in our studies, was previously found pharmacologically safe since it showed no organ-specific or systemic toxicity in mice (56).
Recent studies have tested, both in vitro and in vivo, the antitumor effect of Pter. However, the use in vitro of unattainable in vivo concentrations and/or long-term exposure (24 h or more) seriously questions the relative importance of the proposed mechanisms, for example, via metastases-associated protein 1 in prostate cancer (41), estrogen receptor-α36 (53), or the PI3K/Akt and MAPK signaling pathways in colon cancer (14). We observed that 20 μM Pter (which would be in the upper level of an in vivo achievable intratumoral level, Fig. 1B), incubated for 24 h under in vitro conditions, only decreased tumor cell viability by ∼30% in human A375 melanoma, 40% in A549 human lung cancer, 10% in HT-29 human colon cancer, and 25% in human breast cancer (46). However, no significant decrease in cell viability was observed if the incubation time was <6 h, thus questioning mechanisms claimed to explain the in vivo induced tumor growth inhibition elicited by Pter (or other related molecules), at least under conditions where Pter needs the blood circulation to reach the growing tumor.
Our group has pointed out the importance of stress-related signals in metastatic melanoma growth (51, 67). Glucocorticoids in particular are used at high doses in cancer therapy, in conjunction with other treatments, because they have proapoptotic properties in different cancer cells (60). Nevertheless, at the pathophysiological levels measured in plasma of tumor-bearing models, glucocorticoids show tumor-promoting activities (51, 70). For instance, results in animal models of human breast cancer suggest that glucocorticoids inhibit tumor cell apoptosis (70). Moreover, glucocorticoids may induce a yet undefined resistant phenotype, thereby facilitating fast growth and metastasis of different solid tumors (60). To explain this paradox, recently, we showed that GR knockdown decreases the antioxidant protection (i.e., Nrf2- and p53-dependent downregulation of γ-glutamylcysteine ligase [GCL] and GSH, SOD1 and 2, CAT, glutathione peroxidase [GPX], and glutathione reductase [GSR]) of highly metastatic B16-F10 melanoma cells, thus causing a drastic decrease (90%) in their survival upon interaction with endothelial cells in vitro and in vivo (51).
As shown here, Pter, by inhibiting ACTH production (Fig. 3B and Supplementary Table S4), caused a decrease in circulating corticosterone (Fig. 2A, Table 1 and Supplementary Table S4) and, thereby, downregulated the GR- and Nrf2-dependent antioxidant defense system in growing melanomas (Table 2) and pancreatic cancer (Supplementary Table S5). Exogenous administration of corticosterone (Table 1) or genetic manipulation to induced Nrf2 overexpression (Fig. 4D) in melanoma cells prevented these antitumor effects. Moreover, studies of expression/levels/activities of different Nrf-2-dependent molecules in melanoma and pancreatic cancer cells from Pter-treated mice (Fig. 4B, Table 2 and Supplementary Table S5) suggested potential therapeutic targets.
Since the mechanisms described in the present work have been studied in immunodeficient mice, we also explored if the Pter-induced effect on the antioxidant defenses of cancer cells could be also influenced by our immune system. As shown in the supplementary set of experiments (see the Supplementary Results section, including Supplementary Fig. S9 and Supplementary Table S8), the main findings in human melanomas can be also observed in immunocompetent mice bearing B16-F1 melanoma cells.
Mechanistically, Sirtuins (Sirt), enzymes with nicotinamide adenine dinucleotide (NAD)+-dependent deacetylase or mono-[ADP-ribosyl]transferase activity, particularly Sirt1 and Sirt2, play diverse parts in cancer by affecting the response to genomic instability and stress, regulating cancer-associated metabolism and ROS production, and modifying the tumor microenvironment (13, 71). Therefore, a Pter-induced reduction of ROS (Table 2) could be mediated through Sirt. Moreover, acetylation–deacetylation of Nrf2 regulates its transcriptional activity and nucleocytoplasmic localization, and it has been argued that Sirt1 may decrease acetylation of Nrf2 as well as Nrf2-dependent gene transcription (37). Thus, we measured Sirt1 and Sirt2 levels (both found in the nucleus and cytoplasm) using Western blot analysis and monoclonal antibodies. However, no significant differences were found when A2058 and AsPC-1 tumors from control and Pter-treated mice were compared. Measurements were performed 3 and 5 weeks after tumor inoculation (not shown). These results suggest a Sirt-independent Pter effect. Nevertheless, further work would be necessary to reach more conclusive evidences under in vivo conditions, for example, using knockout mice.
Production of large amounts of H2O2 by human tumor cells was already observed by Szatrowski and Nathan (64), who raised the hypothesis that increased ROS generation could contribute to the ability of cancers to mutate, injure local tissues, and promote tumor heterogeneity and metastases. In fact, control of oxidative stress to balance ROS levels and benefit of their signaling effects, promoting proliferation and survival, is essential for cancer cells (28). The fact that Pter downregulates the Nrf2-dependent antioxidant defenses of melanoma and pancreatic cancer cells may offer a therapeutic advantage. As shown in Figure 5A, combined Pter and GSH depletion treatment chemosensitizes melanoma cells and facilitates their complete elimination.
The relationship between GSH depletion, chemotherapy, and the radiation response has been examined in many tumor cells after treatment with different drugs, including buthionine sulfoximine (BSO), DEM, 2-oxothiazolidine-4-carboxylate, and different radiosensitizing agents. However, BSO is nonspecific and, besides promoting tumor GSH depletion in vivo, can cause irreversible damage in most normal tissues (52). The fact that Pter treatment decreases tumor GSH levels is an advantage. Starting from the previous Pter treatment-induced depletion, a further decrease in melanoma cell GSH levels could be approached in vivo from different angles, that is, (i) Bcl-2 antisense oligodeoxynucleotides and the calcium channel blocker, verapamil (52); (ii) acivicin, an irreversible GGT inhibitor (50); (iii) sulfasalazine, which inhibits the x(c)-cystine transporter (29); (iv) NOV-002, a formulation of disodium glutathione disulfide (30); (v) phenethyl isothiocyanate, which decreases GPX activity and GSH levels (66); (vi) an L-glutamine-enriched diet (9); (vii) RU-486, a GR antagonist (47); and (viii) anti-IL-6 therapy (melanoma-derived IL-6 activates GSH release from the liver, the main physiological GSH reservoir) (49). On the other hand, it is available as an antisense oligonucleotide designed to inhibit sod1 expression (ISIS 333611) and delivered intrathecally in SOD1 familial amyotrophic lateral sclerosis patients (https://clinicaltrials.gov).
These numerous options suggest a novel therapy against cancer. Besides, our results may help to explain (at least in part) the apparent lack of correlation between bioavailability and Pter (and likely other PFs)-induced anticancer activities. Moreover, Nrf2 and possible p-53 and/or c-Myc coregulation, as well as potential interactions between Nrf2 and other signaling pathways (e.g., NF-kB/AP-1), deserve further investigation.
Materials and Methods
Cell culture
Human A2058, MeWo, and MelJuso melanoma cells, pancreatic cancer (adenocarcinoma) ASPC-1 and BxPC-3, murine B16 melanoma F1, and mouse AtT-20 pituitary corticotroph tumor cells were from the American Type Culture Collection. Human HEMa-LP epidermal melanocytes were from Life Technologies. Cells were grown in DMEM (Invitrogen), pH 7.4, supplemented with 10% heat-inactivated fetal calf serum (FCS) (Biochrom KG), 100 U/ml penicillin, and 100 μg/ml streptomycin. Cells were plated (20,000 cells/cm2) and cultured at 37°C in a humidified atmosphere with 5% CO2. Cells were harvested by incubation for 5 min with 0.05% (w/v) trypsin (Sigma, St. Louis, MO) in phosphate-buffered saline (PBS), pH 7.4, containing 0.3 mM EDTA, followed by the addition of 10% FCS to inactivate the trypsin. Cell numbers were determined using a Coulter Counter (Coulter Electronic, Inc.). Cells were allowed to attach for 12 h before any treatment addition. Cellular viability was assessed as previously reported (44).
Animals, tumor growth, and in vivo administration of Pter
Female nu/nu nude mice (6–8 weeks; Charles River Laboratories) were fed ad libitum on a standard diet (Harlan Teklad Animal Diets & Bedding). Mice were kept on a 12-h light/12-h dark cycle at 22°C. Procedures were in compliance with international laws and policies (EEC Directive 86/609, OJ L 358. 1, December 12, 1987; and NIH Guide for the Care and Use of Laboratory Animals, NIH Publ. No. 85-23, 1985). For xenograft experiments, mice were inoculated s.c. with 10 × 106 cancer cells per mouse, except for the ASPC-1 and B16-F1 groups where, due to their very high growth rate, animals were inoculated with 3 × 10⁶ and 2 × 10⁶ cancer cells, respectively, per mouse.
Tumor volume was calculated (every 2 days after inoculation) based on two dimensions, measured using calipers, and expressed in mm3 according to V = 0.5a × b2 (a and b are the long and the short diameters, respectively). For histological analysis, samples were fixed in 4% formaldehyde, paraffin embedded, and stained as indicated below. For pharmacokinetic and treatment studies, Pter (Green Molecular S.L.) (dissolved in DMSO:ethanol [2:1], 50 mg Pter/ml) was administered i.v. through the jugular vein (where a permanent catheter was surgically fixed).
Determination of Pter and its metabolites by high-pressure liquid chromatography and mass spectrometry
Liquid chromatography and mass spectrometry (LC-MS/MS) was performed, as previously described (7, 23), using a TSQ Vantage™ Triple Quadrupole Mass Spectrometer (Thermo Scientific) equipped with a Shimadzu LC-10ADvp. pump and an SLC-10Avp. controller system with an SIL-10ADvp. autoinjector.
Immunohistochemistry
Monoclonal mouse anti-human HMB45antibodies (Abcam) were used for immunohistochemical detection of melanoma cells. Tumors were fixed and paraffin embedded as described above. Immunohistochemical analysis was applied to tissue slices (5 μm thick) following the methodology recommended by Abcam. A horseradish peroxidase-conjugated goat anti-mouse polyclonal (Abcam) was used as secondary antibody.
Monoclonal mouse anti-human Ki-67 (Dako) was used for immunohistochemical detection of the tumor-growing fraction. Immunohistochemical analysis was applied to tissue slices (5 μm thick) following Dako's methodology. A biotin-conjugated goat anti-rabbit polyclonal (Dako) was used as secondary antibody.
DNA strand breaks in apoptotic cells were assayed using a TUNEL labeling assay (Boehringer), fluorescence microscopy, and manufacturer's methodology.
Measurement of NOS activity in tumor and endothelial cells
The assay, based on the conversion of L-arginine to L-citrulline, was carried out by adding 100 μg of sample protein to 150 μl of assay buffer (50 mM HEPES, 1 mM dithiothreitol, 1 mM MgCl2, 5 mg/L pepstatin A, 0.1 mM phenylmethylsulfonyl fluoride, and 3 mg/L aprotinin, pH 7.4) containing 70 μM arginine, 250,000 dpm L-[3H]arginine, (GE Healthcare), 2 mM NADPH, 5 μM tetrahydrobiopterin, 5 μM FAD, and 0.5 mM CaCl2 to measure total NOS activity or in the presence of 1 mM EGTA (without calcium) to determine Ca2+-independent NOS activity. After 30 min at 37°C, the reaction was stopped with 100 μl of 1 M trichloroacetic acid. The samples were adjusted to pH 4.6 by adding 500 μl of 20 mM HEPES and applied to Dowex AG 50W-X8 resin columns. L-[3H]citrulline was eluted and separated by thin-layer chromatography. Radioactivity was counted with an AR-2000 scanner detector (Bioscan, Inc.). The results are expressed as pmol of L-[3H]citrulline/mg of protein/min. Isolation and culture of tumor endothelial cells were based on previously published methodology (22).
Measurement of nitrite and nitrate
Nitrite and nitrate determinations were based on the methodology of Braman and Hendrix and performed as described previously (23). Total NO2− plus NO3− (NOx) determinations were made by monitoring NO evolution from a measured sample placed into a boiling VCl3/HCl solution (which will reduce both NO2− and NO3− to NO). Quantitation was accomplished using a standard curve made up of known amounts of NO2− and NO3−.
CRH expression in the brain (in situ hybridization)
Sections of 10 μm of the PVN were cut according to a mouse brain atlas (www.brain-map.org) on a cryostat, mounted on polysine microscope slides (Menzel-Gläzer), and stored at −80°C for 24 h. Sections were fixed in 4% paraformaldehyde, further permeabilized by proteinase K treatment, acetylated twice with 0.25% acetic anhydride in 0.1 M triethanolamine, and dehydrated in a graded ethanol series. Hybridization, carried out as described before (40), was performed using specific 48-mer, 35S-labeled oligonucleotide probes for murine CRH mRNA (5′-GGC CCG CGG CGC TCC AGA GAC GGA TCC CCT GCT CAG CAGGGC CCT GCA-3′) (68). Hybridized slices were exposed to the BioMax MR film (Kodak). The mRNA expression of CRH in the PVN was quantified as gray density minus background in digitized images using the NIH ImageJ 1.6 program (http://rsb.info.nih.gov/ij). Bilateral measures were taken from two to four PVN sections per mouse and pooled to provide individual means per mouse. For tissue background, the optical density of a nonhybridized region outside the PVN was measured.
Measurement of ACTH, corticosterone, and NORA levels
Plasma ACTH (Calbiotech, Inc.), corticosterone (Kamiyama Biomedical Co.), and NORA (IBL) were quantified by ELISA according to the suppliers' instructions.
Measurement of the GR content of cancer cell lines by [3H]-labeled ligand binding assay
The GR content was measured by a whole-cell binding assay as previously described with some modifications (31). Briefly, 72 h cultured melanoma cells were harvested, as above, and resuspended in culture medium at 5 × 10⁶ cells/ml. Then, cells were exposed to various concentrations of [3H]-dexamethasone (GE Healthcare Life Sciences) from 1 to 100 nM in the presence or absence of 10 μM unlabeled dexamethasone, followed by incubation for 1 h at 37°C, and harvested by centrifugation (1200 rpm/min ×1 min). Cells were then washed thrice in 5.0 ml of Hank's balanced salt solution and suspended in 1.5 ml of the same solution. A 0.2-ml aliquot was used for cell number determination, and 1.0 ml was assayed for radioactivity by a liquid scintillation counter. The presence of at least 200-fold excess unlabeled dexamethasone effectively competed out all of the [3H]-dexamethasone binding to specific GR. The binding of [3H]-dexamethasone to GR was represented as the difference in disintegrations/minx cell between those samples incubated with [3H]-dexamethasone alone and those with at least 200-fold excess unlabeled dexamethasone. Using the specific activity of [3H]-dexamethasone, the GR number/cell was calculated, assuming that each receptor binds to one dexamethasone molecule.
Transfection of the red fluorescence protein
First, the pDsRed-2 vector (Clontech Laboratories, Inc.) was used, as described for A375 melanoma cells (45), to engineer A2058, MeWo, and MelJuso melanoma clones stably expressing the red fluorescence protein (RFP). Isolation of A2058-RFP, MeWo-RFP, or MelJuso-RFP cells from the xenografts was performed by laser microdissection and high-performance cell sorting as previously described (45).
RT-PCR and detection of mRNA
Total RNA was isolated using the TRIzol kit from Invitrogen following the manufacturer's instructions. cDNA was obtained using a random hexamer primer and a MultiScribe Reverse Transcriptase kit as recommended by the manufacturer (TaqMan RT Reagents; Applied Biosystems). PCR master mix and AmpliTaq Gold DNA polymerase (Applied Biosystems) were added to the primers previously reported (51) for the GCLC (catalytic subunit), GSH synthase (GSS), GPX2, GSR, GGT, SOD1, SOD2, CAT, NOX1, and glyceraldehyde-3P-dehydrogenase (GAPDH) (Sigma-Genosys). Other primer sequences (5′-3′) used were GSH transferase A1 (GSTA1), sense TTCCTTACTGGTCCTCACATCTC and antisense TCACCGGATCATGGCCAGCA; thioredoxin reductase 1 (TXNRD1), sense GTGTTGTGGGCTTTCACGTA and antisense CAGCCTGGAGGATGCTTG; malic enzyme 1 (ME1), sense AGTGCCTACCTGTGATGTTG and antisense GGCTTGACCTCTGATTCTCT; isocitrate dehydrogenase 1 (IDH1), sense ACCAAATGGCACCATACGA and antisense TTCATACCTTGCTTAATGGGTGT; iNOS, sense GCATGGCCTTCCGTGTTC and antisense TCCTCCTCCGCCTCGTAAGGA; and eNOS, sense TGGTACATGAGCACTGAGATCG and antisense CCACGTTGATTTCCACTGCTG (Sigma-Genosys). The primer sequences (5′-3′) used for POMC were sense AGTGTCGTCAGAAAGAACGAACGGC and antisense CTCAACTGGTGTCGTGGAGTC (74). Real-time quantification of mRNA relative to GAPDH was performed with an SYBR Green I assay and an iCycler detection system (Biorad). Target cDNA was amplified using the following conditions: 10 min at 95°C, followed by 40 cycles of denaturation at 95°C for 30 s, and annealing and extension at 60°C for 1 min. Changes in fluorescence were measured in real time during the extension step. The threshold cycle (CT) was determined and the relative gene expression expressed as fold change = 2−Δ(ΔCT), where ΔCT = CTtarget − CTGAPDH and Δ(ΔCT) = ΔCTtreated − ΔCTcontrol.
Enzyme assays
Isolated tumor cells were homogenized in 0.1 M phosphate buffer (pH 7.2) at 4°C. GCL and GSS activities were measured as previously described (50). GPX (selenium dependent) activity was measured as in (24) using H2O2 as a substrate. GSR activity was determined as previously reported (3). GGT activity was measured as in (50). GST activity was measured using an assay kit from Sigma. TXNRD activity, defined by the concentration of sodium lipoate (disulfide) reduced to dehydrolipoate (dithiol) per milligram protein, was measured as in (35). SOD activity was measured as in (25) using 2 mM cyanide in the assay medium to distinguish the mangano-type enzyme (SOD2) from the cuprozinc type (SOD1). CAT activity was analyzed as previously described (2). NOX activity was measured by chemiluminescence as in (72). Protein concentration was determined with the Pierce BCA protein assay (Fisher Scientific).
Measurement of H2O2 and O2• −
Quantitative measurement of H2O2 and flow cytometric determination of O2• − generation were performed as previously described (9).
GSH, GSSG, NADP+, and NADPH determination
GSH and GSSG were determined, as previously reported (51), by LC/MS using the equipment indicated above for Pter determination. Cell processing was performed according to published methodology, where rapid N-ethylmaleimide derivatization was used to prevent GSH auto-oxidation (6). NADP+ and NADPH were quantitated using an assay kit from Sigma.
Lipid peroxidation
For isoprostane determination, tumor samples, stored at −80°C, were homogenized in 0.1M phosphate buffer (pH 7.4)+1 mM EDTA +0.005% butylated hydroxytoluene. Isoprostanes were measured using the 8-isoprostane EIA kit (Cayman Chemical) and following the manufacturer's protocol.
Western blot analysis
For Western blotting, minced tissues were washed twice in ice-cold Krebs-Henseleit bicarbonate medium (pH 7.4). Tissue extracts were made by freeze–thaw cycles (cells) or homogenization (tissues) in a buffer containing 150 mM NaCl, 1 mM EDTA, 10 mM Tris-HCl, 1 mM phenylmethylsulfonyl fluoride, 1 μg/ml leupeptin, 1 μg/ml aprotinin, and 1 μg/ml pepstatin (pH 7.4). About 50 μg of protein (as determined by the Bradford assay) was boiled with Laemmli buffer and resolved in 12.5% SDS-PAGE. Proteins were transferred to a nitrocellulose membrane and subjected to Western blotting with anti-human SOD1 or CAT monoclonal antibodies (OriGene). Blots were developed using horseradish peroxidase-conjugated secondary antibody and enhanced chemiluminescence (ECL system; Amersham). Protein bands were quantified using laser densitometry. Equal protein loading on membranes and complete transfer were confirmed by staining the gels and membranes with Coomassie Blue. To make the pooling of data from different immunoblots possible, the relative density of each band was normalized against the internal standard analyzed on each blot.
Nrf2 gene transfer and measurement
The Tet-Off Advanced Inducible Gene Expression System (Clontech) was used to insert the human Nrf2 gene and for transfection into melanoma cells. Tet-off cells stably expressed Tet-regulated pTRE-Tight-Nrf2, giving an increased Nrf2 gene expression (Tet-Nrf2 cells). To suppress Nrf2 protein levels, Tet-Nrf2 cells were cultured in the presence of 2 mg tetracycline (Sigma)/106 cells. The NE-PER extraction kit from Thermo Scientific was used for nuclear protein extraction according to the manufacturer's instructions. Mouse monoclonal primary antibodies against Nrf2 were purchased from Abcam. A total of 50 mg of protein was boiled in Laemmli buffer and resolved by 12.0% SDS-PAGE. Proteins were transferred to a nitrocellulose membrane (Hybond C-extra; GE Healthcare Europe GmbH) and subjected to Western blotting. The blotted membrane was blocked for 1 h at room temperature in TBS containing 5% (w/v) membrane-blocking reagent (nonfat dried milk). All antibody incubations were carried out at 22°C in TBS containing 1% membrane-blocking reagent. The incubation steps were followed by three washing steps of 5 min using TBS containing 0.1% Tween 20. The blots were developed using horseradish peroxidase-conjugated secondary antibody and enhanced chemiluminescence (ECL system; GE Healthcare). Protein bands were quantified using laser densitometry. Relative density of each band was normalized against an internal standard, thus facilitating pooling of data from different immunoblots.
POMC analysis
RT-PCR and detection of mRNA were performed as described above. For Western blotting (see also above), POMC mouse monoclonal antibody (clone 2B2) from Origen was used.
Antisense oligodeoxynucleotides
Fully phosphorothioate-modified chimeric 20-mer human sod1 antisense oligonucleotides comprising five 2′-O-(2-methoxy)ethyl modifications on both the 5′ and 3′ ends and 10 oligodeoxynucleotides in the center to support RNase H activity (sequence: 5′-GTCGCCCTTCAGCACGCACA-3′) were obtained from Sigma-Genosys. As a control, a reversed phosphorothioated 20-mer sequence was purchased from the same source. Inhibition of sod1 expression was verified by measuring the SOD1 activity and Western blot analysis with anti-human SOD1 monoclonal antibody (Sigma).
Evaluation of Pter-induced in vivo toxicity
This included the following parameters: blood cell count and chemistry based on NIH standard methodology, and urinalysis based on the Combur test from Roche. Urine pH was directly measured using a pH meter and urine protein content with the Pierce BCA Protein Assay Kit. The glomerular filtration rate was evaluated following the single-bolus FITC-inulin clearance methodology described for mice by Qi et al. (57).
Isolation and incubation of hepatocytes and lymphocytes
Isolation of hepatocytes was performed according to previously reported methodology (11). Blood mononuclear cells were obtained from heparinized blood by Accuspin-Histopaque (Sigma) gradient centrifugation. Mononuclear cells were washed twice and resuspended in Krebs-Henseleit bicarbonate medium (pH 7.4) with 0.3% bovine serum albumin at a concentration of 20 × 106 cells/ml. Further positive selection of lymphocyte subsets by monodispersed immunomagnetic Dynabeads (Dynal) was performed at 4°C, as described elsewhere (65). Hepatocyte and lymphocyte cell volumes were obtained as previously described (18).
Isolated hepatocytes were incubated in flasks (about 10 mg dry wt/ml) at 37°C in Krebs-Henseleit bicarbonate medium (pH 7.4) containing 1.3 mM-CaCl2, 5% fat-free bovine serum albumin, and in the presence of glucose (5 mM). The gas atmosphere was O2/CO2 (19:1). Isolated lymphocytes were incubated (106 cells/flask) at 37°C in Krebs-Ringer medium with 5% fat-free bovine serum albumin and in the presence of glucose (5 mM) and glutamine (2 mM). After incubation, the cells were disrupted by the addition of 0.2 ml of 25% perchloric acid. Protein was removed by centrifugation and the supernatant was neutralized with 20 ml of a 40% KOH solution and a Tris-(hydroxymethyl) aminomethane/KOH (0.5–2.0 M) solution for the measurement of the metabolites. Rates of glucose and glutamine utilization were measured as previously described (48).
Culture of hepatocytes
Isolated hepatocytes were diluted with warm William's complete medium to 2.5 × 10⁵ cells/ml and plated in uncoated cultured flasks at a ratio of 5 × 10⁵ cells/2 ml. Cells were cultured at 37°C in a humidified atmosphere of 95% air and 5% CO2.
Determination of EGCG and Curc by high-pressure LC-MS/MS
LC-MS/MS procedures were based on previously reported methodologies (42, 69), but using the equipment indicated for Pter determination.
Expression of results and statistical analyses
Data are presented as mean values ± SD for the number of different experiments. Statistical analyses were performed using Student's t-test, and p < 0.05 was considered significant.
Supplementary Material
Abbreviations Used
- ACTH
adrenocorticotropin hormone
- BSO
buthionine sulfoximine
- CAT
catalase
- CRH
corticotropin-releasing hormone
- Curc
curcumin
- DEM
diethylmaleate
- EGCG
(−)-epigallocatechin gallate
- eNOS
endothelial nitric oxide synthase
- FCS
fetal calf serum
- GAPDH
glyceraldehyde-3P-dehydrogenase
- GCL
γ-glutamylcysteine ligase
- GGT1
γ-glutamyltranspeptidase 1
- GPX
glutathione peroxidase
- GR
glucocorticoid receptor
- GSH
glutathione
- GSR
glutathione reductase
- GSS
GSH synthase
- HPA
hypothalamic–pituitary–adrenal
- IL
interleukin
- iNOS
inducible nitric oxide synthase
- LC-MS/MS
liquid chromatography and mass spectrometry
- NORA
noradrenaline
- NOX1
NADPH oxidase 1
- Nrf2
nuclear factor (erythroid-derived 2)-like 2
- PAC.PBP
paclitaxel protein-bound particles
- PBS
phosphate-buffered saline
- PFs
natural polyphenols
- POMC
proopiomelanocortin
- Pter
pterostilbene
- Pter-G
pterostilbene-glucuronide
- Pter-S
pterostilbene-4′-sulfate
- PVN
paraventricular nucleus
- Quer
quercetin
- RFP
red fluorescence protein
- ROS
reactive oxygen species
- Sirt
sirtuins
- SOD
superoxide dismutase
- sod1-AS
antisense oligonucleotides anti-sod1
Acknowledgments
This research was supported by grants from the MINECO (www.idi.mineco.gob.es) (SAF2012-31565) and the ISCIII-FEDER (www.isciii.es) and PI13/01848 project, integrated into the Plan Estatal de I+D+I 2013–2016 and funded by the ISCIII-Subdirección General de Evaluación y el Fondo Europeo de Desarrollo Regional (FEDER), Spain. The authors thank the expert technical assistance of M.C. Tormos (University of Valencia, Spain), J.G. Sánchez-Plaza (who held a student Science without Borders fellowship from the Ministério da Educação, Brasil), and C.L. Perez (Department of Biochemistry, Institute of Basic and Preclinical Sciences, Victoria de Girón, 3102146 La Habana, Cuba; who held a Young Researchers fellowship from the University of Valencia, Spain).
Author Disclosure Statement
No competing financial interests exist.
References
- 1.Adachi N, Tomonaga S, Tachibana T, Denbow DM, and Furuse M. (-)-Epigallocatechin gallate attenuates acute stress responses through GABAergic system in the brain. Eur J Pharmacol 531: 171–175, 2006 [DOI] [PubMed] [Google Scholar]
- 2.Aebi H. Catalase in vitro. Methods Enzymol 105: 121–126, 1984 [DOI] [PubMed] [Google Scholar]
- 3.Akerboom TP, Gartner M, and Sies H. Cellular hydroperoxide metabolism: the roles of glutathione peroxidases and of catalase in liver. Bull Eur Physiopathol Respir 17 Suppl: 221–227, 1981 [PubMed] [Google Scholar]
- 4.Asensi M, Medina I, Ortega A, Carretero J, Bano MC, Obrador E, and Estrela JM. Inhibition of cancer growth by resveratrol is related to its low bioavailability. Free Radic Biol Med 33: 387–398, 2002 [DOI] [PubMed] [Google Scholar]
- 5.Asensi M, Ortega A, Mena S, Feddi F, and Estrela JM. Natural polyphenols in cancer therapy. Crit Rev Clin Lab Sci 48: 197–216, 2011 [DOI] [PubMed] [Google Scholar]
- 6.Asensi M, Sastre J, Pallardo FV, Garcia de la Asuncion J, Estrela JM, and Vina J. A high-performance liquid chromatography method for measurement of oxidized glutathione in biological samples. Anal Biochem 217: 323–328, 1994 [DOI] [PubMed] [Google Scholar]
- 7.Azzolini M, La Spina M, Mattarei A, Paradisi C, Zoratti M, and Biasutto L. Pharmacokinetics and tissue distribution of pterostilbene in the rat. Mol Nutr Food Res 58: 2122–2132, 2014 [DOI] [PubMed] [Google Scholar]
- 8.Bekasi S. and Zalatnai A. Overexpression of glucocorticoid receptor in human pancreatic cancer and in xenografts. An immunohistochemical study. Pathol Oncol Res 15: 561–566, 2009 [DOI] [PubMed] [Google Scholar]
- 9.Benlloch M, Mena S, Ferrer P, Obrador E, Asensi M, Pellicer JA, Carretero J, Ortega A, and Estrela JM. Bcl-2 and Mn-SOD antisense oligodeoxynucleotides and a glutamine-enriched diet facilitate elimination of highly resistant B16 melanoma cells by tumor necrosis factor-alpha and chemotherapy. J Biol Chem 281: 69–79, 2006 [DOI] [PubMed] [Google Scholar]
- 10.Bergland RM. and Page RB. Pituitary-brain vascular relations: a new paradigm. Science 204: 18–24, 1979 [DOI] [PubMed] [Google Scholar]
- 11.Berry MN. and Friend DS. High-yield preparation of isolated rat liver parenchymal cells: a biochemical and fine structural study. J Cell Biol 43: 506–520, 1969 [DOI] [PMC free article] [PubMed] [Google Scholar]
- 12.Cai L, Li R, Wu QQ, and Wu TN. [Effect of hesperidin on behavior and HPA axis of rat model of chronic stress-induced depression]. Zhongguo Zhong Yao Za Zhi 38: 229–233, 2013 [PubMed] [Google Scholar]
- 13.Chalkiadaki A. and Guarente L. The multifaceted functions of sirtuins in cancer. Nat Rev Cancer 15: 608–624, 2015 [DOI] [PubMed] [Google Scholar]
- 14.Cheng TC, Lai CS, Chung MC, Kalyanam N, Majeed M, Ho CT, Ho YS, and Pan MH. Potent anti-cancer effect of 3′-hydroxypterostilbene in human colon xenograft tumors. PLoS One 9: e111814, 2014 [DOI] [PMC free article] [PubMed] [Google Scholar]
- 15.Deer EL, Gonzalez-Hernandez J, Coursen JD, Shea JE, Ngatia J, Scaife CL, Firpo MA, and Mulvihill SJ. Phenotype and genotype of pancreatic cancer cell lines. Pancreas 39: 425–435, 2010 [DOI] [PMC free article] [PubMed] [Google Scholar]
- 16.Dobos J, Kenessey I, Timar J, and Ladanyi A. Glucocorticoid receptor expression and antiproliferative effect of dexamethasone on human melanoma cells. Pathol Oncol Res 17: 729–734, 2011 [DOI] [PubMed] [Google Scholar]
- 17.Dumay A, Rincheval V, Trotot P, Mignotte B, and Vayssiere JL. The superoxide dismutase inhibitor diethyldithiocarbamate has antagonistic effects on apoptosis by triggering both cytochrome c release and caspase inhibition. Free Radic Biol Med 40: 1377–1390, 2006 [DOI] [PubMed] [Google Scholar]
- 18.Estrela JM, Hernandez R, Terradez P, Asensi M, Puertes IR, and Vina J. Regulation of glutathione metabolism in Ehrlich ascites tumour cells. Biochem J 286 (Pt 1): 257–262, 1992 [DOI] [PMC free article] [PubMed] [Google Scholar]
- 19.Estrela JM, Obrador E, Navarro J, Lasso De la Vega MC, and Pellicer JA. Elimination of Ehrlich tumours by ATP-induced growth inhibition, glutathione depletion and X-rays. Nat Med 1: 84–88, 1995 [DOI] [PubMed] [Google Scholar]
- 20.Estrela JM, Ortega A, and Obrador E. Glutathione in cancer biology and therapy. Crit Rev Clin Lab Sci 43: 143–181, 2006 [DOI] [PubMed] [Google Scholar]
- 21.Fauci AS. Mechanisms of the immunosuppressive and anti-inflammatory effects of glucocorticosteroids. J Immunopharmacol 1: 1–25, 1978 [DOI] [PubMed] [Google Scholar]
- 22.Ferrer P, Asensi M, Priego S, Benlloch M, Mena S, Ortega A, Obrador E, Esteve JM, and Estrela JM. Nitric oxide mediates natural polyphenol-induced Bcl-2 down-regulation and activation of cell death in metastatic B16 melanoma. J Biol Chem 282: 2880–2890, 2007 [DOI] [PubMed] [Google Scholar]
- 23.Ferrer P, Asensi M, Segarra R, Ortega A, Benlloch M, Obrador E, Varea MT, Asensio G, Jorda L, and Estrela JM. Association between pterostilbene and quercetin inhibits metastatic activity of B16 melanoma. Neoplasia 7: 37–47, 2005 [DOI] [PMC free article] [PubMed] [Google Scholar]
- 24.Flohe L. and Gunzler WA. Assays of glutathione peroxidase. Methods Enzymol 105: 114–121, 1984 [DOI] [PubMed] [Google Scholar]
- 25.Flohe L. and Otting F. Superoxide dismutase assays. Methods Enzymol 105: 93–104, 1984 [DOI] [PubMed] [Google Scholar]
- 26.Fukuda Y, Kageyama K, Nigawara T, Kasagi Y, and Suda T. Effects of corticotropin-releasing hormone (CRH) on the synthesis and secretion of proopiomelanocortin-related peptides in the anterior pituitary: a study using CRH-deficient mice. Neurosci Lett 367: 201–204, 2004 [DOI] [PubMed] [Google Scholar]
- 27.Gonzalez-Vallinas M, Gonzalez-Castejon M, Rodriguez-Casado A, and Ramirez de Molina A. Dietary phytochemicals in cancer prevention and therapy: a complementary approach with promising perspectives. Nutr Rev 71: 585–599, 2013 [DOI] [PubMed] [Google Scholar]
- 28.Gorrini C, Harris IS, and Mak TW. Modulation of oxidative stress as an anticancer strategy. Nat Rev Drug Discov 12: 931–947, 2013 [DOI] [PubMed] [Google Scholar]
- 29.Gout PW, Buckley AR, Simms CR, and Bruchovsky N. Sulfasalazine, a potent suppressor of lymphoma growth by inhibition of the x(c)- cystine transporter: a new action for an old drug. Leukemia 15: 1633–1640, 2001 [DOI] [PubMed] [Google Scholar]
- 30.Gumireddy K, Li A, Cao L, Yan J, Liu L, Xu X, Pazoles C, and Huang Q. NOV-002, a glutathione disulfide mimetic, suppresses tumor cell invasion and metastasis. J Carcinog Mutagen 2013: pii-, 2013 [DOI] [PMC free article] [PubMed] [Google Scholar]
- 31.Harmon JM. and Thompson EB. Isolation and characterization of dexamethasone-resistant mutants from human lymphoid cell line CEM-C7. Mol Cell Biol 1: 512–521, 1981 [DOI] [PMC free article] [PubMed] [Google Scholar]
- 32.Hoff JB, Dysko R, Kurachi S, and Kurachi K. Technique for performance and evaluation of parapharyngeal hypophysectomy in mice. J Am Assoc Lab Anim Sci 45: 57–62, 2006 [PubMed] [Google Scholar]
- 33.Homma S, Ishii Y, Morishima Y, Yamadori T, Matsuno Y, Haraguchi N, Kikuchi N, Satoh H, Sakamoto T, Hizawa N, Itoh K, and Yamamoto M. Nrf2 enhances cell proliferation and resistance to anticancer drugs in human lung cancer. Clin Cancer Res 15: 3423–3432, 2009 [DOI] [PubMed] [Google Scholar]
- 34.Huang P, Feng L, Oldham EA, Keating MJ, and Plunkett W. Superoxide dismutase as a target for the selective killing of cancer cells. Nature 407: 390–395, 2000 [DOI] [PubMed] [Google Scholar]
- 35.Javvadi P, Hertan L, Kosoff R, Datta T, Kolev J, Mick R, Tuttle SW, and Koumenis C. Thioredoxin reductase-1 mediates curcumin-induced radiosensitization of squamous carcinoma cells. Cancer Res 70: 1941–1950, 2010 [DOI] [PMC free article] [PubMed] [Google Scholar]
- 36.Kawabata K, Kawai Y, and Terao J. Suppressive effect of quercetin on acute stress-induced hypothalamic-pituitary-adrenal axis response in Wistar rats. J Nutr Biochem 21: 374–380, 2010 [DOI] [PubMed] [Google Scholar]
- 37.Kawai Y, Garduno L, Theodore M, Yang J, and Arinze IJ. Acetylation-deacetylation of the transcription factor Nrf2 (nuclear factor erythroid 2-related factor 2) regulates its transcriptional activity and nucleocytoplasmic localization. J Biol Chem 286: 7629–7640, 2011 [DOI] [PMC free article] [PubMed] [Google Scholar]
- 38.Khushnud T. and Mousa SA. Potential role of naturally derived polyphenols and their nanotechnology delivery in cancer. Mol Biotechnol 55: 78–86, 2013 [DOI] [PubMed] [Google Scholar]
- 39.Kroon PA, Clifford MN, Crozier A, Day AJ, Donovan JL, Manach C, and Williamson G. How should we assess the effects of exposure to dietary polyphenols in vitro? Am J Clin Nutr 80: 15–21, 2004 [DOI] [PubMed] [Google Scholar]
- 40.Lachize S, Apostolakis EM, van der Laan S, Tijssen AM, Xu J, de Kloet ER, and Meijer OC. Steroid receptor coactivator-1 is necessary for regulation of corticotropin-releasing hormone by chronic stress and glucocorticoids. Proc Natl Acad Sci U S A 106: 8038–8042, 2009 [DOI] [PMC free article] [PubMed] [Google Scholar]
- 41.Li K, Dias SJ, Rimando AM, Dhar S, Mizuno CS, Penman AD, Lewin JR, and Levenson AS. Pterostilbene acts through metastasis-associated protein 1 to inhibit tumor growth, progression and metastasis in prostate cancer. PLoS One 8: e57542, 2013 [DOI] [PMC free article] [PubMed] [Google Scholar]
- 42.Lin LC, Wang MN, Tseng TY, Sung JS, and Tsai TH. Pharmacokinetics of (-)-epigallocatechin-3-gallate in conscious and freely moving rats and its brain regional distribution. J Agric Food Chem 55: 1517–1524, 2007 [DOI] [PubMed] [Google Scholar]
- 43.Masuelli L, Di Stefano E, Fantini M, Mattera R, Benvenuto M, Marzocchella L, Sacchetti P, Focaccetti C, Bernardini R, Tresoldi I, Izzi V, Mattei M, Frajese GV, Lista F, Modesti A, and Bei R. Resveratrol potentiates the in vitro and in vivo anti-tumoral effects of curcumin in head and neck carcinomas. Oncotarget 5: 10745–10762, 2014 [DOI] [PMC free article] [PubMed] [Google Scholar]
- 44.Mena S, Benlloch M, Ortega A, Carretero J, Obrador E, Asensi M, Petschen I, Brown BD, and Estrela JM. Bcl-2 and glutathione depletion sensitizes B16 melanoma to combination therapy and eliminates metastatic disease. Clin Cancer Res 13: 2658–2666, 2007 [DOI] [PubMed] [Google Scholar]
- 45.Mena S, Rodriguez ML, Ortega A, Priego S, Obrador E, Asensi M, Petschen I, Cerda M, Brown BD, and Estrela JM. Glutathione and Bcl-2 targeting facilitates elimination by chemoradiotherapy of human A375 melanoma xenografts overexpressing bcl-xl, bcl-2, and mcl-1. J Transl Med 10: 8, 2012 [DOI] [PMC free article] [PubMed] [Google Scholar]
- 46.Mena S, Rodriguez ML, Ponsoda X, Estrela JM, Jaattela M, and Ortega AL. Pterostilbene-induced tumor cytotoxicity: a lysosomal membrane permeabilization-dependent mechanism. PLoS One 7: e44524, 2012 [DOI] [PMC free article] [PubMed] [Google Scholar]
- 47.Min KJ, Jang JH, Lee JT, Choi KS, and Kwon TK. Glucocorticoid receptor antagonist sensitizes TRAIL-induced apoptosis in renal carcinoma cells through up-regulation of DR5 and down-regulation of c-FLIP(L) and Bcl-2. J Mol Med (Berl) 90: 309–319, 2012 [DOI] [PubMed] [Google Scholar]
- 48.Newsholme P, Gordon S, and Newsholme EA. Rates of utilization and fates of glucose, glutamine, pyruvate, fatty acids and ketone bodies by mouse macrophages. Biochem J 242: 631–636, 1987 [DOI] [PMC free article] [PubMed] [Google Scholar]
- 49.Obrador E, Benlloch M, Pellicer JA, Asensi M, and Estrela JM. Intertissue flow of glutathione (GSH) as a tumor growth-promoting mechanism: interleukin 6 induces GSH release from hepatocytes in metastatic B16 melanoma-bearing mice. J Biol Chem 286: 15716–15727, 2011 [DOI] [PMC free article] [PubMed] [Google Scholar]
- 50.Obrador E, Carretero J, Ortega A, Medina I, Rodilla V, Pellicer JA, and Estrela JM. gamma-Glutamyl transpeptidase overexpression increases metastatic growth of B16 melanoma cells in the mouse liver. Hepatology 35: 74–81, 2002 [DOI] [PubMed] [Google Scholar]
- 51.Obrador E, Valles SL, Benlloch M, Sirerol JA, Pellicer JA, Alcacer J, Coronado JA, and Estrela JM. Glucocorticoid receptor knockdown decreases the antioxidant protection of B16 melanoma cells: an endocrine system-related mechanism that compromises metastatic cell resistance to vascular endothelium-induced tumor cytotoxicity. PLoS One 9: e96466, 2014 [DOI] [PMC free article] [PubMed] [Google Scholar]
- 52.Ortega AL, Mena S, and Estrela JM. Glutathione in cancer cell death. Cancers (Basel) 3: 1285–1310, 2011 [DOI] [PMC free article] [PubMed] [Google Scholar]
- 53.Pan C, Hu Y, Li J, Wang Z, Huang J, Zhang S, and Ding L. Estrogen receptor-alpha36 is involved in pterostilbene-induced apoptosis and anti-proliferation in in vitro and in vivo breast cancer. PLoS One 9: e104459, 2014 [DOI] [PMC free article] [PubMed] [Google Scholar]
- 54.Patel KR, Andreadi C, Britton RG, Horner-Glister E, Karmokar A, Sale S, Brown VA, Brenner DE, Singh R, Steward WP, Gescher AJ, and Brown K. Sulfate metabolites provide an intracellular pool for resveratrol generation and induce autophagy with senescence. Sci Transl Med 5: 205ra133, 2013 [DOI] [PubMed] [Google Scholar]
- 55.Powell ND, Tarr AJ, and Sheridan JF. Psychosocial stress and inflammation in cancer. Brain Behav Immun 30 Suppl: S41–S47, 2013 [DOI] [PubMed] [Google Scholar]
- 56.Priego S, Feddi F, Ferrer P, Mena S, Benlloch M, Ortega A, Carretero J, Obrador E, Asensi M, and Estrela JM. Natural polyphenols facilitate elimination of HT-29 colorectal cancer xenografts by chemoradiotherapy: a Bcl-2- and superoxide dismutase 2-dependent mechanism. Mol Cancer Ther 7: 3330–3342, 2008 [DOI] [PubMed] [Google Scholar]
- 57.Qi Z, Whitt I, Mehta A, Jin J, Zhao M, Harris RC, Fogo AB, and Breyer MD. Serial determination of glomerular filtration rate in conscious mice using FITC-inulin clearance. Am J Physiol Renal Physiol 286: F590–F596, 2004 [DOI] [PubMed] [Google Scholar]
- 58.Quideau S, Deffieux D, Douat-Casassus C, and Pouysegu L. Plant polyphenols: chemical properties, biological activities, and synthesis. Angew Chem Int Ed Engl 50: 586–621, 2011 [DOI] [PubMed] [Google Scholar]
- 59.Reiche EM, Nunes SO, and Morimoto HK. Stress, depression, the immune system, and cancer. Lancet Oncol 5: 617–625, 2004 [DOI] [PubMed] [Google Scholar]
- 60.Schlossmacher G, Stevens A, and White A. Glucocorticoid receptor-mediated apoptosis: mechanisms of resistance in cancer cells. J Endocrinol 211: 17–25, 2011 [DOI] [PubMed] [Google Scholar]
- 61.Shankar S, Marsh L, and Srivastava RK. EGCG inhibits growth of human pancreatic tumors orthotopically implanted in Balb C nude mice through modulation of FKHRL1/FOXO3a and neuropilin. Mol Cell Biochem 372: 83–94, 2013 [DOI] [PMC free article] [PubMed] [Google Scholar]
- 62.Shtivelman E, Davies MQ, Hwu P, Yang J, Lotem M, Oren M, Flaherty KT, and Fisher DE. Pathways and therapeutic targets in melanoma. Oncotarget 5: 1701–1752, 2014 [DOI] [PMC free article] [PubMed] [Google Scholar]
- 63.Suzuki T. and Yamamoto M. Molecular basis of the Keap1-Nrf2 system. Free Radic Biol Med 88: 93–100, 2015 [DOI] [PubMed] [Google Scholar]
- 64.Szatrowski TP. and Nathan CF. Production of large amounts of hydrogen peroxide by human tumor cells. Cancer Res 51: 794–798, 1991 [PubMed] [Google Scholar]
- 65.Thornton AM. Fractionation of T and B cells using magnetic beads. Curr Protoc Immunol Chapter 3: Unit 3 5A, 2003 [DOI] [PubMed] [Google Scholar]
- 66.Trachootham D, Zhou Y, Zhang H, Demizu Y, Chen Z, Pelicano H, Chiao PJ, Achanta G, Arlinghaus RB, Liu J, and Huang P. Selective killing of oncogenically transformed cells through a ROS-mediated mechanism by beta-phenylethyl isothiocyanate. Cancer Cell 10: 241–252, 2006 [DOI] [PubMed] [Google Scholar]
- 67.Valles SL, Benlloch M, Rodriguez ML, Mena S, Pellicer JA, Asensi M, Obrador E, and Estrela JM. Stress hormones promote growth of B16-F10 melanoma metastases: an interleukin 6- and glutathione-dependent mechanism. J Transl Med 11: 72, 2013 [DOI] [PMC free article] [PubMed] [Google Scholar]
- 68.Veenema AH, Reber SO, Selch S, Obermeier F, and Neumann ID. Early life stress enhances the vulnerability to chronic psychosocial stress and experimental colitis in adult mice. Endocrinology 149: 2727–2736, 2008 [DOI] [PubMed] [Google Scholar]
- 69.Vijaya Saradhi UV, Ling Y, Wang J, Chiu M, Schwartz EB, Fuchs JR, Chan KK, and Liu Z. A liquid chromatography-tandem mass spectrometric method for quantification of curcuminoids in cell medium and mouse plasma. J Chromatogr B Analyt Technol Biomed Life Sci 878: 3045–3051, 2010 [DOI] [PMC free article] [PubMed] [Google Scholar]
- 70.Volden PA. and Conzen SD. The influence of glucocorticoid signaling on tumor progression. Brain Behav Immun 30 Suppl: S26–S31, 2013 [DOI] [PMC free article] [PubMed] [Google Scholar]
- 71.Webster BR, Lu Z, Sack MN, and Scott I. The role of sirtuins in modulating redox stressors. Free Radic Biol Med 52: 281–290, 2012 [DOI] [PMC free article] [PubMed] [Google Scholar]
- 72.Wind S, Beuerlein K, Eucker T, Muller H, Scheurer P, Armitage ME, Ho H, Schmidt HH, and Wingler K. Comparative pharmacology of chemically distinct NADPH oxidase inhibitors. Br J Pharmacol 161: 885–898, 2010 [DOI] [PMC free article] [PubMed] [Google Scholar]
- 73.Xu Y, Ku B, Tie L, Yao H, Jiang W, Ma X, and Li X. Curcumin reverses the effects of chronic stress on behavior, the HPA axis, BDNF expression and phosphorylation of CREB. Brain Res 1122: 56–64, 2006 [DOI] [PubMed] [Google Scholar]
- 74.Zhang N, Lin JK, Chen J, Liu XF, Liu JL, Luo HS, Li YQ, and Cui S. MicroRNA 375 mediates the signaling pathway of corticotropin-releasing factor (CRF) regulating pro-opiomelanocortin (POMC) expression by targeting mitogen-activated protein kinase 8. J Biol Chem 288: 10361–10373, 2013 [DOI] [PMC free article] [PubMed] [Google Scholar]
Associated Data
This section collects any data citations, data availability statements, or supplementary materials included in this article.