

Abstract
Objective
Glucagon-like peptide-1 (GLP-1) analogs are attractive options for the treatment of type II diabetes and obesity because of their incretin and anorexigenic effects. Peripheral administration of the GLP-1R agonist Exendin-4 (Ex-4) also increases glucocorticoid secretion in rodents and humans, but whether the released glucocorticoids interact with Ex-4's anorexigenic effect remains unclear.
Methods
To test this, we used two experimental approaches that suppress corticosterone secretion and then assessed Ex-4 effects on eating in adult male rats. First, we combined acute and chronic low dose dexamethasone treatment with Ex-4. Second, we ablated hindbrain catecholamine neurons projecting to the hypothalamus with anti-dopamine-β-hydroxylase-saporin (DSAP) to block Ex-4-induced corticosterone secretion.
Results
Combining dexamethasone and Ex-4 produced a larger acute anorexigenic effect than Ex-4 alone. Likewise, chronic dexamethasone and Ex-4 co-treatment produced a synergistic effect on eating and greater body weight loss in diet-induced obese rats than Ex-4 alone. DSAP lesions not only blunted Ex-4's ability to increase corticosterone secretion, but potentiated the anorexigenic effect of Ex-4, indicating that Ex-4-dependent corticosterone secretion opposes Ex-4's actions. Consistent with the enhancement of Ex-4's anorexigenic effect, DSAP lesion altered Ex-4-dependent changes in neuropeptide Y, preproglucagon, and corticotropin releasing hormone gene expression involved in glucocorticoid feedback.
Conclusions
Our findings demonstrate that limiting glucocorticoid secretion and actions with low dose dexamethasone or DSAP lesion increases Ex-4's ability to reduce food intake and body weight. Novel glucocorticoid receptor based mechanisms, therefore, may help enhance GLP-1-based obesity therapies.
Keywords: GLP-1, Exendin-4, Corticosterone, Anti-dopamine-β-hydroxylase-saporin, Hypothalamus, Neuropeptide Y
Highlights
-
•
Blocking HPA axis by low dose dexamethasone increased the anorexigenic property of Ex-4.
-
•
Dexamethasone/Ex-4 co-treatment reduced food intake and body weight in diet-induced obese rats more than Ex-4 alone.
-
•
A brain lesion model identified a potential central interaction between glucocorticoids and GLP-1 in food intake control.
1. Introduction
Endogenous glucagon-like peptide-1 (GLP-1) contributes to glycemic control by enhancing glucose-induced insulin secretion and inhibiting glucagon release [1], [2]. In addition to its incretin action, GLP-1 inhibits eating and gastric emptying by activating peripheral and central mechanisms [3], [4], [5], [6], [7]. Therefore, GLP-1 and its receptor have become attractive targets for the treatment of type II diabetes (T2D) and obesity. Due to the short half-life (<2 min) of native GLP-1, longer acting GLP-1 analogs such as exenatide and liraglutide have been developed, and they have been approved for the treatment of T2D and, more recently, obesity [8], [9], [10]. GLP-1 analog treatments improve pancreatic β-cell functions and enhance insulin secretion, thus alleviating hyperglycemia in obese and diabetic patients [11]. The mechanisms of the food intake and body weight reducing effects of GLP-1 analogs are complex and appear to recruit central and peripheral GLP-1 receptors (GLP-1R) [12], [13], [14], [15]. Recently, Sisley et al. showed that neuronal GLP-1R, but not GLP-1R in the visceral nerves, mediate the chronic eating inhibition by liraglutide [16], emphasizing the importance of central GLP-1R in the pharmacology of GLP-1 based therapy. The hypothalamic arcuate nucleus (ARC) and the area postrema (AP) in the hindbrain exhibited a particular high expression of fluorescent-tagged liraglutide and are regarded as the major brain sites mediating liraglutide-dependent weight loss [17].
GLP-1R agonist treatment, however, activates neurons in multiple brain areas implicated in the control of food intake, glucose metabolism, thermoregulation, and autonomic functions [18], [19], [20]. For instance, Exendin-4 (Ex-4) treatments activate catecholamine (CA) neurons in hindbrain regions including the AP, the nucleus tractus solitarii (NTS), and the ventrolateral medulla (VLM), which contribute to the regulation of heart rate and blood pressure [20], [21]. Hindbrain CA neurons are also known to influence eating and glycemia in glucoprivation via two distinct pathways, i.e., the activation of 1) the sympathoadrenal response to increase circulating catecholamines, and 2) the hypothalamic-pituitary-adrenal (HPA) axis to increase corticosterone release [22], [23]. In particular, a subset of CA neurons in the NTS and VLM projecting to the paraventricular hypothalamus (PVH) are required for glucoprivic challenges to stimulate eating and corticosterone secretion [24], [25]. Neurotoxin-induced ablation of these neurons blunted the corticosterone release and eating response to the glucoprivic agent 2-deoxy-d-glucose (2DG).
CNS glucose sensing mechanisms also contribute to the eating inhibition by GLP-1 [26]. In fasting and after 2DG treatment, low glucose availability in the brain blunted the ability of GLP-1 to reduce food intake in rats, reiterating that GLP-1 is an important regulator of glucose homeostasis via eating control. Furthermore, acute peripheral administration of a pharmacological dose of Ex-4 not only produces a profound eating inhibition, but, paradoxically, also induces hyperglycemia by sympathetic nerve and adrenal activation in rats [27]. Indeed, peripheral administration of GLP-1 or Ex-4 increases HPA activity and circulating glucocorticoids in rodents (corticosterone) and human (cortisol) [28]. Because the adrenals do not appear to express GLP-1R [29], GLP-1 most likely activates a central pathway leading to HPA axis stimulation [30], [31]. Therefore, it is reasonable to speculate that the activation of CA neurons by Ex-4 stimulates the HPA axis and thus counterbalances the anorexigenic property of GLP-1R activation when blood glucose levels are low. Identifying the central mechanism affecting the potency of GLP-1R agonist treatment will be important for the improvement of GLP-1-based drug therapies.
To understand the role of HPA axis activation in the eating inhibition by peripheral Ex-4 administration, we first administered Ex-4 after suppressing corticosterone secretion using low dose dexamethasone, a long acting synthetic corticoid, in rats fed standard chow diet. This manipulation increased the anorexigenic potency of Ex-4 and prompted us to assess the chronic effects of Ex-4 and dexamethasone co-administration on food intake, body weight, energy expenditure, and glucose tolerance in diet-induced obese (DIO) rats. Finally, to investigate the CNS mechanism mediating the Ex-4 effects on the HPA axis and food intake, we injected anti-dopamine-β-hydroxylase (DBH) saporin neurotoxin into the PVH to specifically ablate DBH expressing neurons projecting to the PVH. Our findings demonstrate that pharmacological and central lesion approaches to block the downstream actions of corticosterone can increase the potency of Ex-4 to reduce food intake, revealing an important balance between GLP-1 and corticosterone in the regulation of energy homeostasis.
2. Materials and methods
2.1. Animals
Male Sprague Dawley (SD) rats were purchased from Charles River Laboratories (Sulzfeld, Germany) and housed individually in a climate-controlled room (temperature: 23 ± 2 °C, humidity: 55 ± 5%). Rats were maintained on a 12 h light/dark cycle with ad libitum access to standard chow diet (No 3436, Provimi Kliba AG, Kaiseraugst, Switzerland) and tap water, except as noted. All procedures were approved by the Cantonal Veterinary Office of Zurich.
2.2. Acute dexamethasone and Exendin-4 treatment in lean rats
Twenty-four male SD rats (320–340 g) rats on standard chow diet were implanted with jugular vein catheters for blood sampling and recovered for 7 days. The rats were then divided into 4 groups (n = 6) and received dexamethasone (Sigma–Aldrich, St. Louis, USA, Cat # 31381, 50 μg/kg, s.c.) or PBS 90 min prior to Ex-4 (Bachem, Switzerland, H-8730, 1 μg/kg, i.p.) at dark onset. Blood was collected for baseline (90 min prior to dark onset), and at 0 (dark onset), 0.5, 1, 2, 4, and 24 h for the measurements of leptin, insulin, and corticosterone. Food intake, body weight, and energy expenditure were measured for 24 h in an open circuit calorimetry phenomaster system (TSE systems, Bad Homburg, Germany).
2.3. Chronic dexamethasone and Exendin-4 treatment in obese rats
Another cohort of twenty four male SD rats (320–340 g) were fed 60% high-fat diet (HFD, Ssniff Spezialdiäten GmbH, Soest, Cat # E15742-34) for 20 weeks and were monitored for body weight gain weekly. After 20 weeks on HFD, obese rats (600–800 g) were divided into 4 groups (n = 6) and received either dexamethasone (5 μg/kg, s.c.) and/or Ex-4 (3 μg/kg, s.c.) treatment at dark onset for 14 days. Food intake and body weight were measured daily. After 14 days, rats were subjected to indirect calorimetry and to an intraperitoneal glucose tolerance test. Blood was collected for leptin (fasted) and corticosterone (at the peak time of circadian rhythm) measurements by tail vein sampling.
2.4. Indirect calorimetry
Respiratory exchange ratio (RER) and heat production (EE) measurements were conducted in an open circuit calorimetry Phenomaster system (TSE) after 3 days of habituation. Data are presented as the average RER and EE values in dark, light, and total cycle.
2.5. Glucose tolerance test (IPGTT)
All rats were fasted overnight and treated with 2 g/kg glucose (i.p.). Tail vein blood was collected at 0, 15, 30, 60, 90, and 120 min after glucose bolus injection.
2.6. Stereotaxic surgeries
SD rats (320–340 g; pre-surgical body weight) were anesthetized by intraperitoneal injection of 2 mg/kg Xylazine (Rompun 2%, Provet AG, Lyssach, Switzerland) and 10 mg/kg BW Ketamin (Ketalar 50 mg/ml, Pfizer AG, Zurich, Switzerland) and positioned in the stereotaxic apparatus. Fluorogold (FG, Fluorochrome, LLC USA; 2.5% in PBS) was unilaterally injected into the PVH (1.8 mm caudal, 0.4 mm lateral to the bregma, and 7.7 mm ventral to dura) using a glass capillary micropipette connected with polyethylene (PE)-tubing to a microinjector (Picospritzer III, Parker Hannifin, Hollis, USA). All FG injected rats (n = 4) were implanted with intraperitoneal catheters for subsequent drug injections. Similarly, DSAP (Advanced Targeting Systems, San Diego, USA; 42 ng/200 nl in phosphate buffer, pH 7.4) or equimolar concentrations of unconjugated saporin were bilaterally injected into the PVH of 27 male SD rats. DSAP (n = 17) or SAP (n = 10) injected rats were implanted with jugular vein catheters for blood sampling. Previous studies [25], [32] indicated that 2 weeks is adequate for the transport of the immunotoxin and degeneration of the affected neurons following the injection; therefore, behavioral and metabolic effects were assessed beginning approximately 3 weeks following DSAP injections.
2.6.1. 2DG test
To verify the lesion, a glucoprivic feeding test was performed using 2-deoxy-d-glucose (2DG, Sigma, 200 mg/kg, s.c.). Rats were injected with 2DG or saline before dark onset. Food intake was measured 4 h following the injection. Rats showing 30% increase in food intake (2DG-induced hyperphagia in SAP group) were eliminated from the analysis in DSAP group.
2.6.2. Food intake measurements
On the day of the experiment, all SAP and DSAP rats were fasted for 4 h and received either Ex-4 (0.3 and 1.0 μg/kg, i.p.) or saline at dark onset (within-subjects design). Food intake was measured at 1, 2, 4, and 24 h after drug infusion.
2.6.3. Gastric emptying
For one week prior to the experiment, rats were adapted to a restricted feeding schedule: a test meal (4 g chow) was given at the beginning of the dark phase, and food access was only allowed for 5 h during the middle of dark phase. On experimental days, all SAP and DSAP rats received either Ex-4 (1.0 μg/kg, i.p.) or saline and were given a 4 g test meal containing 1% (w/w) paracetamol (4-acetamido-phenol, Sigma–Aldrich, Cat # P0300000) and 0.25% (w/w) saccharin (Sigma–Aldrich). Tail vein blood was taken 30 min prior to dark onset and 20, 40, 60, 90, 120 and 180 min after test meal onset with pre-coated EDTA micro-cuvettes (SARSTEDT, Nümbrecht Germany, Cat # 444100), immediately placed on wet ice, centrifuged, and stored at −20 °C until measurement of paracetamol concentrations with a commercial kit (Cambridge Life Sciences, Ely, England K8002) adapted for a multiwell plate reader (Synergy MX, BioTek, Winooski, VT, USA).
2.6.4. Blood sampling
Blood sampling was performed during the light phase. After 3 h fasting, Ex-4 (1.0 μg/kg BW) or saline was then infused through the intraperitoneal catheters and blood samples were collected at 15, 30, 60, and 120 min after infusion with pre-coated EDTA micro-cuvettes.
2.7. Plasma analysis
Corticosterone was measured using a commercially available corticosterone ELISA kit (AssayPro, St. Charles, MO, USA) according to the manufacturer's protocol. Glucose levels were analyzed by Cobas MIRA autoanalyzer (Hoffman LaRoche, Basel, Switzerland). Insulin and leptin levels were measured by using a Multi-Array Mouse/Rat Insulin and Leptin kit (Meso Scale Discovery, Gaithersburg, USA).
2.8. Animal perfusion and histology
To detect c-Fos induced by peripheral Ex-4 treatment, rats were fasted for 3 h and injected with Ex-4 (1.0 μg/kg, i.p., 3 μg, i.c.v.) or saline before the dark onset. Ninety min after administration, rats were deeply anesthetized with pentobarbital (100 mg/kg i.p., Cantonal pharmacy, Zurich, Switzerland) and perfused transcardially with 0.9% saline, followed by 4% paraformaldehyde (pH 7.4). The brains were removed, postfixed for at least 6 h, switched to PBS (0.1 M, pH 7.2) solution containing 25% glucose, and then snap frozen in dry ice. SDA brain tissue was generously provided by M. A. Labouesse, ETH Zurich [19]. Brains were then sectioned at 25 μm using a freezing sliding microtome and stored in a cryoprotectant solution at −20 °C until further processing. For c-Fos immunohistochemistry, sections were incubated with rabbit anti-c-Fos antibody (1:5,000; Santa Cruz Biotechnology, Santa Cruz, CA, Cat # SC-52) in blocking buffer for 48 h. After incubation, the tissue was rinsed in PBS, incubated in biotinylated donkey anti-rabbit IgG (1: 1,000; Jackson ImmunoResearch, West Grove, PA, Cat # 715-065-151) in PBS with 0.3% Triton X-100 (PBST) for 1 h, and then washed and incubated in avidin-biotin solution (vectastain; Vector Laboratories, Burlingame, CA, Cat # PK-6100) for 1 h c-Fos immunoreactivity was visualized with 3,3′-diaminobenzidine (DAB, Sigma, Cat # D12384) enhanced with nickel chloride. Sections were then mounted on gelatin-coated slides, dehydrated in an increasing series of alcohols, defatted in xylene, and coverslipped with permount (Fisher Scientific, USA, Cat # SP15-500). For fluorescent staining of c-Fos, DBH, and FG, tissue sections were incubated in c-Fos antibody (as described above) and 1: 3000 mouse anti DBH (Milipore Corporation, Tenecula, USA, Cat # MAB308), 1: 10,000 guinea pig anti FG (Protos Biotech Corp. Cat # NM-101) in PBST for 48 h at 4 C. The tissues were then rinsed and incubated in 1:1000 donkey anti-mouse Alexa Fluor 488 (In Vitrogen, Waltham, USA, Cat # A-21202), donkey anti-rabbit Alexa Fluor 568 (In Vitrogen, Cat # A- A10042), donkey anti-guinea pig Alexa Fluor 647 (Jackson ImmunoResearch, Cat # 706-605-148) For the verification of the DBH neuronal lesion, tissue sections were incubated with mouse anti-DBH antibody (1:10,000) and visualized with the DAB staining procedure described above.
2.9. Confocal imaging
Immunostained sections were imaged on a laser scanning confocal microscope (Leica TCS SP, Leica Microsystems, Inc., Bannockburn, IL) equipped with a 20× glycerol-corrected objective. All images of c-Fos (using a 488 nm AR laser), DBH (using a 561 nm DPSS laser), and FG (using a 633 nm HeNe laser) were taken at 1 μM increments along the z-axis of the tissue. Each wavelength was imaged sequentially to avoid bleed-through of different fluorophores. The stacks of individual optical slices were analyzed using the Image J software to determine co-localization. The confocal images are presented as projections of stacks of optical images. The brightness and contrast of the images were adjusted in Photoshop to match microscopic visualization (Adobe Systems Inc., San Jose, CA).
2.10. Gene expression analysis
SAP and DSAP rats were injected with Ex-4 (1 μg/kg, i.p.) or saline and were decapitated 30 min post injection. Brains were then collected and frozen in liquid nitrogen and stored at −80 °C for RNA extraction. NTS, ARC, and PVH areas were mircropunched using anatomical landmarks and RNA was extracted using Trizol (Life Technologies) according to the manufacturer's protocol. RT-qPCR was performed using SYBR green on a OneStep Plus Real Time PCR instrument (Applied Biosystems) and results were analyzed using the 2ddCt method (all primer sequences available upon request).
2.11. Statistical analysis
Data were analyzed by a Student's t-test for unpaired normally distributed values of equal variance using GraphPad Prism (version 6.05 for Windows). Where the dependent variable was affected by two or more factors, the data were analyzed with ANOVA. When the main effect or interaction terms were significant, post-hoc analyses using the Bonferroni correction were performed. Energy expenditure was also analyzed by a full factorial analysis of covariance, with the body weight as covariate, using IBM SPSS statistics version 22. Data are presented as means ± SEM. p-values < 0.05 were considered significant. All graphs were generated using GraphPad Prism (version 6.05 for Windows).
3. Results
3.1. Acute HPA axis suppression increases the anorexigenic effect of Ex-4
To test the role of the HPA axis in the Ex-4-induced eating inhibition, we used dexamethasone to suppress the HPA axis and corticosterone secretion. Dexamethasone (DXM, 50 μg/kg, s.c.) was administered 90 min prior to Ex-4 (1 μg/kg, i.p.) at dark onset, followed by a series of blood samplings and food intake and body weight assessments at 24 h (Figure 1A). Dexamethasone rapidly reduced plasma corticosterone levels compared to vehicle and Ex-4 alone (p < 0.01, Figure 1B). With ad-libitum feeding, Ex-4 (1 μg/kg, i.p.) did not stimulate an acute (<2 h) increase in plasma corticosterone. Ex-4, however, further reduced circulating corticosterone in the dexamethasone treated group compared to vehicle at 24 h (p < 0.005, Figure 1C). Similarly, only dexamethasone and Ex-4 co-treatment resulted in a significant reduction in 24 h food intake compared to vehicle (p < 0.01, Figure 1D), suggesting that dexamethasone increases the potency of Ex-4 to inhibit eating. Dexamethasone reduced body weight at 24 h (p < 0.0001), and co-treatment with Ex-4 did not further decrease body weight (p < 0.0001, Figure 1E) despite the lower food intake. Dexamethasone increased plasma leptin levels compared to vehicle and Ex-4 alone (p < 0.001, Figure 1F). There was, however, no difference in 24 h plasma leptin levels and insulin levels among the treatment groups (Supplemental Figure 1A–C). Further, dexamethasone and Ex-4 independently reduced the respiratory exchange ratio (RER) (DXM p < 0.001, Ex-4 p < 0.01), and the drug combination augmented this effect over 24 h (DXM + Ex-4 vs. PBS + PBS p < 0.001, Figure 1G). There was no significant effect of dexamethasone and/or EX-4 treatment on overall energy expenditure (EE, Figure 1H). Together, these data demonstrate that the HPA axis suppression by dexamethasone augmented the anorexigenic effect of Ex-4 without affecting EE.
Figure 1.

Dexamethasone increases the acute anorexigenic effect of Ex-4. The treatment groups are labeled PBS + PBS (n = 6), PBS + Ex-4 (n = 6), DXM + PBS (n = 6), and DXM + Ex-4 (n = 6). (A) The experimental paradigm. Dexamethasone (DXM, 50 μg/kg, s.c.) was administered 90 min (−1.5 h) prior to Ex-4 (1 μg/kg, i.p.) treatment at dark onset (0) in rats fed standard chow diet. (B) Plasma corticosterone level was measured at −1.5, 0 (dark onset), 0.5, 1, 2, 4 h post injection. Drug effect: DXM p < 0.01, multiple ANOVA (DXM × Ex-4 × Time). (C) 24 h plasma corticosterone levels. Drug effect: DXM p < 0.05, Ex-4 p < 0.005. Only DXM + Ex-4 group significantly reduced corticosterone compared to vehicle (p < 0.005, 2-way ANOVA). (D) 24 h food intake. Drug effect: DXM p < 0.05, Ex-4 p < 0.05. Only DXM + Ex-4 group significantly reduced food intake compared to vehicle (p < 0.01, 2-way ANOVA). (E) 24 h body weight change. Dexamethasone reduced body weight (p < 0.0001, 2-way ANOVA). (F) Dexamethasone-induced leptin secretion. Drug effect: DXM p < 0.001, multiple ANOVA (DXM × Ex-4 × Time). (G) 24 h respiratory exchange ratio (RER). DXM + Ex-4 treatment significantly reduced RER compared to vehicle (Dark: p < 0.001, Light: p < 0.05, Total: p < 0.001, 2-way ANOVA). (H) 24 h energy expenditure (heat production). Data are mean ± SEM. Different letters indicate a significant difference between the treatment groups after post-hoc Bonferroni-corrected comparisons (p < 0.05).
3.2. Chronic dexamethasone and Ex-4 treatment synergistically decreases food intake in diet-induced obese (DIO) rats
Next we hypothesized that dexamethasone and Ex-4 co-treatment should produce a greater appetite and weight reduction in DIO rats fed a 60% fat diet for 20 weeks. Ex-4 (3 ug/kg BW, s.c.) alone reduced daily food intake (PBS + Ex-4, 0.11 ± 0.001 kcal/BW, p < 0.0001) and lowered cumulative food intake for 14 days (p < 0.005) compared to vehicle, whereas dexamethasone (5 ug/kg BW, s.c.) had no effect on food intake (Figure 2A and B). Once daily co-treatment of dexamethasone and Ex-4 had a synergistic effect (DXM + Ex-4, 0.09 ± 0.002 kcal/BW, p < 0.0001, DXM × Ex-4 interaction p < 0.05) on average daily food intake (Figure 2B). Weight loss was relatively mild in the Ex-4 (PBS + Ex-4, 1.5 ± 0.3%, p < 0.0001) and dexamethasone (DXM + PBS, 2.9 ± 0.6%, p < 0.0001) groups compared to vehicle (Figure 2C and D). Similar to the effect on food intake, dexamethasone and Ex-4 co-treatment for 14 days produced greater body weight loss (DXM + Ex-4, 6.9 ± 0.6%, p < 0.0001), suggesting that the reduction in food intake is a major contributor to the weight loss. Ex-4 treatment at dark onset reduced RER in the dark phase (p < 0.0001), but there was no significant effect on total RER and EE (Figure 2E and F). On the other hand, dexamethasone briefly increased EE after dark onset (1 h post injection, data not shown) but did not produce a lasting effect on either RER or EE (Figure 2E and F). There was no significant effect of dexamethasone and Ex-4 co-treatment on total RER and EE compared to vehicle. Plasma corticosterone level after 14 days was not different among the treatment groups (Figure 2G). Furthermore, there was no significant difference in the mean post-mortem thymus and adrenal gland weights between treatment groups (Supplemental Table 1). Interestingly, fasting leptin level was significantly higher after chronic dexamethasone treatment compared to vehicle (p < 0.05), whereas it was unchanged when dexamethasone was combined with Ex-4 (Figure 2H). In addition, dexamethasone treated rats were more glucose intolerant during an IPGTT compared to vehicle (p < 0.05), but the co-treatment with Ex-4 prevented this effect (Figure 3A and B). Similarly, Ex-4 prevented dexamethasone-induced hyperinsulinemia (p < 0.05, Figure 3C and D). Taken together, these data demonstrate that dexamethasone and Ex-4 co-treatment increases the efficacy of Ex-4 to reduce body weight in DIO rats mainly via a reduction in food intake, importantly, without the negative consequences of dexamethasone on metabolic parameters.
Figure 2.

Chronic dexamethasone and Ex-4 co-treatment has a synergistic effect on food intake in DIO rats. DIO rats (fed HFD for 20 weeks) received drug (DXM 5 ug/kg, s.c. and/or Ex-4 3 ug/kg, s.c.) treatments at the dark onset for 14 consecutive days. The treatment groups are labeled PBS + PBS (n = 6), PBS + Ex-4 (n = 6), DXM + PBS (n = 6), and DXM + Ex-4 (n = 6). (A) Cumulative food intake (kcal/BW) for 14 days. (B) Average daily food intake (kcal/BW) during 14 days. The co-treatment had a synergistic effect on food intake (DXM × Ex-4 interaction p < 0.05, 2-way ANOVA). (C) Body weight change (% of pre-treatment body weight) during daily drug treatments. (D) Body weight change after 14 days. Both Ex-4 and dexamethasone caused body weight loss and the co-treatment augmented this effect (PBS + Ex-4 vs. DXM + Ex-4 p < 0.0001; DXM + PBS vs. DXM + Ex-4 p < 0.0001, 2-way ANOVA). (E) Respiratory exchange ratio (RER). (F) Energy expenditure (EE). (G) Plasma corticosterone levels. (H) Plasma leptin levels after overnight fasting. Dexamethasone alone increased leptin level compared to vehicle (p < 0.05, 2-way ANOVA). Data are mean ± SEM. Different letters indicate a significant difference between the treatment groups after post-hoc Bonferroni-corrected comparisons (p < 0.05).
Figure 3.

Ex-4 prevents dexamethasone-induced glucose intolerance. (A) Blood glucose level during an IPGTT. (B) Area under curve (AUC) for glucose. Dexamethasone alone increased glucose level compared to vehicle (p < 0.05, 2-way ANOVA), but Ex-4 prevented this effect. (C) Plasma insulin level during an IPGTT. * indicates elevated fasting insulin level in DXM + PBS group (p < 0.01, 2-way ANOVA). (D) Area under curve for insulin. Dexamethasone alone increased insulin level compared to vehicle (p < 0.05, 2-way ANOVA), but Ex-4 prevented this effect. Data are mean ± SEM. Different letters indicate a significant difference between the treatment groups after post-hoc Bonferroni-corrected comparisons (p < 0.05).
3.3. Ex-4 activates hindbrain CA neurons projecting to the PVH
To understand the interaction between Ex-4 and the HPA-axis, we next investigated the central pathway mediating the HPA axis activation by Ex-4. Peripheral and central Ex-4 treatment (1 μg/kg, i.p. and 3 μg, i.c.v.) similarly increased c-Fos expression in DBH expressing VLM and NTS neurons (Supplemental Figure 2A–F). This DBH neuronal activation by Ex-4 in the NTS was partially attenuated by subdiaphragmatic vagal deafferentation (SDA, Supplemental Figure 2G and H), suggesting the involvement of both vagal and central GLP-1R in DBH neuronal activation. These CA neurons contribute to the maintenance of energy balance via projections to hypothalamic areas including the PVH and ARC [25], [33], [34], [35]. The retrograde tracer fluorogold (FG) was then injected into the PVH to trace hindbrain neurons that were co-labeled with c-Fos and DBH after Ex-4 treatment (1 μg/kg, i.p.). Fifty-eight % of FG labeled cells in the NTS expressed both DBH and c-Fos and 53% of triple labeled cells were seen in the VLM (Table 1 and Supplemental Figure 3A–H). Our results indicate that peripheral Ex-4 treatment activates hindbrain CA neurons projecting to the PVH via vagal and central GLP-1R.
Table 1.
FG labeled cells are co-localized with DBH and c-Fos after Ex-4 treatment.
| 3 sections/animal | mNTS (n = 3) | VLM (n = 3) |
|---|---|---|
| # of FG-IR | 32.6 ± 4.6 | 33.6 ± 6.7 |
| # of FG/Fos-IR | 21.6 ± 2.6 | 19.3 ± 5.6 |
| % of FG/Fos double labeling | 68.9 ± 11.5 | 55.9 ± 6.3 |
| # of FG/Fos/DBH | 18.3 ± 1.85 | 18.6 ± 6.1 |
| % of FG/Fos/DBH triple labeling | 58 ± 8.41 | 52.8 ± 7.8 |
Values represent estimates of mean ± SEM counts of cells.
3.4. DSAP lesion alters HPA axis activity and the anorexigenic response to Ex-4
To further investigate the role of CA neuronal activation in response to Ex-4 treatment, the neurotoxin DBH saporin (DSAP) or unconjugated saporin (SAP) was stereotaxically injected into the PVH to selectively target and ablate DBH neurons projecting to the PVH. Similar to previous findings, DSAP in the PVH was retrogradely transported, ablated the DBH cell bodies, and reduced the number of DBH neurons in the NTS (p < 0.005, Supplemental Figure 4A, C, E) and VLM (p < 0.0001, Supplemental Figure 4B, D, F). As a functional verification of the DBH neuronal lesion, 2DG treatment (300 mg/kg BW, s.c.) induced glucoprivic hyperphagia in SAP rats, but instead decreased 2 h food intake in DSAP rats (Supplemental Figure 4G). Next we measured the corticosterone response to peripheral Ex-4 treatment in DSAP lesioned rats. In the fasting condition, Ex-4 (1 μg/kg, i.p.) increased plasma corticosterone levels in SAP rats compared to vehicle (p < 0.05, Figure 4A). This immediate rise in plasma corticosterone following Ex-4 injection was attenuated in DSAP rats (Figure 4A and B), suggesting that the HPA axis response to Ex-4 during fasting was compromised due to the hindbrain DBH neuronal lesion. Unlike the attenuated corticosterone response in DSAP rats, plasma glucose levels were similar in SAP and DSAP rats after Ex-4 injections (p < 0.05, p < 0.05, respectively, Figure 4C and D). This indicates that separate CA neurons projecting to the spinal cord were unaffected by DSAP and increased glucose levels via activation of a sympathomedullary pathway. Surprisingly, Ex-4 treatment (1 μg/kg, i.p.) caused a substantial short-term inhibition of eating in DSAP rats compared to that of SAP rats (p < 0.005, Figure 4E and F). Ex-4 treatment is also known to inhibit gastric emptying, which contributes to Ex-4-induced satiation. Gastric emptying was indeed slower in DSAP rats after Ex-4 treatment compared to SAP rats, indicating that CA neurons are also involved in the inhibiting effect of Ex-4 on gastric emptying (Figure 4G and H).
Figure 4.

DSAP lesion attenuates Ex-4 mediated corticosterone secretion but augments its anorexigenic effect. The experimental groups are labeled SAP-Veh (n = 4), SAP-Ex-4 (n = 4), DSAP-Veh (n = 5), and DSAP-Ex-4 (n = 5). (A) Plasma corticosterone level after Ex-4 (1 μg/kg, i.p.) treatment. (B) Area under curve analysis for corticosterone. Ex-4 transiently increased corticosterone in SAP rats but not in DSAP rats (SAP-Veh vs. SAP-Ex-4 p < 0.05, 2-way ANOVA). (C) Plasma glucose level after Ex-4 (1 μg/kg, i.p.) treatment. (D) Area under curve analysis for glucose. Ex-4 treatment increased glucose in both SAP and DSAP rats (p < 0.05, p = 0.05, respectively. 2-way ANOVA). (E) Food intake measurements after Ex-4 (1 μg/kg, i.p.) treatment. SAP-Veh (n = 7), SAP-Ex-4 (n = 7), DSAP-Veh (n = 12), and DSAP-Ex-4 (n = 12). (F) 1 h Food intake reduction after Ex-4 (% relative to vehicle) in SAP and DSAP rats (SAP vs. DSAP p < 0.005, Student's t-test.). (G) Plasma paracetamol concentration after Ex-4 (1 μg/kg, i.p.) treatment. (H) The appearance of paracetamol in the plasma at 1 h after Ex-4 treatment in SAP and DSAP rats. Drug effect (p < 0.05), Lesion effect (p < 0.05), 2-way ANOVA. Data are mean ± SEM. Different letters indicate a significant difference between the treatment groups after post-hoc Bonferroni-corrected comparisons (p < 0.05).
3.5. DBH neuronal ablation alters brain responses to Ex-4
Consistent with previous findings, Ex-4 (1 μg/kg, i.p.) increased the number of c-Fos expressing cells in the NTS (p < 0.05, Figure 5A and B) and PVH (p < 0.05, Figure 6A and B). In DSAP lesion rats, the c-Fos expression induced by Ex-4 was attenuated in the NTS (Figure 5C–E), indicating that the DBH neuronal lesion reduced the number of NTS cells responding to Ex-4. As expected from the lesion, NTS DBH mRNA expression was significantly lower in DSAP rats (p < 0.001), whereas NTS NPY mRNA was unaffected by either lesion or drug (Figure 5F and G). Interestingly, there was a trend toward a decrease in preproglucagon (PPG) gene expression in the NTS of SAP rats (p = 0.06), but this trend was not observed in DSAP rats (Figure 5H). In the PVH, c-Fos expression in the magnocellular and parvocellular divisions of the PVH was abolished in DSAP rats (Figure 6C–F). Ex-4 suppressed corticotropin-releasing hormone (CRH) mRNA in DSAP rats (p < 0.05) but not in SAP rats (Figure 6H). Neither lesion nor drug affected thyrotropin-releasing hormone (TRH) and oxytocin mRNA expression in the PVH (Figure 6G and I). Ex-4 had little effect, however, on the number of c-Fos positive cells in the ARC in either SAP or DSAP rats (Figure 7A–E). On the other hand, the number of c-Fos positive cells was affected by the lesion itself and was higher in the ARC of DSAP rats than in SAP rats (p < 0.05, Figure 7E). This increase in c-Fos was localized in β-endorphin positive neurons, indicating that the DSAP lesion resulted in a tonic activation of proopiomelanocortin (POMC) expressing cells (Figure 7C, D, and F). Ex-4 treatment did not affect POMC mRNA expression (Figure 7G), but decreased neuropeptide Y (NPY, drug effect p < 0.001, Figure 7H) and agouti-related peptide (AgRP, drug effect p < 0.0001, Figure 7I) mRNA. Ex-4, however, significantly decreased NPY gene expression in DSAP rats (p < 0.005) but not in SAP rats, raising the possibility that Ex-4 and corticosterone may interact in the ARC neurons.
Figure 5.

DSAP lesion alters neuronal and transcriptional responses to Ex-4 in the NTS. NTS c-Fos activation in the SAP-Veh (A), SAP-Ex-4 (B), DSAP-Veh (C), and DSAP-Ex-4 (D). (E) C-Fos positive cell counts in the mNTS. Ex-4 (1 μg/kg, i.p.) increased c-Fos activation in the SAP (p < 0.01, 2-way ANOVA), but not in the DSAP group. (F) DBH mRNA expression is decreased in the DSAP group compared to SAP (p < 0.001, 2-way ANOVA). (G) NPY mRNA expression. (H) PPG mRNA expression shows a trend toward a decrease in the SAP after Ex-4 (p = 0.06) but not in the DSAP group. Data are means ± SEM. Different letters indicate a significant difference between the treatment groups after post-hoc Bonferroni-corrected comparisons (p < 0.05). mNTS: medial nucleus tractus solitarii, DBH: dopamine-β-hydroxylase, NPY: neuropeptide Y, PPG: preproglucagon, 10× bright field images. Scale bars = 100 μm.
Figure 6.

DSAP lesion alters neuronal and transcriptional responses to Ex-4 in the PVH. PVH c-Fos activation in the SAP-Veh (A), SAP-Ex-4 (B), DSAP-Veh (C), and DSAP-Ex-4 (D). (E) C-Fos positive cell counts in the PVHm. Ex-4 increased c-Fos activation in the SAP (p < 0.05, 2-way ANOVA), but not in the DSAP group. (F) C-Fos positive cell counts in the PVHp. Ex-4 increased c-Fos activation in the SAP (p < 0.05, 2-way ANOVA) but not in the DSAP group. No change was observed for TRH (G) and Oxytocin (I) mRNA expression, but CRH mRNA expression (H) was decreased in the DSAP group after Ex-4 (p < 0.01, 2-way ANOVA). Data are means ± SEM. Different letters indicate a significant difference between the treatment groups after post-hoc Bonferroni-corrected comparisons (p < 0.05). PVHm: paraventricular nucleus, magnocellular, PVHp: paraventricular nucleus, parvocellular. TRH: thyrotropin-releasing hormone, CRH: corticotropin-releasing hormone. 10× bright field images. Scale bars = 100 μm.
Figure 7.

DSAP lesion alters neuronal and transcriptional responses to Ex-4 in the ARC. ARC c-Fos (red) and β-endorphin (green) labeling in the SAP-Veh (A), SAP-Ex-4 (B), DSAP-Veh (C), and DSAP-Ex-4 (D). (E) C-Fos positive cell counts in the mARC. DSAP lesion increased c-Fos activation in the ARC (Lesion effect p < 0.05). (F) DSAP lesion increased c-Fos activation in β-endorphin positive neurons in the ARC (Lesion effect p < 0.0005, 2-way ANOVA). (G) No change in POMC mRNA expression. (H) Ex-4 (1 μg/kg, i.p.) decreased NPY mRNA expression in the DSAP group (p < 0.005, 2-way ANOVA), but not in the SAP. (I) Ex-4 decreased AgRP mRNA in both SAP (p < 0.005) and DSAP (p < 0.0005) group. 2-way ANOVA analysis. Data are means ± SEM. Different letters indicate a significant difference between the treatment groups after post-hoc Bonferroni-corrected comparisons (p < 0.05). mARC: medial arcuate nucleus, POMC: proopiomelanocortin, NPY: neuropeptide Y, AgRP: agouti-related peptide. 20× confocal images. Scale bars = 100 μm.
4. Discussion
GLP-1R agonist treatment exerts multiple effects beyond the well-known incretin and anorexigenic properties [36]. Recent reports demonstrate that peripheral and central GLP-1R agonist treatments increase sympathetic output and stimulate the HPA axis [28], [30], [37], [38], but the functional implications of this activation in the context of eating behavior are unclear. Here we show that the pharmacological suppression of the HPA axis by dexamethasone augmented the Ex-4-induced anorexia. Moreover, a prolonged Ex-4 treatment in combination with low dose dexamethasone produced synergistic reductions of food intake and body weight in DIO rats. We further demonstrate that the ability of peripheral GLP-1R agonist Ex-4 administration to stimulate corticosterone secretion involves hindbrain catecholamine (CA) neurons with ascending projections to the hypothalamus [23], [33], [39], [40]. Neurotoxin-induced lesions of this pathway indeed enhanced the anorexigenic effects of Ex-4 when corticosterone availability was limited. Our data support the idea that endogenous corticosterone, presumably by a central action, reduces the anorexigenic effect of Ex-4. This has important clinical implications for GLP-1R agonist-based drug development and therapy.
We first assessed the interaction between GLP-1 and the HPA axis by acutely administering dexamethasone in combination with Ex-4. Dexamethasone suppresses corticosterone secretion by primarily acting at the glucocorticoid receptor in the pituitary [41]. It also increases leptin secretion which is linked to dexamethasone-induced weight loss [42], [43]. While the combination of Ex-4 with dexamethasone and dexamethasone alone similarly reduced body weight in 24 h, Ex-4 and dexamethasone co-treatment had a more potent anorexigenic effect than either drug alone. After dexamethasone treatment, the level of systemic corticosterone was negatively correlated with Ex-4's anorexigenic effect. It is important to note that dexamethasone, at the dose we used here, differs from corticosterone in two ways. Its entry into the brain is very limited by P-glycoprotein expression in the blood brain barrier (BBB), and it only modestly increases glucocorticoid action in the periphery [41], [44]. Thus, because corticosterone signaling through CNS glucocorticoid receptor stimulates food intake [45], [46], the brain hypocorticoid condition elicited by low dose dexamethasone should reduce this orexigenic action, thereby allowing Ex-4 to exert its full anorexigenic effect.
We show that dexamethasone treatment for 14 days at a low dose (1/10 compared to the acute experiment) resulted in a sustained body weight loss without a change in food intake in DIO rats. On the other hand, chronic Ex-4 treatment produced a sustained food intake reduction, which seems to be the major underlying cause of the observed weight loss [47]. When combined, dexamethasone and Ex-4 produced synergistic effects on food intake and body weight, but the mechanisms underlying these effects are unclear. Unlike the acute dexamethasone administration in lean rats, chronic dexamethasone treatment did not result in a reduction of plasma corticosterone in DIO rats. This may be due to an adaptive mechanism to restore HPA activity in response to prolonged dexamethasone exposure. Since we did not extensively assess the HPA axis response to the drug treatment, it is difficult to conclude that chronic dexamethasone-induced HPA suppression potentiated the anorexigenic effect of Ex-4. Based on our data, it is possible that Ex-4 potentiates dexamethasone-induced weight loss by suppressing food intake and preventing hyperleptinemia and hyperinsulinemia. Although the mechanisms remained unanswered, we demonstrated the potential interaction between glucocorticoid and GLP-1 signaling in the control of food intake in DIO rats, which prompts further studies to characterize the mechanisms underlying this effect in this and other models of obesity.
Dexamethasone has potent anti-inflammatory and immunosuppressive properties [48]. Prolonged exposure to dexamethasone is also known to induce hyperglycemia, insulin resistance, and, eventually, a condition known as “steroid diabetes” in rodents and man [49], [50]. We also demonstrate that chronic dexamethasone treatment at low dose is sufficient to increase circulating leptin, and induce more severe glucose intolerance in DIO rats. When combined with Ex-4, however, these metabolic parameters were undistinguishable from vehicle treatment, suggesting that Ex-4 can prevent dexamethasone-induced diabetes. Recent studies showed that liragluitide and Ex-4 treatments counteract obesity and glucose intolerance caused by excess glucocorticoid [51], [52], [53]. These anti-obesity and anti-diabetes effects may be related to the positive effects of GLP-1R agonists on β-cell mass and function, but, according to our findings, they may also lie in the potential interaction between GLP-1 and glucocorticoids, resulting in a greater anorexigenic response. Further studies are necessary to determine whether dexamethasone and Ex-4 co-treatment (different doses and frequencies) can improve the metabolic syndrome in addition to causing weight loss.
Our DSAP experiments clearly demonstrate that corticosterone secretion induced by peripheral Ex-4 treatment requires intact catecholamine (CA) neuronal projections to the hypothalamus. CA neurons are highly responsive to hindbrain glucose sensing mechanisms and will elicit glucoregulatory responses that increase glucose production and food intake when glucose availability is reduced [22], [23]. In particular, A1/C1 (VLM) and A2/C2 (NTS) cell groups projecting to the PVH have been well characterized for the HPA axis activation and corticosterone secretion in response to glucoprivation [25], [32], [54]. NTS and VLM neurons may express GLP-1R [13], [15], but a direct activation of these CA neurons by peripheral GLP-1R agonist treatment is unlikely. Because the AP is the only area in the hindbrain accessible to peripherally injected liraglutide [17], it seems more likely that the activation of NTS and VLM neurons is indirectly mediated by GLP-1R activation in the AP. The abdominal vagus nerve expresses GLP-1R and is another route for the peripheral GLP-1R agonists to activate hindbrain CA neurons [55]. Although the vagus nerve is essential for relaying endogenous GLP-1 signals to the hindbrain [6], we recently demonstrated that NTS neuronal activation by peripheral Ex-4 treatment is not reduced by SDA [19], thereby negating a major role for the vagus nerve in mediating the effects of peripheral Ex-4 treatments. Indeed, NTS c-FOS/DBH co-localization in response to a pharmacological dose of Ex-4 was only attenuated by SDA, reiterating that different mechanisms mediate the actions of endogenous GLP-1 and the pharmacological effects of GLP-1R agonists [7].
Our data further demonstrate that the lesion of CA neurons altered the glucocorticoid feedback mechanism for the hindbrain PPG neurons. PPG neurons in the NTS produce GLP-1 and are activated by multiple nutrient/interoceptive signals including leptin and CCK [56], [57], [58], [59], [60]. Interestingly, PPG mRNA expression is rapidly and transiently decreased by glucocorticoid stress responses [61]. In the present study, an Ex-4-induced inhibition of PPG mRNA expression was not observed after DSAP lesion which was paralleled by an impaired HPA response to Ex-4, consistent with the idea that HPA axis activation inhibits central GLP-1 production. Also, DSAP injection into the PVH significantly reduced the neuronal activation in the PVH and the NTS, demonstrating that PVH neuronal activation by Ex-4 requires intact CA neurons in the hindbrain. Unlike insulin and 2DG, which require CA input to the PVH to increase CRH expression [62], Ex-4 treatment did not increase PVH CRH mRNA levels in SAP rats in our experimental paradigm. Instead, Ex-4 inhibited CRH mRNA, and this inhibition was more pronounced in the DSAP lesion group. Regardless of this discrepant finding of CRH expression, our data provide neurochemical evidence for the altered HPA axis activity and low corticosterone levels in response to Ex-4 in the DSAP model. Loss of CA neuronal inputs to the PVH also disrupts the collateral innervation to the ARC and increased αMSH-ir fibers to the PVH [35], suggesting that CA inputs to the hypothalamus are critical for the normal hypothalamic neurocircuitry. We observed a similar phenomenon in that DSAP injection into the PVH increased basal c-Fos activation in ARC POMC cells. Although the mechanisms underlying these changes are unknown, hindbrain CA projections to the ARC may also contribute to glucoprivic eating by providing inhibitory signals to the POMC neurons, preventing the release of αMSH at the axon terminals in the PVH. Therefore, increased melanocortin signaling in the hypothalamus may contribute to the enhanced inhibition of food intake and gastric emptying seen in DSAP rats in response to Ex-4. In addition to the enhanced melanocortin tone, the inhibitory effect of Ex-4 on ARC NPY gene expression was greater with DSAP lesions, which could be attributed to a reduced availability of corticosterone in the brain. In contrast to Ex-4, circulating corticosterone stimulates ARC NPY gene transcription [47], [63], [64]. Therefore, Ex-4 and corticosterone may affect eating through opposing actions on NPY expression in the ARC. Because DSAP lesions and dexamethasone treatment both reduce central corticosterone availability, this balance may tip in favor of Ex-4's ability to promote a negative energy balance.
5. Conclusion
GLP-1 based drugs are one of the leading treatment options for obesity and diabetes [65], [66]. Multiple GLP-1 analogs with different pharmacokinetics and pharmacodynamics are currently available in the clinic, and GLP-1 combinational pharmacology (co-administration or single molecule fusion) is being tested in clinical settings [66]. The mechanisms underlying the anorexigenic effect of GLP-1R agonists are, however, still elusive, because these GLP-1 analogs activate complex neural pathways and generate autonomic and neuroendocrine responses, all of which contribute to the behavioral outcomes. Here we propose that glucocorticoid counteracts the anorexigenic effects of GLP-1R agonist treatment. Our findings with low dose dexamethasone and lesion approaches support the novel concept that the potency of Ex-4 as an anorexigenic drug is inversely related to glucocorticoid secretion (Figure 8). Therefore, manipulating glucocorticoid receptor mechanisms will be of interest for the future design of GLP-1-based therapies.
Figure 8.
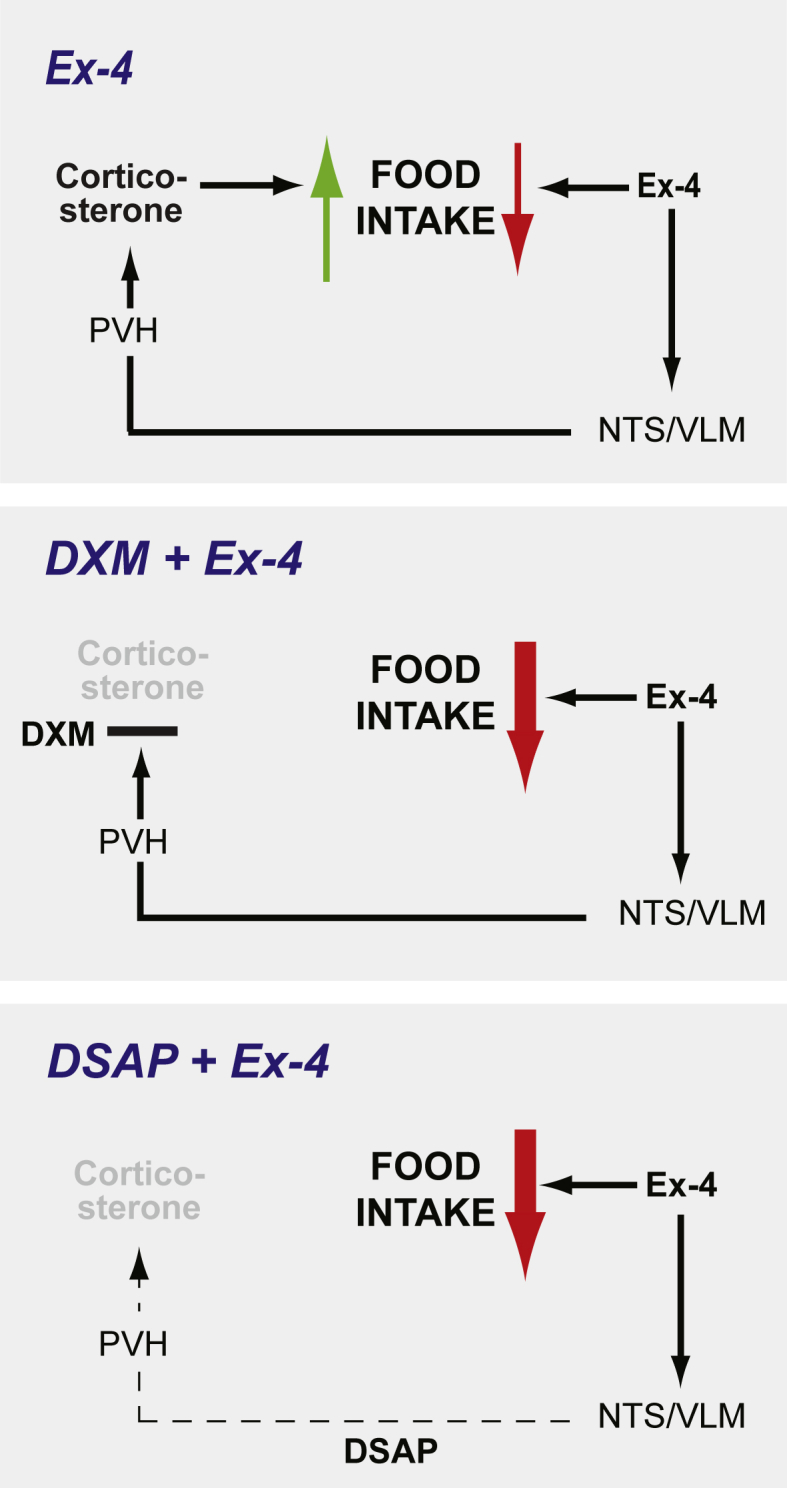
A proposed interaction between Ex-4 and corticosterone in the control of food intake. Top panel: The anorexigenic effect of Ex-4 is opposed by a simultaneous increase in orexigenic corticosterone action in the CNS. Ex-4 increases corticosterone secretion by activating hindbrain CA neurons projecting to the PVH. Middle panel: Reduced corticosterone secretion by a negative feedback inhibition using dexamethasone increases the anorexigenic effect of Ex-4. Low panel: Reduced corticosterone secretion by ablating the CNS CA pathway using DSAP lesion increases the anorexigenic effect of Ex-4.
Acknowledgements
We thank the laboratory members, especially, Dr. Rosmarie Clara, Shahana Fedele, and Marie Rouault for their help during the experiments. The authors also thank the Center for Microscopy and Image Analysis, University of Zurich for assisting the image acquisition. This work was supported by Swiss National Science Foundation (SNSF) Marie Heim-Voegtlin (MHV) grant PMPDP3_151360 (SJL), Eidgenössische Technische Hochschule Zürich Research Grant 47 12-2 (WL and SJL), and NIH/NINDS NS029728 (AGW).
Footnotes
Supplementary data related to this article can be found at http://dx.doi.org/10.1016/j.molmet.2016.04.008.
Conflict of interest
The authors declare no competing financial interests.
Appendix A. Supplementary data
The following are the supplementary data related to this article:
Supplemental Figure 1.

Acute drug effects on leptin and insulin secretion in chow fed rats. The treatment groups are labeled PBS + PBS (n = 6), PBS + Ex-4 (n = 6), DXM + PBS (n = 6), and DXM + Ex-4 (n = 6). (A) Plasma leptin levels after 24 h post injection. (B) Plasma insulin level was measured at −1.5, 0 (dark onset), 0.5, 1, 2, 4 h post injection. (C) Plasma insulin levels after 24 h post injection. Data are mean ± SEM, and statistical analyses are performed using 2-way ANOVA, with Bonferroni post-hoc analyses applied.
Supplemental Figure 2.

Ex-4 activates NTS DBH neurons via central and peripheral mechanisms. (A) Ex-4 (1 μg/kg, i.p.) increased c-Fos (red) activation in the NTS. (B) DBH (green) positive neurons in the NTS. (C) c-Fos and DBH co-localization indicated by white arrows. (D) Ex-4 (0.3 μg, i.c.v.) increased c-Fos (red) activation in the NTS. (E) DBH (green) positive neurons in the NTS. (F) c-Fos and DBH co-localization indicated by white arrows. (G) Ex-4 (1 μg/kg, i.p.) increased c-Fos activation in the NTS in both sham (n = 5, p < 0.0005) and SDA rats (n = 5, p < 0.001). 2-way ANOVA analysis. (H) Ex-4 increased the number of c-Fos activation in DBH positive neurons in sham rats (p < 0.01), but not in the SDA rats (p = 0.054). 2-way ANOVA analysis. Data are mean ± SEM. Different letters indicate a significant difference between the treatment groups after post-hoc Bonferroni-corrected comparisons (p < 0.05). dNTS: dorsal nucleus tractus solitarii, mNTS: medial nucleus tractus solitarii, DMV: dorsal nucleus of vagus nerve. 20× confocal images. Scale bars = 100 μm.
Supplemental Figure 3.

Ex-4 activates hindbrain CA neurons projecting to the PVH. (A) c-Fos (red) activation in the medial NTS following Ex-4 treatment (1 μg/kg, i.p.). 10× confocal image (B) DBH antibody labeling (green) in the medial NTS. 10× confocal image. (C) Fluorogold (FG) antibody labeling (blue) in the medial NTS. 10× confocal image. (D) Magnified image of boxed area in A, B, and C showing the co-localization for c-Fos, DBH, and FG in the mNTS as indicated by white arrows. 20× confocal image. (E) Ex-4 increased c-Fos (red) activation in the VLM. 20× confocal image. (F) DBH (green) positive neurons in the VLM. 20× confocal image. (G) FG antibody labeling (blue) in the VLM. 20× confocal image. (H) The co-localization for c-Fos, DBH, and FG in the VLM as indicated by white arrows. 20× confocal image. AP: area postrema, dNTS: dorsal nucleus tractus solitarii, mNTS: medial nucleus tractus solitarii. VLM: ventrolateral medulla. Scale bars = 100 μm.
Supplemental Figure 4.

Anatomical and functional verification of DSAP lesion. DBH positive neurons in the mNTS (A) and VLM (B) in SAP injected rats. DBH positive neurons in the mNTS (C) and VLM (D) in DSAP injected rats. The quantification of DBH neuronal numbers in the mNTS (E) ( p < 0.005), and VLM (F) (p < 0.0001) after the lesion. Student's t-test analysis. (G) 2 h food intake measurements after 2DG (300 mg/kg BW, s.c.) injection in SAP (n = 10) and DSAP (n = 17) rats. 2-way ANOVA analysis with Bonferroni post-hoc analyses applied. Data are mean ± SEM. 10× bright field images. Scale bars = 200 μm.
References
- 1.Drucker D.J. Glucagon-like peptides. Diabetes. 1998;47(2):159–169. doi: 10.2337/diab.47.2.159. [DOI] [PubMed] [Google Scholar]
- 2.Holst J.J. Glucagonlike peptide 1: a newly discovered gastrointestinal hormone. Gastroenterology. 1994;107(6):1848–1855. doi: 10.1016/0016-5085(94)90831-1. [DOI] [PubMed] [Google Scholar]
- 3.Dhillo W.S., Bloom S.R. Gastrointestinal hormones and regulation of food intake. Hormone and Metabolic Research. 2004;36(11–12):846–851. doi: 10.1055/s-2004-826174. [DOI] [PubMed] [Google Scholar]
- 4.Gunn I., O'Shea D., Bloom S.R. Control of appetite–the role of glucagon-like peptide-1 (7-36) amide. The Journal of Endocrinology. 1997;155(2):197–200. doi: 10.1677/joe.0.1550197. [DOI] [PubMed] [Google Scholar]
- 5.Williams D.L., Baskin D.G., Schwartz M.W. Evidence that intestinal glucagon-like peptide-1 plays a physiological role in satiety. Endocrinology. 2009;150(4):1680–1687. doi: 10.1210/en.2008-1045. [DOI] [PMC free article] [PubMed] [Google Scholar]
- 6.Krieger J.P., Arnold M., Pettersen K.G., Lossel P., Langhans W., Lee S.J. Knockdown of GLP-1 receptors in vagal afferents affects normal food intake and glycemia. Diabetes. 2016;65(1):34–43. doi: 10.2337/db15-0973. [DOI] [PubMed] [Google Scholar]
- 7.Krieger J.P., Langhans W., Lee S.J. Vagal mediation of GLP-1's effects on food intake and glycemia. Physiology & Behavior. 2015 Dec 1;152(pt B):372–380. doi: 10.1016/j.physbeh.2015.06.001. [DOI] [PubMed] [Google Scholar]
- 8.Iepsen E.W., Torekov S.S., Holst J.J. Liraglutide for type 2 diabetes and obesity: a 2015 update. Expert Review of Cardiovascular Therapy. 2015;13(7):753–767. doi: 10.1586/14779072.2015.1054810. [DOI] [PubMed] [Google Scholar]
- 9.Ladenheim E.E. Liraglutide and obesity: a review of the data so far. Drug Design, Development and Therapy. 2015;9:1867–1875. doi: 10.2147/DDDT.S58459. [DOI] [PMC free article] [PubMed] [Google Scholar]
- 10.Prasad-Reddy L., Isaacs D. A clinical review of GLP-1 receptor agonists: efficacy and safety in diabetes and beyond. Drugs in Context. 2015;4:212283. doi: 10.7573/dic.212283. [DOI] [PMC free article] [PubMed] [Google Scholar]
- 11.Meier J.J. GLP-1 receptor agonists for individualized treatment of type 2 diabetes mellitus. Nature Reviews. Endocrinology. 2012;8(12):728–742. doi: 10.1038/nrendo.2012.140. [DOI] [PubMed] [Google Scholar]
- 12.Hamilton A., Holscher C. Receptors for the incretin glucagon-like peptide-1 are expressed on neurons in the central nervous system. Neuroreport. 2009;20(13):1161–1166. doi: 10.1097/WNR.0b013e32832fbf14. [DOI] [PubMed] [Google Scholar]
- 13.Merchenthaler I., Lane M., Shughrue P. Distribution of pre-pro-glucagon and glucagon-like peptide-1 receptor messenger RNAs in the rat central nervous system. The Journal of Comparative Neurology. 1999;403(2):261–280. doi: 10.1002/(sici)1096-9861(19990111)403:2<261::aid-cne8>3.0.co;2-5. [DOI] [PubMed] [Google Scholar]
- 14.Pyke C., Heller R.S., Kirk R.K., Orskov C., Reedtz-Runge S., Kaastrup P. GLP-1 receptor localization in monkey and human tissue: novel distribution revealed with extensively validated monoclonal antibody. Endocrinology. 2014;155(4):1280–1290. doi: 10.1210/en.2013-1934. [DOI] [PubMed] [Google Scholar]
- 15.Cork S.C., Richards J.E., Holt M.K., Gribble M.K., Reimann F., Trapp S. Distribution and characterisation of glucagon-like peptide-1 receptor expressing cells in the mouse brain. Molecular Metabolism. 2015;4(10):718–731. doi: 10.1016/j.molmet.2015.07.008. [DOI] [PMC free article] [PubMed] [Google Scholar]
- 16.Sisley S., Gutierrez-Aguilar R., Scott M., D'Alessio D.A., Sandoval D.A., Seeley R.J. Neuronal GLP1R mediates liraglutide's anorectic but not glucose-lowering effect. The Journal of Clinical Investigation. 2014;124(6):2456–2463. doi: 10.1172/JCI72434. [DOI] [PMC free article] [PubMed] [Google Scholar]
- 17.Secher A., Jelsing J., Baquero A.F., Hecksher-Sorensen J., Cowley M.A., Dalboge L.S. The arcuate nucleus mediates GLP-1 receptor agonist liraglutide-dependent weight loss. The Journal of Clinical Investigation. 2014;124(10):4473–4488. doi: 10.1172/JCI75276. [DOI] [PMC free article] [PubMed] [Google Scholar]
- 18.Baraboi E.D., St-Pierre D.H., Shooner J., Timofeeva E., Richard D. Brain activation following peripheral administration of the GLP-1 receptor agonist exendin-4. American Journal of Physiology, Regulatory, Integrative and Comparitive Physiology. 2011;301(4):R1011–R1024. doi: 10.1152/ajpregu.00424.2010. [DOI] [PubMed] [Google Scholar]
- 19.Labouesse M.A., Stadlbauer U., Weber E., Arnold M., Langhans W., Pacheco-Lopez G. Vagal afferents mediate early satiation and prevent flavour avoidance learning in response to intraperitoneally infused exendin-4. Journal of Neuroendocrinology. 2012;24(12):1505–1516. doi: 10.1111/j.1365-2826.2012.02364.x. [DOI] [PubMed] [Google Scholar]
- 20.Yamamoto H., Lee C.E., Marcus J.N., Williams T.D., Overton J.M., Lopez M.E. Glucagon-like peptide-1 receptor stimulation increases blood pressure and heart rate and activates autonomic regulatory neurons. Journal Clinical Investigation. 2002;110(1):43–52. doi: 10.1172/JCI15595. [DOI] [PMC free article] [PubMed] [Google Scholar]
- 21.Yamamoto H., Kishi T., Lee C.E., Choi B.J., Fang H., Hollenberg A.N. Glucagon-like peptide-1-responsive catecholamine neurons in the area postrema link peripheral glucagon-like peptide-1 with central autonomic control sites. Journal of Neuroscience. 2003;23(7):2939–2946. doi: 10.1523/JNEUROSCI.23-07-02939.2003. [DOI] [PMC free article] [PubMed] [Google Scholar]
- 22.Ritter S., Dinh T.T., Li A.J. Hindbrain catecholamine neurons control multiple glucoregulatory responses. Physiology & Behavior. 2006;89(4):490–500. doi: 10.1016/j.physbeh.2006.05.036. [DOI] [PubMed] [Google Scholar]
- 23.Ritter S., Li A.J., Wang Q., Dinh T.T. Minireview: the value of looking backward: the essential role of the hindbrain in counterregulatory responses to glucose deficit. Endocrinology. 2011;152(11):4019–4032. doi: 10.1210/en.2010-1458. [DOI] [PMC free article] [PubMed] [Google Scholar]
- 24.Hudson B., Ritter S. Hindbrain catecholamine neurons mediate consummatory responses to glucoprivation. Physiology & Behavior. 2004;82(2–3):241–250. doi: 10.1016/j.physbeh.2004.03.032. [DOI] [PubMed] [Google Scholar]
- 25.Ritter S., Bugarith K., Dinh T.T. Immunotoxic destruction of distinct catecholamine subgroups produces selective impairment of glucoregulatory responses and neuronal activation. The Journal of Comparitive Neurology. 2001;432(2):197–216. doi: 10.1002/cne.1097. [DOI] [PubMed] [Google Scholar]
- 26.Sandoval D., Barrera J.G., Stefater M.A., Sisley S., Woods S.C., D'Alessio D.D. The anorectic effect of GLP-1 in rats is nutrient dependent. PLoS One. 2012;7(12):e51870. doi: 10.1371/journal.pone.0051870. [DOI] [PMC free article] [PubMed] [Google Scholar]
- 27.Perez-Tilve D., Gonzalez-Matias L., Aulinger B.A., Alvarez-Crespo M., Gil-Lozano M., Alvarez E. Exendin-4 increases blood glucose levels acutely in rats by activation of the sympathetic nervous system. American Journal of Physiology. Endocrinology and Metabolism. 2010;298(5):E1088–E1096. doi: 10.1152/ajpendo.00464.2009. [DOI] [PMC free article] [PubMed] [Google Scholar]
- 28.Gil-Lozano M., Perez-Tilve D., Alvarez-Crespo M., Martis A., Fernandez A.M., Catalina P.A. GLP-1(7-36)-amide and exendin-4 stimulate the HPA axis in rodents and humans. Endocrinology. 2010;151(6):2629–2640. doi: 10.1210/en.2009-0915. [DOI] [PubMed] [Google Scholar]
- 29.Korner M., Stockli M., Waser B., Reubi J.C. GLP-1 receptor expression in human tumors and human normal tissues: potential for in vivo targeting. Journal of Nuclear Medicine. 2007;48(5):736–743. doi: 10.2967/jnumed.106.038679. [DOI] [PubMed] [Google Scholar]
- 30.Gil-Lozano M., Romani-Perez M., Outeirino-Iglesias V., Vigo E., Gonzalez-Matias L.C., Brubaker P.L. Corticotropin-releasing hormone and the sympathoadrenal system are major mediators in the effects of peripherally administered exendin-4 on the hypothalamic-pituitary-adrenal axis of male rats. Endocrinology. 2014;155(7):2511–2523. doi: 10.1210/en.2013-1718. [DOI] [PubMed] [Google Scholar]
- 31.Malendowicz L.K., Nussdorfer G.G., Nowak K.W., Ziolkowska A., Tortorella C., Trejter M. Exendin-4, a GLP-1 receptor agonist, stimulates pituitary-adrenocortical axis in the rat: investigations into the mechanism(s) underlying Ex4 effect. International Journal of Molecular Medicine. 2003;12(2):237–241. [PubMed] [Google Scholar]
- 32.Ritter S., Watts A.G., Dinh T.T., Sanchez-Watts G., Pedrow C. Immunotoxin lesion of hypothalamically projecting norepinephrine and epinephrine neurons differentially affects circadian and stressor-stimulated corticosterone secretion. Endocrinology. 2003;144(4):1357–1367. doi: 10.1210/en.2002-221076. [DOI] [PubMed] [Google Scholar]
- 33.Bienkowski M.S., Rinaman L. Noradrenergic inputs to the paraventricular hypothalamus contribute to hypothalamic-pituitary-adrenal axis and central Fos activation in rats after acute systemic endotoxin exposure. Neuroscience. 2008;156(4):1093–1102. doi: 10.1016/j.neuroscience.2008.08.011. [DOI] [PMC free article] [PubMed] [Google Scholar]
- 34.Fraley G.S., Dinh T.T., Ritter S. Immunotoxic catecholamine lesions attenuate 2DG-induced increase of AGRP mRNA. Peptides. 2002;23(6):1093–1099. doi: 10.1016/s0196-9781(02)00044-x. [DOI] [PubMed] [Google Scholar]
- 35.Khan A.M., Walker E.M., Dominguez N., Watts A.G. Neural input is critical for arcuate hypothalamic neurons to mount intracellular signaling responses to systemic insulin and deoxyglucose challenges in male rats: implications for communication within feeding and metabolic control networks. Endocrinology. 2014;155(2):405–416. doi: 10.1210/en.2013-1480. [DOI] [PMC free article] [PubMed] [Google Scholar]
- 36.Baggio L.L., Drucker D.J. Biology of incretins: GLP-1 and GIP. Gastroenterology. 2007;132(6):2131–2157. doi: 10.1053/j.gastro.2007.03.054. [DOI] [PubMed] [Google Scholar]
- 37.Ghosal S., Myers B., Herman J.P. Role of central glucagon-like peptide-1 in stress regulation. Physiology & Behavior. 2013;122:201–207. doi: 10.1016/j.physbeh.2013.04.003. [DOI] [PMC free article] [PubMed] [Google Scholar]
- 38.Gil-Lozano M., Romani-Perez M., Outeirino-Iglesias V., Vigo E., Brubaker P.L., Gonzalez-Matias L.C. Effects of prolonged exendin-4 administration on hypothalamic-pituitary-adrenal axis activity and water balance. American Journal of Physiology. Endocrinology and Metabolism. 2013;304(10):E1105–E1117. doi: 10.1152/ajpendo.00529.2012. [DOI] [PubMed] [Google Scholar]
- 39.Elmquist J.K., Saper C.B. Activation of neurons projecting to the paraventricular hypothalamic nucleus by intravenous lipopolysaccharide. The Journal of Comparative Neurology. 1996;374(3):315–331. doi: 10.1002/(SICI)1096-9861(19961021)374:3<315::AID-CNE1>3.0.CO;2-4. [DOI] [PubMed] [Google Scholar]
- 40.Ericsson A., Kovacs K.J., Sawchenko P.E. A functional anatomical analysis of central pathways subserving the effects of interleukin-1 on stress-related neuroendocrine neurons. The Journal of Neuroscience. 1994;14(2):897–913. doi: 10.1523/JNEUROSCI.14-02-00897.1994. [DOI] [PMC free article] [PubMed] [Google Scholar]
- 41.Cole M.A., Kim P.J., Kalman B.A., Spencer R.L. Dexamethasone suppression of corticosteroid secretion: evaluation of the site of action by receptor measures and functional studies. Psychoneuroendocrinology. 2000;25(2):151–167. doi: 10.1016/s0306-4530(99)00045-1. [DOI] [PubMed] [Google Scholar]
- 42.Jahng J.W., Kim N.Y., Ryu V., Yoo S.B., Kim B.T., Kang D.W. Dexamethasone reduces food intake, weight gain and the hypothalamic 5-HT concentration and increases plasma leptin in rats. European Journal of Pharmacology. 2008;581(1–2):64–70. doi: 10.1016/j.ejphar.2007.11.029. [DOI] [PubMed] [Google Scholar]
- 43.Lerario D.D., Ferreira S.R., Miranda W.L., Chacra A.R. Influence of dexamethasone and weight loss on the regulation of serum leptin levels in obese individuals. Brazilian Journal of Medical and Biological Research. 2001;34(4):479–487. doi: 10.1590/s0100-879x2001000400007. [DOI] [PubMed] [Google Scholar]
- 44.Karssen A.M., Meijer O.C., Berry A., Sanjuan Pinol R., de Kloet E.R. Low doses of dexamethasone can produce a hypocorticosteroid state in the brain. Endocrinology. 2005;146(12):5587–5595. doi: 10.1210/en.2005-0501. [DOI] [PubMed] [Google Scholar]
- 45.Shimizu H., Arima H., Ozawa Y., Watanabe M., Banno R., Sugimura Y. Glucocorticoids increase NPY gene expression in the arcuate nucleus by inhibiting mTOR signaling in rat hypothalamic organotypic cultures. Peptides. 2010;31(1):145–149. doi: 10.1016/j.peptides.2009.09.036. [DOI] [PubMed] [Google Scholar]
- 46.Zakrzewska K.E., Cusin I., Stricker-Krongrad A., Boss O., Ricquier D., Jeanrenaud B. Induction of obesity and hyperleptinemia by central glucocorticoid infusion in the rat. Diabetes. 1999;48(2):365–370. doi: 10.2337/diabetes.48.2.365. [DOI] [PubMed] [Google Scholar]
- 47.Yang Y., Moghadam A.A., Cordner Z.A., Liang N.C., Moran T.H. Long term exendin-4 treatment reduces food intake and body weight and alters expression of brain homeostatic and reward markers. Endocrinology. 2014;155(9):3473–3483. doi: 10.1210/en.2014-1052. [DOI] [PMC free article] [PubMed] [Google Scholar]
- 48.Rosen J., Miner J.N. The search for safer glucocorticoid receptor ligands. Endocrine Reviews. 2005;26(3):452–464. doi: 10.1210/er.2005-0002. [DOI] [PubMed] [Google Scholar]
- 49.Hwang J.L., Weiss R.E. Steroid-induced diabetes: a clinical and molecular approach to understanding and treatment. Diabetes/Metabolism Research and Reviews. 2014;30(2):96–102. doi: 10.1002/dmrr.2486. [DOI] [PMC free article] [PubMed] [Google Scholar]
- 50.Korach-Andre M., Gao J., Gounarides J.S., Deacon R., Islam A., Laurent D. Relationship between visceral adiposity and intramyocellular lipid content in two rat models of insulin resistance. American Journal of Physiology. Endocrinology and Metabolism. 2005;288(1):E106–E116. doi: 10.1152/ajpendo.00089.2004. [DOI] [PubMed] [Google Scholar]
- 51.Fransson L., Dos Santos C., Wolbert P., Sjoholm A., Rafacho A., Ortsater H. Liraglutide counteracts obesity and glucose intolerance in a mouse model of glucocorticoid-induced metabolic syndrome. Diabetology & Metabolic Syndrome. 2014;6(1):3. doi: 10.1186/1758-5996-6-3. [DOI] [PMC free article] [PubMed] [Google Scholar]
- 52.Matsuo K., Nambu T., Matsuda Y., Kanai Y., Yonemitsu S., Muro S. Evaluation of the effects of exenatide administration in patients with type 2 diabetes with worsened glycemic control caused by glucocorticoid therapy. Internal Medicine. 2013;52(1):89–95. doi: 10.2169/internalmedicine.52.8622. [DOI] [PubMed] [Google Scholar]
- 53.Zhao R., Fuentes-Mattei E., Velazquez-Torres G., Su C.H., Chen J., Lee M.H. Exenatide improves glucocorticoid-induced glucose intolerance in mice. Diabetes Metabolic Syndrome and Obesity. 2011;4:61–65. doi: 10.2147/DMSO.S15510. [DOI] [PMC free article] [PubMed] [Google Scholar]
- 54.Ritter S., Llewellyn-Smith I., Dinh T.T. Subgroups of hindbrain catecholamine neurons are selectively activated by 2-deoxy-D-glucose induced metabolic challenge. Brain Research. 1998;805(1–2):41–54. doi: 10.1016/s0006-8993(98)00655-6. [DOI] [PubMed] [Google Scholar]
- 55.Appleyard S.M., Marks D., Kobayashi K., Okano H., Low M.J., Andresen M.C. Visceral afferents directly activate catecholamine neurons in the solitary tract nucleus. The Journal of Neuroscience. 2007;27(48):13292–13302. doi: 10.1523/JNEUROSCI.3502-07.2007. [DOI] [PMC free article] [PubMed] [Google Scholar]
- 56.Hisadome K., Reimann F., Gribble F.M., Trapp S. Leptin directly depolarizes preproglucagon neurons in the nucleus tractus solitarius: electrical properties of glucagon-like peptide 1 neurons. Diabetes. 2010;59(8):1890–1898. doi: 10.2337/db10-0128. [DOI] [PMC free article] [PubMed] [Google Scholar]
- 57.Hisadome K., Reimann F., Gribble F.M., Trapp S. CCK stimulation of GLP-1 neurons involves alpha1-adrenoceptor-mediated increase in glutamatergic synaptic inputs. Diabetes. 2011;60(11):2701–2709. doi: 10.2337/db11-0489. [DOI] [PMC free article] [PubMed] [Google Scholar]
- 58.Rinaman L. Interoceptive stress activates glucagon-like peptide-1 neurons that project to the hypothalamus. American Journal of Physiology. 1999;277(2 Pt 2):R582–R590. doi: 10.1152/ajpregu.1999.277.2.R582. [DOI] [PubMed] [Google Scholar]
- 59.Trapp S., Richards J.E. The gut hormone glucagon-like peptide-1 produced in brain: is this physiologically relevant? Current Opinion in Pharmacology. 2013;13(6):964–969. doi: 10.1016/j.coph.2013.09.006. [DOI] [PMC free article] [PubMed] [Google Scholar]
- 60.Vrang N., Phifer C.B., Corkern M.M., Berthoud. H.R. Gastric distension induces c-Fos in medullary GLP-1/2-containing neurons. American Journal of Physiology. Regulatory, Integrative and Comparative Physiology. 2003;285:R470–R478. doi: 10.1152/ajpregu.00732.2002. [DOI] [PubMed] [Google Scholar]
- 61.Zhang R., Packard B.A., Tauchi M., D'Alessio D.A., Herman. J.P. Glucocorticoid regulation of preproglucagon transcription and RNA stability during stress. Proceedings of the National Academy of Sciences of the United States of America. 2009;106(14):5913–5918. doi: 10.1073/pnas.0808716106. [DOI] [PMC free article] [PubMed] [Google Scholar]
- 62.Khan A.M., Kaminski K.L., Sanchez-Watts G., Ponzio T.A., Kuzmiski J.B., Bains J.S. MAP kinases couple hindbrain-derived catecholamine signals to hypothalamic adrenocortical control mechanisms during glycemia-related challenges. The Journal of Neuroscience. 2011;31(50):18479–18491. doi: 10.1523/JNEUROSCI.4785-11.2011. [DOI] [PMC free article] [PubMed] [Google Scholar]
- 63.Akabayashi A., Watanabe Y., Wahlestedt C., McEwen B.S., Paez X., Leibowitz. S.F. Hypothalamic neuropeptide Y, its gene expression and receptor activity: relation to circulating corticosterone in adrenalectomized rats. Brain Research. 1994;665(2):201–212. doi: 10.1016/0006-8993(94)91339-0. [DOI] [PubMed] [Google Scholar]
- 64.White B.D., Dean R.G., Martin R.J. Adrenalectomy decreases neuropeptide Y mRNA levels in the arcuate nucleus. Brain Research Bulletin. 1990;25(5):711–715. doi: 10.1016/0361-9230(90)90047-4. [DOI] [PubMed] [Google Scholar]
- 65.de Mello A.H., Pra M., Cardoso L.C., de Bona Schraiber R., Rezin G.T. Incretin-based therapies for obesity treatment. Metabolism. 2015;64(9):967–981. doi: 10.1016/j.metabol.2015.05.012. [DOI] [PubMed] [Google Scholar]
- 66.Finan B., Clemmensen C., Muller T.D. Emerging opportunities for the treatment of metabolic diseases: glucagon-like peptide-1 based multi-agonists. Molecular and Cellular Endocrinology. 2015;418(Pt 1):42–54. doi: 10.1016/j.mce.2015.07.003. [DOI] [PubMed] [Google Scholar]
Associated Data
This section collects any data citations, data availability statements, or supplementary materials included in this article.