Significance
Kinin receptors are known in insects to contribute to osmotic regulation and are expressed in the excretory system, in the Malpighian tubules (renal organs), and in hindgut. We discovered that in Aedes aegypti mosquitoes, which are important vectors of human disease, a kinin receptor is also expressed within taste hairs (sensilla) on the legs and mouthparts. A kinin analog engineered to be peptidase resistant activates this kinin receptor with high potency, inhibiting sucrose taste detection directly at the level of the taste organs and eliciting a fast and highly aversive response in females during feeding. This finding suggests that mosquito G protein-coupled receptors could be new targets for discovering compounds to deter mosquitoes and preventing them from feeding.
Keywords: neuropeptide GPCR, sucrose taste, sensory neuron, chemical target validation, feeding deterrent
Abstract
Insect kinins (leucokinins) are multifunctional peptides acting as neurohormones and neurotransmitters. In females of the mosquito vector Aedes aegypti (L.), aedeskinins are known to stimulate fluid secretion from the renal organs (Malpighian tubules) and hindgut contractions by activating a G protein-coupled kinin receptor designated “Aedae-KR.” We used protease-resistant kinin analogs 1728, 1729, and 1460 to evaluate their effects on sucrose perception and feeding behavior. In no-choice feeding bioassays (capillary feeder and plate assays), the analog 1728, which contains α-amino isobutyric acid, inhibited females from feeding on sucrose. It further induced quick fly-away or walk-away behavior following contact with the tarsi and the mouthparts. Electrophysiological recordings from single long labellar sensilla of the proboscis demonstrated that mixing the analog 1728 at 1 mM with sucrose almost completely inhibited the detection of sucrose. Aedae-KR was immunolocalized in contact chemosensory neurons in prothoracic tarsi and in sensory neurons and accessory cells of long labellar sensilla in the distal labellum. Silencing Aedae-KR by RNAi significantly reduced gene expression and eliminated the feeding-aversion behavior resulting from contact with the analog 1728, thus directly implicating the Aedae-KR in the aversion response. To our knowledge, this is the first report that kinin analogs modulate sucrose perception in any insect. The aversion to feeding elicited by analog 1728 suggests that synthetic molecules targeting the mosquito Aedae-KR in the labellum and tarsi should be investigated for the potential to discover novel feeding deterrents of mosquito vectors.
Females of Aedes aegypti (L.) mosquitoes (Diptera: Culicidae) are anthropophilic, feeding preferentially on blood from a human host, but both sexes feed on sugar-rich nectar as a source of metabolic energy. The female requires a blood meal for egg production and during that meal can transmit mosquito-borne diseases including dengue, Zika, chikungunya, and yellow fever viruses (1). Sugar feeding begins shortly after adult emergence and continues throughout adulthood. Importantly, sugar feeding influences vectorial capacity by increasing daily survival (2, 3) and can positively affect female reproductive maturation by increasing juvenile hormone synthesis (3).
However, ingesting liquids causes osmotic stress, which insects compensate through diuresis. We targeted this essential mechanism by altering neuropeptides affecting diuresis. Neuropeptide diuretic hormones increase the secretion of primary urine by the Malpighian tubules and increase hindgut contractions, which aid in fluid excretion (4). In A. aegypti, three endogenous kinins (aedeskinin I–III) act as diuretic hormones on Malpighian tubule stellate cells (5, 6) by stimulating chloride transport and fluid secretion (6–8). We verified that the aedeskinins activate the single Aedes kinin receptor (Aedae-KR), a G protein-coupled receptor (GPCR) that signals through intracellular calcium (9). We designed kinin analogs to be resistant to degrading peptidases and therefore exhibit sustained high potency (10, 11). One biostable kinin peptidomimetic containing aminoisobutyric acid, 1728, has potency similar to or higher than the aedeskinins on recombinant receptors (12). Such biostable kinin analogs have potential in the control of insect pests because they reduce feeding in lepidopteran larvae (10, 13) and increase aphid mortality (14, 15).
Here, we examined whether three biostable insect kinin analogs, 1728, 1729, and 1460 (Fig. S1), affect feeding in female mosquitoes and/or have a direct impact on the gustatory detection of sugars. First, we demonstrate through feeding assays that the kinin analog 1728 significantly reduces the time females spend in contact with a sucrose solution and displays potent antifeedant activity. In addition, we present the first evidence, to our knowledge, that the potent kinin peptidomimetic 1728 further triggers female mosquito aversive fly-away or walk-away behaviors upon labellar and tarsal contacts with a sucrose source, overriding sweet taste perception. Electrophysiological recordings from the long labellar sensillum revealed that externally applied kinin analogs inhibited the sucrose-evoked response within milliseconds. Second, the Aedae-KR was cloned and sequenced from sensory appendages, and immunolocalization experiments confirmed its expression in sensory neurons of the tarsi and long labellar sensilla and in accessory cells of the labellum. Moreover, silencing the Aedae-KR in female mosquitoes inhibited the aversive behavior resulting from contact with the kinin analog 1728. Taken together, these observations provide new insight into gustatory perception modulated by a canonical GPCR.
Fig. S1.
Comparative structures of the three biostable insect kinin analogs: K-Aib-1 (1728) (A), K-Aib-3 (1729) (B) (12), and K-βA-1 (1460) (C) (26). The boxes highlight the unnatural portions of the peptide structures. In A and B, the boxes highlight the side chains of the bulky Aib residues. In C the box highlights the β-amino acid β3Pro that replaces the Pro that normally resides at that position in many natural insect kinins. Both B and C also feature an acetyl group (Ac) that caps the N terminus, located at the very left of the structures. This acetyl group adds further biostability against hydrolysis by aminopeptidases.
Results
No-Choice Feeding Bioassays of Kinin Analogs.
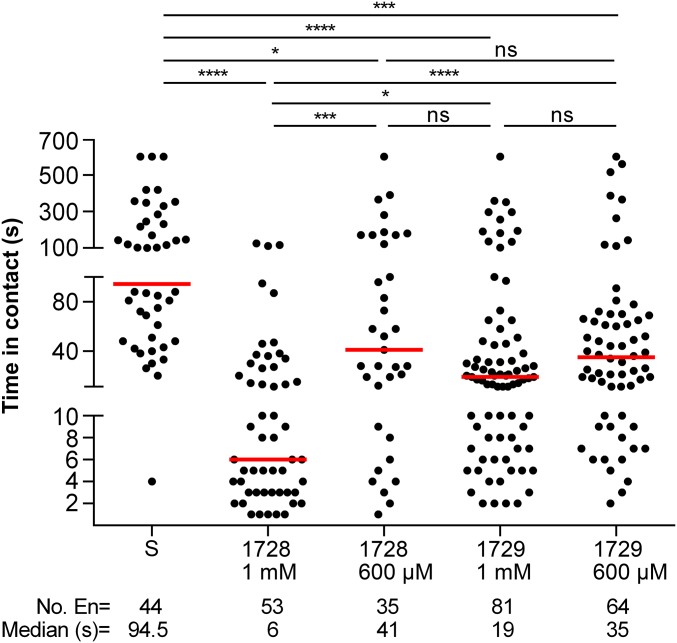
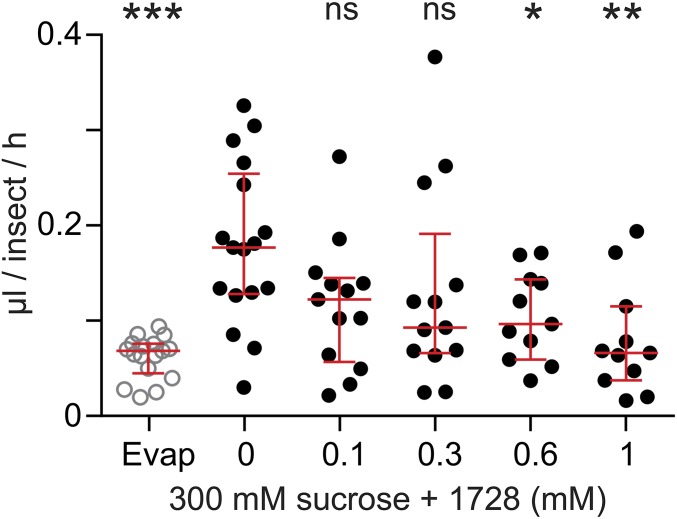
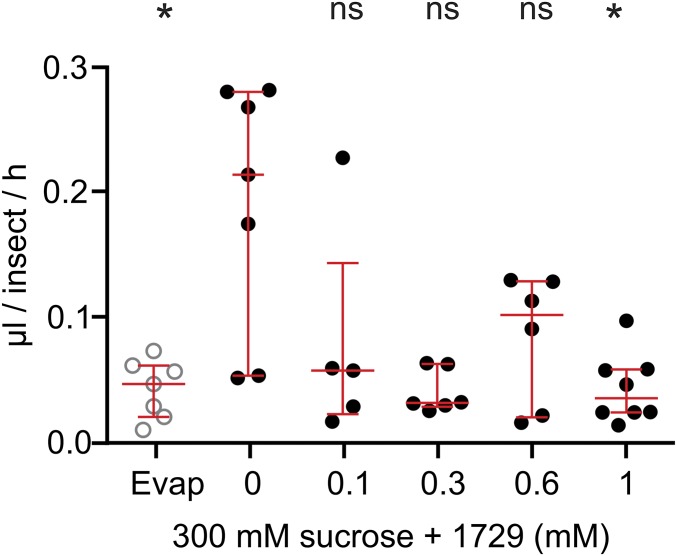
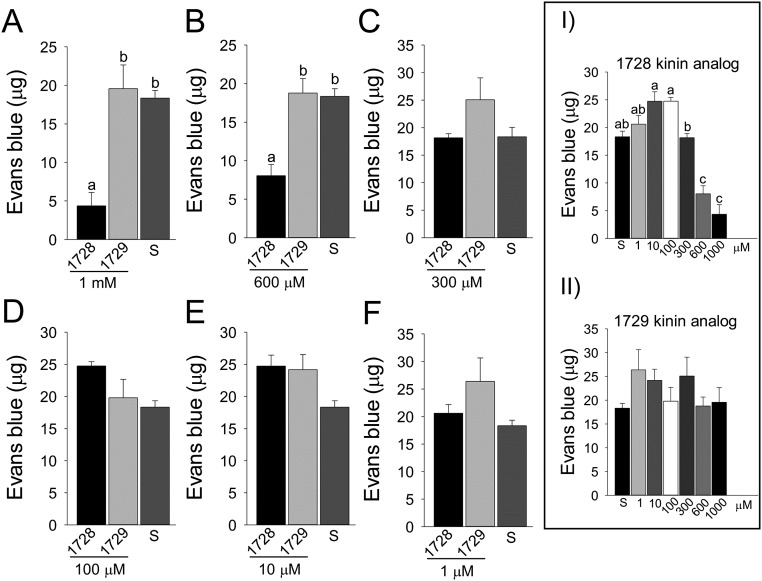
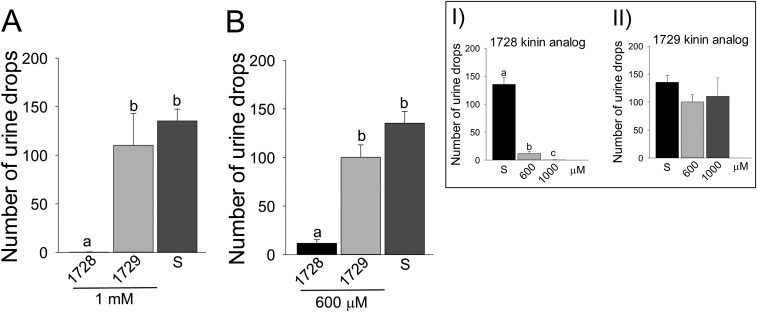
To determine the effects of kinin analogs (Fig. S1) on mosquitoes, we exposed females to drops of a sucrose solution mixed with different concentrations of kinin analogs 1728 and 1729. Most often, females touched the diet with their proboscis and prothoracic legs simultaneously (Movies S1 and S2). With analog 1728 at a concentration of 1 mM, females that contacted the diet moved away within a few seconds by exhibiting jump-, fly-, or walk-away behavior (Movie S1). Such an aversive response was rarely observed when females contacted the control sucrose-only solution (Fig. 1 and Movie S2). To quantify these behaviors, we compared the time females spent in contact with diets containing a kinin analog and with the sucrose-only solution (300 mM) during the first hour of exposure (Fig. 1). Analog 1728 at 1 mM significantly reduced the median time spent in contact with the diet (6 s) compared with the other analog concentrations and the sucrose-only control. The maximal time spent in contact with analog 1728 at a concentration of 1 mM was about 2 min and was several fold longer for all other treatments (Fig. 1). The median time spent in contact with analogs 1728 at 600 µM and 1729 at 1 mM and 600 μM also was reduced compared with the time spent in contact with the control solution (94.5 s) (Fig. 1). The time females spent in contact with analog 1728 at 600 µM (41 s) did not differ from the time spent in contact with analog 1729 (Fig. 1). To determine if the observed shorter time spent in contact with the two analogs also differentially affected ingestion, capillary feeder (CAFE) assays were performed. Females ingested significantly less of either analog at the 1-mM concentration (Fig. 2 and Fig. S2) and also ingested less analog 1728 at the 600 µM concentration (Fig. 2), as compared with sucrose. Because kinin analogs may stimulate diuresis during feeding, plate assays were run to determine the number of urine drops (colored blue by the addition of Evans blue to the diets) deposited in the plates and the quantity of Evans blue remaining in females 5 h after diet ingestion when provided sucrose plus one analog at a time (Figs. S3 and S4). Females exposed to analog 1728 at 1 mM and 600 µM contained less Evans blue than females exposed to analog 1729 at similar concentrations or to the control sucrose solution (Fig. S3 A and B). No significant differences in Evans blue content were observed between treatments with analogs 1728 and 1729 (Fig. S3 C–F). Importantly, fewer urine drops were observed when females were exposed to analog 1728 at 1 mM and 600 µM than when females were offered control solution (S) or solution treated with analog 1729 at the same concentrations (Fig. S4 A and B). The number of urine drops excreted from females exposed to analog 1728 also was lower at 1 mM than at 600 µM (Fig. S4 B and Inset I). No differences were found between females offered control sucrose-only solution and those treated with analog 1729 (Fig. S4 B and Inset II). The results of the median time spent in contact with diets during the first hour of exposure (Fig. 1) and CAFE assays (Fig. 2) indicated that females exposed to analog 1728 at 1 mM or 600 μM consumed less diet than those exposed to analog 1728 at lower concentrations.
Fig. 1.
Median time female mosquitoes spent in contact with kinin analogs 1728 and 1729 (at 1-mM and 600-µM concentrations in sucrose solution) or with a 10% sucrose solution (S) as control. Females were videorecorded for 1 h (Movies S1 and S2). Each dot represents the duration of a single encounter of a female with the diet, and the median time spent in contact is indicated by a red line. Three independent replicates were performed, for a total of 60 females (20♀ × 3) exposed per treatment. The total number of encounters (En) is shown below each column; some females made multiple encounters. The maximal recorded time of an individual encounter was 10 min. Data were analyzed by Kruskal–Wallis nonparametric ANOVA followed by Dunn’s multiple comparisons test. Black lines above the figure define the contrasts in pairs of medians. Asterisks denote significant differences (*P < 0.05, ***P < 0.001, ****P < 0.0001); ns, not significant.
Fig. 2.
Consumption of sugar mixed with kinin 1728 ingested by A. aegypti females during 2 h in a CAFE assay. Groups of five females were starved for 48 h and then were exposed to a 5-µL capillary tube containing 300 mM sucrose and kinin 1728. The volume of liquid that disappeared during the experiment was measured. Data are shown as individual measures (dots) and median volume ± first quartile (red lines) from 11–17 replications. Ordinates: volume expressed in microliters per insect per hour. Abcissa: concentration of analog 1728 (0 to 1 mM) in a 300-mM sucrose solution; Evap, loss of volume of sugar solution from vials without mosquitoes. One-way ANOVA followed by Dunnett’s multiple comparison test was used to compare treatments with the sucrose control (*P < 0.05, **P < 0.01, ***P < 0.001); ns, not significant.
Fig. S2.
Consumption of sugar mixed with kinin 1729 ingested by A. aegypti females during a 2-h CAFE assay. Groups of five females were starved for 48 h and then were exposed to a 5-µL capillary tube containing 300 mM sucrose and kinin 1729. The volume of liquid that disappeared during the experiment was measured. Data show the individual measures (dots) and the median volume ± first quartile (red lines) of five to eight replications. Ordinates: volume expressed in microliters per insect per hour. Abcissa: concentration of analog 1729 (0 to 1 mM) in a 300-mM sucrose solution; Evap, loss of volume of sugar solution from vials without mosquitoes. Kruskal–Wallis ANOVA was followed by Dunn’s multiple comparison test (*P < 0.05); ns, not significant.
Fig. S3.
Volume of Evans blue (expressed in micrograms) found in females exposed to kinin analogs in sucrose solution with Evans blue in no-choice feeding assays. After 5 h of dietary exposure to analogs at different concentrations or to control sucrose solution (S), the amount of Evans blue was measured from pooled females in each treatment. Three biological replicates were done per treatment. (A–F) Analogs 1728 and 1729 are compared at the same concentrations. (Inset I) Females exposed to 600 and 1,000 µM of analog 1728 contained significantly less dye (P < 0.01). (Inset II) Analog 1729 did not have any effect on the residual amount of Evans blue, which at all analog concentrations was similar to that in mosquitoes exposed to the sucrose control. The data from three independent replications in each panel were analyzed with one-way ANOVA followed by Tukey's HSD test. In A and B, bars represent mean ± SEM. Common letters indicate nonsignificant differences at P < 0.05. (C–F). No significant differences were found among diets. (Insets) The data in A–F were analyzed with one-way ANOVA followed by Tukey's HSD test but comparing the different concentrations of the same analog. Bars represent the mean ± SEM. (Inset I). A common letter indicates no significant difference; P < 0.05. (Inset II) No significant difference was observed. One-way ANOVA was performed after an initial univariate GLM analysis demonstrated there was a significant effect of analogs and their concentrations that influenced Evans blue content (P < 0.0001).
Fig. S4.
Analog 1728 significantly decreases the number of urine drops excreted by females in no-choice feeding assays. (A and B) The total numbers of urine drops excreted by females exposed to analogs 1728 or 1729 at two concentrations of 1 mM or 600 mM or to control sucrose solution (S) were counted after 5 h of dietary exposure. (Insets) The data shown in A and B were analyzed to compare the effect of different concentrations of the same analog (Inset I, 1728; Inset II, 1729). No significant differences were found among sucrose and concentrations of analog 1729 (Inset II). The data were analyzed with nonparametric ANOVA and a Kruskal–Wallis test. Bars represent mean ± SEM, and common letters indicate no significant differences at P < 0.05 (Inset I).
Closer examination of females’ behavior allowed us to determine that the rejection of diets containing analog 1728 at 1 mM and 600 µM occurred most often after the female contacted the diet with the legs and proboscis simultaneously (Movie S1).
Electrophysiological Recordings on Long Labellar Hair Sensilla.
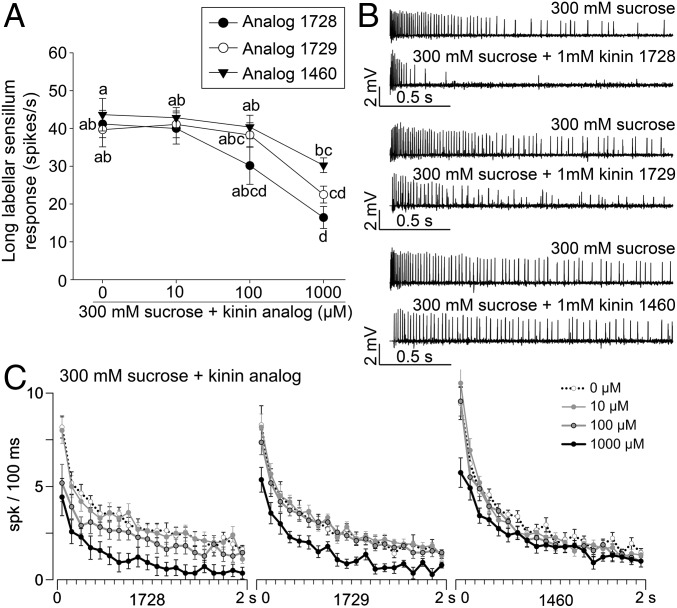
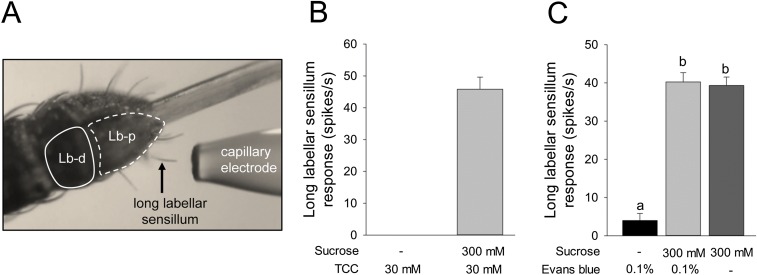
To determine if kinin analogs interfered directly with the detection of sucrose, we performed electrophysiological recordings from long labellar sensilla on the proboscis (Fig. 3A and Fig. S5A). In this preparation, extracellularly recorded spikes show an amplitude between 0.5 and 2 mV, depending on the insect and on the firing rate of the cells. The responses to 300 mM sucrose mixed with the kinin analogs (10 µM to 1 mM of 1728, 1729, or 1460) generally showed only one class of action potentials (Fig. 3B), suggesting that these analogs do not activate another taste modality (i.e., salty or bitter), at least in the sensilla tested.
Fig. 3.
Electrophysiological responses to kinin analogs recorded from long sensilla in the distal segment of the female labellum. (A) Long labellar sensilla were stimulated with kinin analogs 1728, 1729, and 1460 in 300 mM sucrose. For analogs 1728 and 1729 the maximal inhibition of the sucrose response was observed at 1 mM. Analog 1460 significantly inhibits the sucrose response only when applied at 1 mM, and it was less inhibitory than analogs 1728 and 1729 at the same concentration; analog 1729 was intermediate in potency. Data analysis (the number of spikes during the first second of 2-s recordings) was performed using the SAS command PROC generalized linear mixed model (GLMM) Tukey–Kramer test. Different letters indicate significant differences. Ten females were used to obtain each curve. (B) Consecutive responses to 300 mM sucrose (Upper Traces) and 1 mM of kinin analogs in 300 mM sucrose (Lower Traces) over 2 s. (C) Temporal dynamics of sweet neuron responses to kinin analogs at 1 mM in sucrose solution. In A and C each point represents the mean, and bars represent the SEM.
Fig. S5.
(A) Photograph showing long labellar sensilla from which recordings were performed. A stimulus capillary electrode is positioned to cover one sensillum (arrow). Details are described in SI Materials and Methods. Lb-d, labellar distal segment; Lb-p, labellar proximal segment. (B) Responses of sweet-taste neurons in a single A. aegypti female labellar long hair sensillum to TCC electrolyte alone (30 mM) or sucrose solution (300 mM) with TCC. TCC as a control did not trigger spiking activity. (C) Responses (the number of spikes in the first second of a 2-s recording) of A. aegypti female labellar long hair sensillum to solutions of 0.1% Evans blue without or with sucrose (300 mM) or to sucrose alone (300 mM). The response to 0.1% Evans blue was insignificant, and the number of spikes per second did not differ in the other two treatments (300 mM sucrose + 0.1% Evans blue and 300 mM sucrose alone). One-way ANOVA with Tukey test; P < 0.05. Eight females were used.
When the analogs were applied at 1 mM, a significant (*P < 0.05) decrease in the firing rate—60, 45, and 30% for analogs 1728, 1729, and 1460, respectively—was observed (Fig. 3A) as compared with sucrose only. Analogs were not inhibitory when applied at 10 μM, but the level of inhibition was intermediate for 1728 and 1729 applied at 100 μM. Analog 1460 inhibited the sucrose response significantly only when applied at 1 mM and was less inhibitory than the other two at this concentration, with analog 1729 being intermediate in potency (Fig. 3A). The representative traces obtained in response to sucrose in the absence or presence of the three analogs clearly show analog 1728 is the most potent, followed by 1729 and 1460 in that order (Fig. 3B). Kinin analogs depress both the phasic and the tonic portions of the responses to sugar, and this inhibition is concentration dependent (Fig. 3C). Kinin analogs thus exert their inhibition immediately after the female contacts the stimulus solution. The three analogs do not differ in their temporal kinetics, keeping the same rank order of potency, suggesting that they act on the same target. It is clear that the initial response to sucrose is higher than the initial number of spikes per second for analog 1728 at 100 µM (and 1 mM); this difference is not so obvious for analog 1460. The response is very rapid for analog 1728 at 1 mM and is less rapid for the other two analogs (Fig. 3C, black traces). These electrophysiological results are in accordance with observations of feeding behavior (Figs. 1 and 2, Figs. S2 and S3, and Movie S1), which indicated that analog 1728 was the most potent molecule.
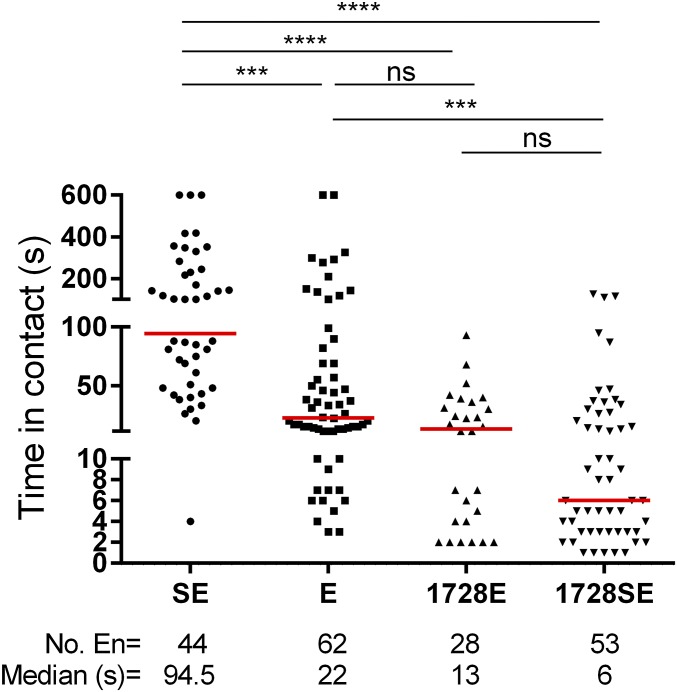
To determine if analog 1728 had other aversive effects in addition to the inhibition of sucrose perception, we performed no-choice assays in the presence and absence of sucrose (Fig. S6). The time spent in contact with Evans blue only (E) was shorter the time spent in contact with sucrose solution containing Evans blue (SE). Importantly, we showed that Evans blue does not alter the number of spikes per second of the sucrose neuron (Fig. S5C), suggesting that females perceive solution (E) to be similar to water. In addition, there was no difference in the median time females spent in contact with the (E) solution or analog 1728 with Evans blue in the absence of sucrose (1728E). The median time spent in contact did not differ between 1728E and 1728SE, indicating that sucrose is not perceived differentially by these two female groups. However, the median time females spent with 1728SE was shorter than that spent with solution (E) (Fig. S6). These results clearly indicate that analog 1728 at 1 mM interacts strongly with the sucrose perception circuitry.
Fig. S6.
Time (in seconds) female mosquitoes spent in contact with solutions of sucrose with Evans blue (SE), Evans blue only (E), kinin analog 1728 at 1 mM with Evans blue and without sucrose (1728E), or kinin analog 1728 at 1 mM with Evans blue and with sucrose (1728SE). The total number of encounters (En) and the median time are shown below each column. Data were analyzed by Kruskal–Wallis nonparametric ANOVA followed by Dunn’s multiple comparisons test. Asterisks denote significant differences (***P < 0.001, ****P < 0.0001); ns, not significant.
Aedae-KR Full-Length cDNA Cloning from Female and Male Legs and Female Labellum.
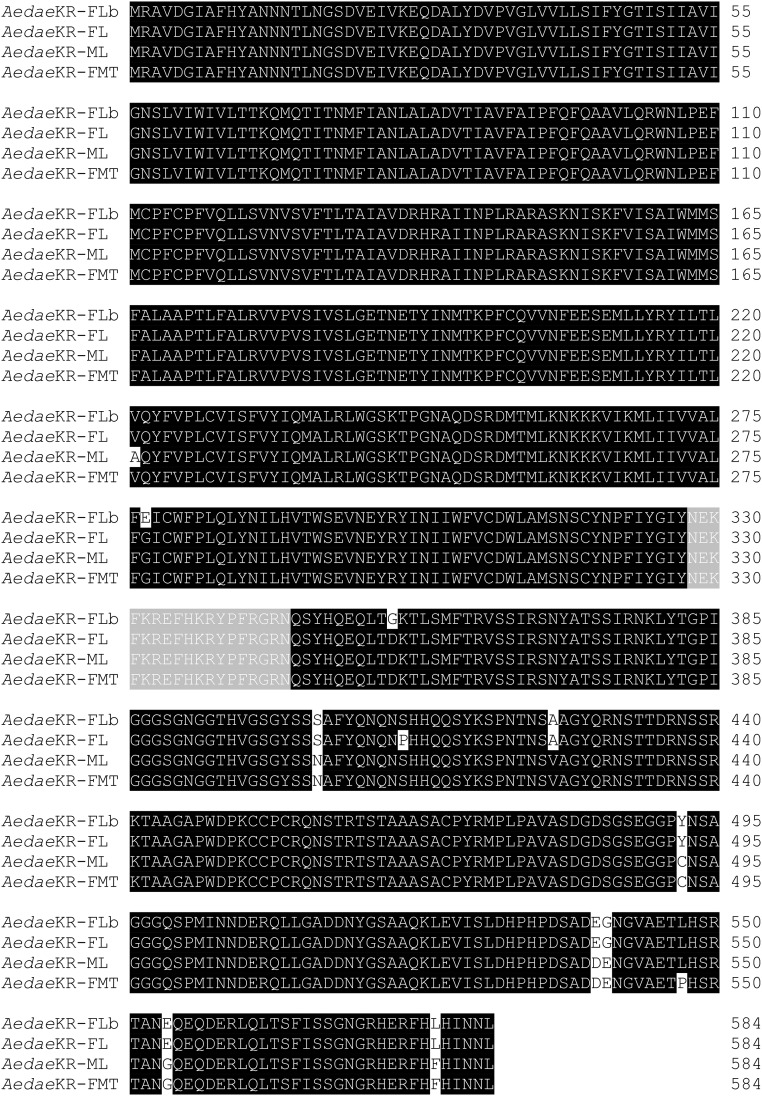
The aversive response to analog 1728 appeared to be specific and mediated mainly by labellar and tarsal contact (Fig. 1 and Movie S1) Therefore, to investigate Aedae-KR expression in these appendages, full-length cDNAs were cloned from the labellum and legs of females and from the legs of males (Fig. S7). The Aedae-KR predicted amino acid sequences obtained were similar to the receptor cloned from the Malpighian tubule (AAT95982) (9), and the region selected for antibody production (residues 328–345; NEKFKREFHKRYPFRGRN) (Fig. S7) also was identical. Thus, transcript expression of Aedae-KR was confirmed in appendages, validating the use of the previously reported antibody to localize the receptor (5, 7).
Fig. S7.
Alignment of Aedae-KR amino acid sequences translated from full-length ORF cDNAs from female appendages (labellum and legs) (this work) and Malpighian tubules (GenBank AAT95982) (9) and from male legs (this work). Identical residues are shaded in black. The stretch of sequences shaded in gray indicates the antigenic sequence used for anti-peptide antibody production (5, 7). In cDNAs from female appendages, there were nonsynonymous SNPs with respect to the Malpighian tubule sequence, resulting in changes in amino acid residues for the protein expressed in labellum and legs in females, indicated as follows: Malpighian tubule residue-residue position-appendage residue: Gly277Glu and Asp355Gly in female labellum and Ser411Pro in female legs. In both appendages in females, the following substitutions were found: Asn403Ser, Val425Ala, Cys492Tyr, Asp539Glu, Glu540Gly, Pro547Leu, Gly554Glu, and Phe579Leu. Substitutions found in male legs were Val221Ala and Pro547Leu. These changes likely reflect allelic variations in the individuals from which the Malpighian tubule cDNA was originally cloned (9). FL, female legs; FLb, female labellum; FMT, female Malpighian tubules; ML, male legs.
Immunolocalization of Aedae-KR and Identification of Aedae-KR Sensilla.
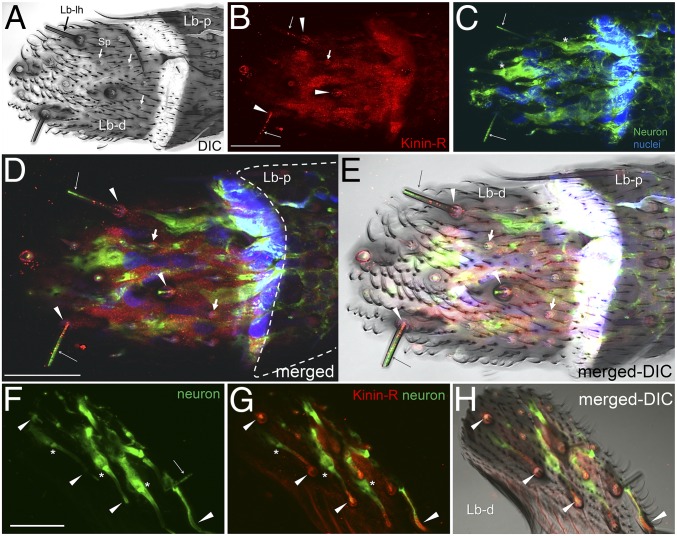
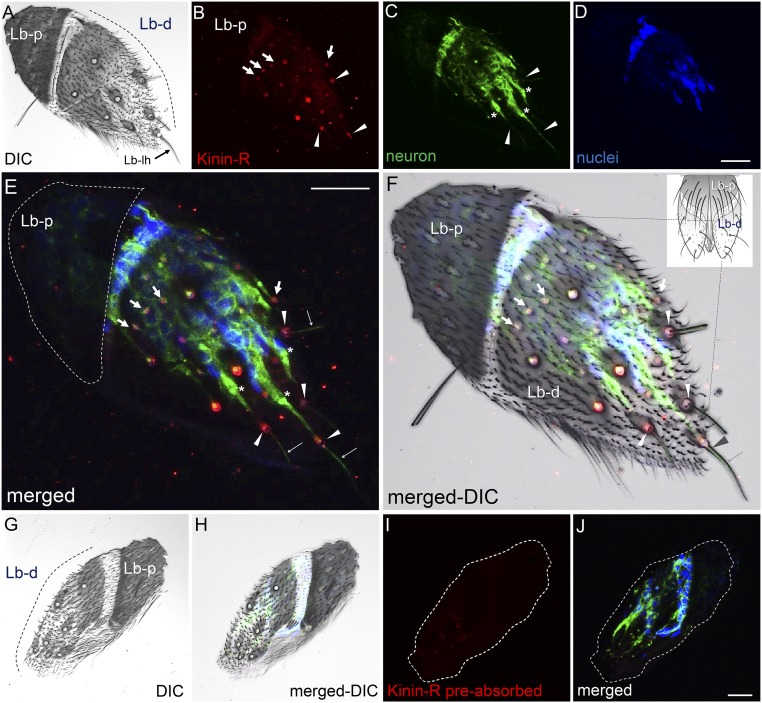
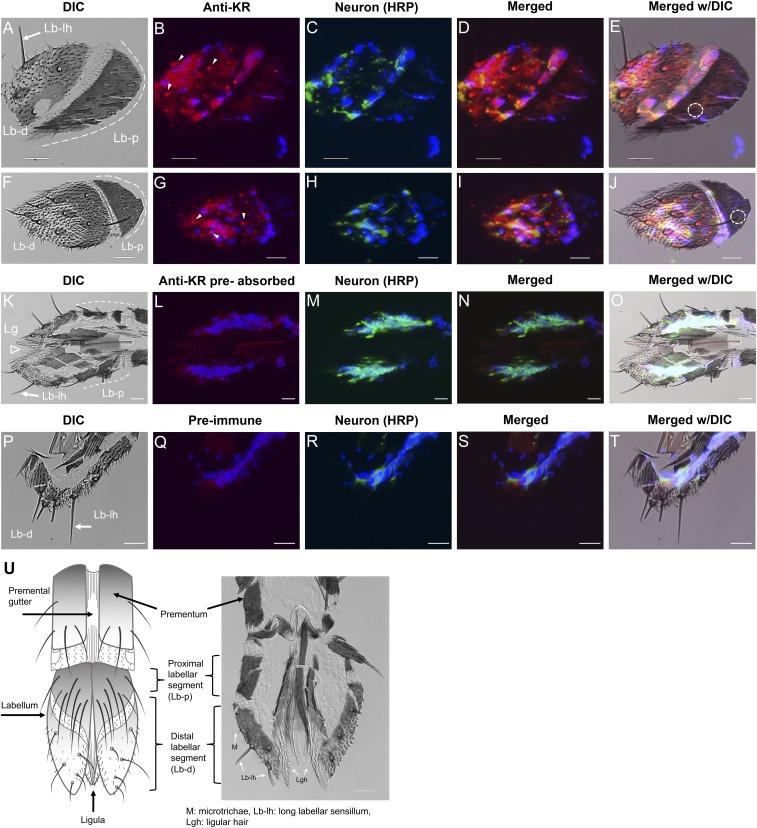
To verify Aedae-KR protein expression, immunohistochemistry was performed in frozen sections of labellum (Fig. 4 and Figs. S8 and S9) and tarsi (Fig. 5 and Fig. S10). The labellum is shown in Fig. 4A and Figs. S8A and S9U. The receptor signal (red) was observed in dendrites of sensory neurons extending to the tip of the long labellar hairs (Fig. 4) and in accessory cells present at the base of long labellar sensilla (Fig. 4 and Figs. S8 and S9), but the signal was detected only in accessory cells of short papillae (Fig. 4 and Fig. S8). Receptor signal was not observed at the base of hairs in the labellar proximal segment (Fig. 4 and Figs. S8 and S9). No signal was observed in tissues incubated with antigen-preabsorbed antibodies (Figs. S8 and S9) or preimmune serum (Fig. S9).
Fig. 4.
Confocal analyses of the Aedae-KR immunolocalization in long labellar sensilla (Lb-lh, long hair) (black arrow) and short papillae (Sp) (white arrows) in the distal segment of the female labellum. Lb-d, labellar distal segment. (A) Diffused interference contrast (DIC) image. (B–H) The receptor signal (red) is present in dendrites of sensory neurons, indicated by long arrows in B, D, and E, and in accessory cells of both the long labellar sensilla, indicated by arrowheads in B, D, E, G, and H, and short papillae, indicated by short arrows in B, D, and E. Neurons appear green in C–H. Nuclei appear blue in C, D, and E. The root fiber bundles in the ciliary region of sensory neurons are marked by asterisks in C, F, and G. No receptor signal was observed in the labellum proximal segment (the area enclosed by a dashed white line in D). Images were acquired as Z-stacks (Z step: 0.41 µm) using a 100×/1.4 oil immersion objective as follows: A and C, 20 sections; D and E, 11 sections; F, 19 sections. B, G, and H show a single optical section (depth, 4.51 µm from the cuticle). (Scale bars, 20 µm.) Two different tissues are shown in A–E and F–H, respectively.
Fig. S8.
Confocal analyses of Aedae-KR immunolocalization in the distal segment of the labellum. In A, F, G, and H, DIC images show the labellum is composed of two segments, proximal and distal (dashed black lines in A, F, and G), where long labellar sensilla (long hair, black arrow in A) are present (see drawing in F). In C, E, F, H, and J neurons appear green (anti-HRP antibody). In D, E, F, H, and J nuclei appear blue (DAPI). The root fiber bundles in the ciliary region of sensory neurons are marked by asterisks in C and E. The receptor signal (red) is present in accessory cells at the base of long labellar sensilla, indicated by arrowheads in B, E, and F, and in accessory cells of short papilla, indicated by arrows in B, E, and F. No receptor signal was observed in the labellum proximal segment, the area enclosed by the dashed white line in E. Dendrites projecting toward the tip of the long labellar hair are shown in E and F (thin arrows). No receptor signal was observed in negative control tissues (antigen preabsorbed antibodies). G–J show the same tissue. Images as Z-stacks (Z-step: 0.66 µm) are as follows: A–F, 12 sections; G–J, 10 sections. Lb-d, distal segment of labellum; Lb-lh, long labellar hair; Lb-p, proximal segment of labellum. (Scale bars, 20 µm.)
Fig. S9.
Immunofluorescence analyses of the Aedae-KR in female labellum. (A, F, K, and P) DIC images show the distal and proximal (dashed white lines) labellar segments and ligula (open arrowhead in K). (B and G) The receptor signal (red) was observed in sensory neurons of labellar sensilla (arrowheads) only in the distal labellar segment. (E and J) No receptor signal was observed in the proximal labellar segment, although hairs/sensilla were present (dashed circle). (L, N, O, Q, S, and T) No receptor signal was observed in tissues incubated with antigen preabsorbed antibody (L, N, and O) or with preimmune serum (Q, S, and T). In C, H, M, and R, neurons appear green. Merged images of receptor, neuron, and nuclear labeling (blue; DAPI) are shown in D, I, N, and S. Merged DIC images are shown in E, J, O, and T. (U) A schematic diagram of the labellum (28, 33) is compared with a labellar frozen section. Lb-d, distal segment of labellum; Lb-lh, long labellar hair; Lb-p, proximal segment of labellum; Lg, ligula; Lgh, ligular hair; M, microtrichae. (Scale bars, 20 µm.)
Fig. 5.
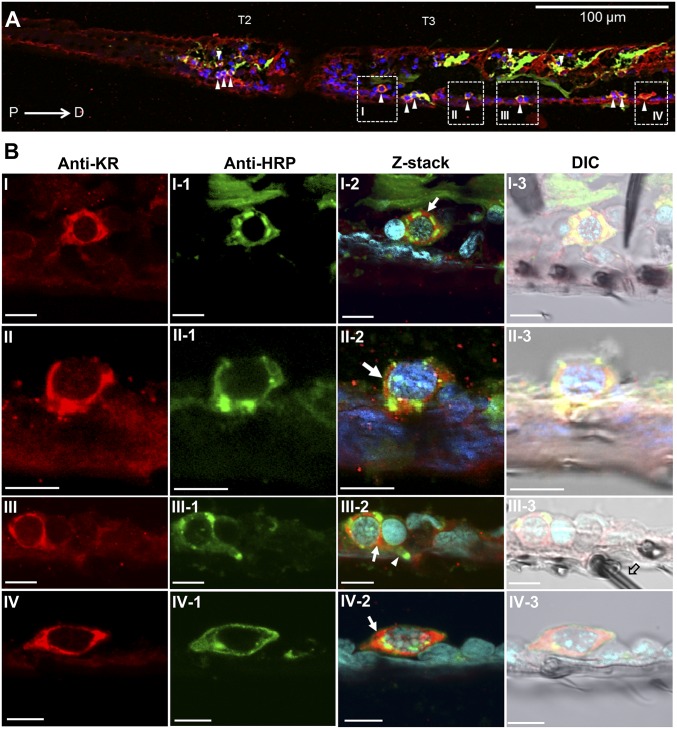
Confocal analyses of the Aedae-KR immunolocalization in prothoracic tarsi. (A) Images of the kinin receptor signal (red, arrowheads) in sensory neurons (green) of the second (T2; four labeled neurons indicated by arrowheads) and third (T3; 10 labeled neurons indicated by arrowheads) tarsomeres. Tarsomeres are oriented from proximal (P) to distal (D) (left to right). The image is an x,y view of a 12.32-μm Z-stack (eight Z-steps, each 1.54 μm). (B) Images from the areas within the areas denoted by dashed boxes I–IV in A, taken using a 100×/1.4 oil immersion objective. The first two columns (B, I–IV and B, I-1–IV-1) show the red kinin receptor signal in the plasma membrane (B, I–IV) and cytoplasm of sensory neurons (green in B, I-1–IV-1). The merged images (Z-stack, B, I-2–IV-2) show receptor signal overlapping in neurons (red over green; arrows); nuclei appear blue. The DIC merged images in B, I-3–IV-3 show tarsal sensilla hairs and sockets very close to the receptor-labeled neurons. A receptor-expressing sensory neuron extends its dendrite (green; arrowhead in B, III-2) into a sensillum trichodea (open arrow in B, III-3). The first two columns (Anti-KR, Anti-HRP) show single sections (x,y); the last two columns show respective Z-stacks, as follows: B, I-2, 24 sections, Z-step: 0.25 μm; B, II-2, 12 sections, Z-step: 0.41 μm; B, III-2, 14 sections, Z-step: 0.41 μm; and B, IV-2, 31 sections, Z-step: 0.25 μm. (Scale bars, 5 µm.)
Fig. S10.
Negative controls for the immunolocalization of Aedae-KR in female prothoracic tarsal sensory neurons. Neurons appear in green (anti-HRP). No receptor signal in tarsi was observed with antigen-preabsorbed anti–KR-Ct328–345 antibody (A–C) or preimmune antibody (D–F). (Scale bars, 20 µm.)
The Aedae-KR was immunolocalized in prothoracic tarsal sensory neurons in the second and third tarsomeres (Fig. 5A). Both tarsomeres exhibited a number of immunoreactive neurons along their proximal–distal axis; these neurons have somas that are strongly labeled by the anti–Aedae-KR antibody (anti-KR) and are close to the cuticle (Fig. 5B). Aedae-KR sensory neurons in tarsi appear to extend their dendrites (Fig. 5 B, III-2) into sensilla trichodea (Fig. 5 B, III-3). Negative control tarsal tissues, incubated with either antigen preabsorbed antibodies (Fig. S10 A–C) or preimmune serum (Fig. S10 D–F) did not show any receptor signal, as expected.
Effects of Aedae-KR Gene Silencing on Feeding Behavior.
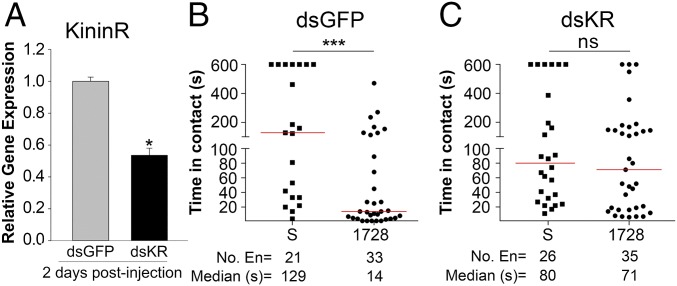
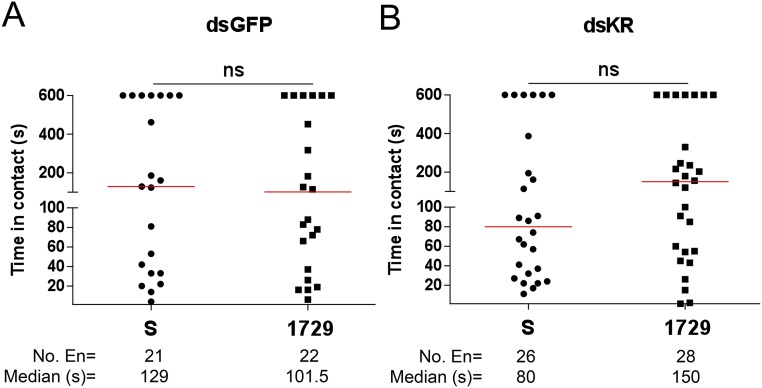
Gene silencing was performed to confirm that the mosquitoes’ aversive behavior to the 1728 analog was mediated by the kinin receptor function in peripheral organs (Figs. 4 and 5). Two days postinjection of dsRNA, Aedae-KR expression was significantly reduced by 52% compared with control dsGFP-injected mosquitoes (Fig. 6A). In no-choice feeding assays with kinin analogs, control dsGFP females demonstrated aversive behavior to kinin analog 1728 at 1 mM (Fig. 6B), similar to that observed in naive 1728-challenged females (Fig. 1). In contrast, KR-silenced females no longer displayed the aversive behavior while probing and touching diets containing analog 1728 at a concentration of 1 mM (Fig. 6C). Consequently, the median time those silenced females spent in contact with the diet containing 1-mM analog 1728 (71 s) was similar to the time silenced females spent in contact with the sucrose solution (80 s) (Fig. 6C), suggesting that the KR is directly responsible for the aversion phenotype of the 1728 analog. Similarly, KR-silenced females exposed to analog 1729 at 1 mM did not display significant differences from those exposed to sucrose solution. Although no significant differences were found for the dsGFP females, a trend toward shorter time in contact with analog 1729 was observed for the dsGFP-silenced females (1729: 101.5 s vs. S: 129 s) (Fig. S11), as we had observed previously (Fig. 1).
Fig. 6.
Silencing of the Aedae-KR eliminates the aversive behavior elicited by contact with the 1728 kinin analog. (A) Relative gene expression was measured by quantitative RT-PCR (RT-qPCR) in control (dsGFP) and KR-silenced mosquitoes at 2 d postinjection. Aedae-KR expression was reduced significantly (∼52%). Data are shown as the mean of three independent experiments ± SEM. (B) Median time control dsGFP-injected mosquitoes spent in contact with sucrose solution or the kinin analog 1728 at a 1-mM concentration. (C) Median time dsKR-injected mosquitoes spent in contact with sucrose or kinin analog 1728 at a 1-mM concentration. Asterisks denote significant differences (*P < 0.05, ***P < 0.001); ns, not significant. Statistical analyses were performed using GraphPad Prism with an unpaired t test to assess the efficiency of knockdown and a Mann–Whitney u test to evaluate the time in contact assays (B and C). Three independent RNAi experiments were performed.
Fig. S11.
There is no difference in the median time spent in contact with sucrose solution or kinin analog 1729 at a concentration of 1 mM by females treated with dsGFP (A) or dsKR (B). Data were analyzed using a Mann–Whitney test using GraphPad Prism. Three independent replicates were performed. ns, not significant.
Discussion
In this work, we clearly show, for the first time to our knowledge, that the gustatory detection of sugars is modulated by a neuropeptide directly at the level of peripheral sensory neurons. This finding suggests that kinin analogs interact with G protein-coupled receptors expressed within gustatory sensilla similar to the way that peripheral olfactory neurons are modulated by tachykinin (16, 17) and neuropeptide F (18–20). These peptides bind to GPCRs in olfactory receptor neurons (ORNs) or in circuits that modulate chemosensory signal-dependent feeding behaviors and food search (21). Here we provide, for the first time to our knowledge, evidence that neuropeptide GPCRs are expressed in taste peripheral neurons and that activating these GPCRs with kinin analogs changes the sensitivity of these neurons to sucrose.
Most mechanistic studies on insect kinins have been conducted with dipterans, Drosophila melanogaster and mosquitoes. Drosophila kinin is named “drosokinin” or “leucokinin” (lk) (22). Three pairs of lk subesophageal neurons (SELKs) receive projections from gustatory receptor neurons in the head (23, 24). Peripheral drosokinin expression was found in sensory cells associated with tarsal sensilla (bristle sensilla) and in labellum by monitoring GFP expression driven by an lk-specific GAL4 line (23). Transgenic flies in which drosokinin release was blocked from the brain lateral horn (LHLK) and SELKs had altered olfactory and gustatory responses, respectively (24). Previous reports have questioned the significance of the lk system in taste perception in legs and labellum (25), based on the lack of GFP in mouthparts and legs in driver lines. The GFP-expressing cells shown by de Haro et al. (23) did not have the appearance of sensory neurons, and mutant flies did not display defects in the gustatory detection of sucrose (25). Therefore the significance of the kinin signaling system in peripheral taste sensory function in Drosophila is still controversial. There is no information about the peripheral functions of kinin neurotransmission in mosquitoes or about behavioral responses to altered kinin signaling in putative “leucokinin” or “leucokinin-responsive” sensory cells in labellum and legs.
Here, we exposed mosquitoes to sucrose solutions containing potent and biostable insect kinin analogs that are lethal to aphids and that are active on the recombinant Aedae-KR (12, 26). Floral nectar, which is fed upon by diurnal mosquitoes such as A. aegypti, contains ∼55% sucrose, and both sexes prefer disaccharides, sucrose and trehalose, over monosaccharides (27). Because most individuals accept a sucrose-only diet, we used a sucrose solution as a driver for providing the kinin analogs (27).
We discovered a previously unidentified function of the kinin-signaling system in mosquitoes in the rapid aversive response to the tasting/feeding of sucrose containing a kinin agonist, 1728, in 300 mM sucrose. The kinin analog 1728 contains pentapeptide kinin core residues (Phe-X1-X2-Trp-Gly-NH2) identical to those of drosokinin (22), further supporting the role of insect kinins in chemosensory responses for taste perception of sugars, similar to that reported for trehalose in adult Drosophila (24). Before feeding, females normally touched diets with their labellum and tarsi but quickly avoided the agonist 1728 at 1 mM by flying, jumping, or walking away (Fig. 1 and Movie S1). Results from CAFE assays corroborated the observations that females significantly rejected this diet and also ate less diet with analog 1728 at 600 µM (Fig. 2). This aversion also was reflected in plate assays showing that at these concentrations females retained less Evans blue (Fig. S3 A and B) and deposited fewer urine drops (Fig. S4). Similar results were obtained for analog 1729 at 1 mM in CAFE assays, but in plate assays the differences among analog concentrations in remaining Evans blue (Fig. S3 A and Inset II) and in the number of urine drops deposited (Fig. S4 B and Inset II) were not detected after 5 h. We then investigated if the aversive response to 1728 was correlated to the expression of the Aedae-KR in chemosensory appendages. The Aedae-KR immunostaining observed in the distal labellum (Fig. 4 and Figs. S8 and S9) coincides with dendrites of sensory neurons in the long labellar sensilla. These A. aegypti labellar hairs, from which recordings were also obtained (Fig. 3A and Figs. S5A, S8A, and S9A), are identical to the long labellar sensilla described in A. aegypti (28, 29) and are similar to the long labellar sensilla (trichoid) of Anopheles gambiae (30) and Culiseta inornata (31, 32). Accessory cells surrounding sensory neurons immunostained for the Aedae-KR could be the trichogen or tormogen (30, 33), because these cells are believed to secrete the dendrite bathing fluid (34, 35). The Aedae-KR staining at the sensilla base is reminiscent of accessory cells associated with sensory neurons in the proboscis of Anopheles stephensi, a mosquito vector of malaria (36).
We show that the Aedae-KR is expressed in sensory neurons associated with sensilla (Fig. 3 B, III-3) in the tarsi, where it was associated with tarsal sensilla trichodea (Fig. 3 B, III-2 and III-3). However, we cannot exclude the possibility that the receptor is present in neurons housed by other types of sensilla (37, 38). The Aedae-KR transcript expression and receptor localization in tarsi and in the distal segment of the labellum strongly linked the observation of the shorter time females spent in contact with diet containing analog 1728 in feeding assays to the specific action of the kinin analog on the Aedae-KR. We performed single-sensilla recordings of long labellar sensilla in which the receptor was immunolocalized (Fig. 3A). Because A. aegypti prefer sucrose solutions of 100 mM or higher, a 300-mM sucrose solution was chosen for assays (27). Electrophysiological recordings on the long labellar sensillum of female A. gambiae showed that responses of the sucrose receptor cell reached a plateau at sucrose concentrations of 25–292 mM (10% sucrose) (30). We found that kinin analogs of diverse chemical structure inhibited the firing of neurons in response to sucrose in the female labellum (Fig. 3). The number of spikes per second decreased significantly in response to all three analogs at 1-mM concentrations, although 1728 appears to be the most potent (Fig. 3B). These results are consistent with the observation of reduced feeding of sucrose plus analog 1728 (Fig. 2). Moreover, using RNAi-mediated gene knockdown, we verified the fundamental role of Aedae-KR in mediating the aversive behavior resulting from contact with the 1728 analog. Females with silenced Aedae-KR no longer display aversive behavior in response to the 1728 analog at 1 mM (Fig. 6). This result strongly supports our conclusion that Aedae-KR expressed in sensory peripheral organs plays an important role in the control of feeding behavior. The kinin analogs tested have been characterized extensively in vitro and in vivo for their activity on insect kinin receptors. Two types of kinin analog structures were tested, the first containing α-amino isobutyric acid (Aib) (analogs 1728 and 1729) and the second containing β3Pro (analog 1460) (Fig. S1). All activate recombinant mosquito and tick kinin receptors in CHO-K1 cells, with 1728 being the most potent on the Aedae-KR (EC50, 76 nM), followed by 1460 (EC50, 367 nM) and 1729 (EC50, 625 nM) (12, 26). Analogs 1728 and 1460 (12, 26) also have potent diuretic activity in the Malpighian tubules of A. aegypti in vitro (8). Although both the Aib-containing analogs 1728 and 1729 elicit hindgut contractions in Rhodnius; 1728 is more potent (39). Structural modifications of insect kinins, such as the incorporation of Aib and β-amino acids with an additional methylene group (-CH2-), render these peptides biostable, because they are protease resistant (8, 10–12, 26). Our hypothesis is that the potent analog 1728 enters the labellar and tarsal sensilla (30) and diffuses through the aqueous sensillum lymph to activate the Aedae-KR expressed in sucrose taste neurons, thereby decreasing sucrose taste perception. We are not certain why analog 1728 elicits fast walk-, fly-, or jump-away behaviors (Movie S1) that are not observed for either analog 1729 or 1460, which also inhibit the sucrose response, although with less potency (Fig. 3C). It is possible that analog 1728 may stabilize the Aedae-KR in a specific conformation by homologous functional selectivity (biased agonism) (8). It is known that aedeskinins hyperpolarize the basolateral membrane voltage by increasing the chloride conductance of Malpighian tubule cells in A. aegypti (8, 40). A simple speculative explanation is that, acting via the Aedae-KR, analog 1728 changes the chloride concentration in the sensillum lymph, thus affecting the chloride channels involved in the repolarization of gustatory neurons and making the sucrose receptor cells insensitive (41). There is a lack of knowledge regarding chemosensory reception in mosquito leg sensilla. Our finding of the Aedae-KR in sensilla trichodea is supported by earlier studies showing that tarsal sensilla trichodea are involved in mosquito gustatory behaviors associated with sugar (42). In Drosophila the mapping of taste sensilla in tarsomeres revealed specific sensilla in tarsomeres 5–2 that detect sugars (43). Such a detailed map does not exist for any mosquito species. Our work contributes to the understanding of taste in mosquitoes by providing a receptor marker for a subpopulation of sensory cells in tarsi that can be pharmacologically manipulated and now can be explored further.
Our results pertaining to Aedae-KR peripheral function may extend the current knowledge about the modulation of ORNs by GPCRs in olfactory systems (discussed above) to those of chemosensory neural networks in taste organs such as labellum and legs, for which less information is available. Our pharmacological manipulation of the Aedae-KR by an externally applied synthetic molecule provides proof of principle for the search of environmental deterrents (or repellents) modulating GPCRs in peripheral sensory neurons. Further, it demonstrates that these analogs are valuable tools for investigating how peripheral chemosensory systems define insect behavior. In mosquitoes the leucokinin system in peripheral organs appears to be involved in a behavioral avoidance mechanism in the context of sucrose feeding, in addition to its known role in the hormonal control of water and ion homeostasis. This avoidance mechanism could be present in other pests and might be exploited for their control.
Materials and Methods
Mosquito rearing was as described in ref. 5. Details of mosquito rearing, kinin analogs, no-choice feeding assays with kinin analogs, frozen-section immunohistochemistry of Aedae-KR in labellum and prothoracic tarsi, electrophysiological recordings on labellar long hair sensilla, the effects of gene silencing on feeding behavior, dsRNA synthesis and the efficiency of knockdown, and statistical analyses are provided in SI Materials and Methods. The structures and synthesis of analogs are shown in Fig. S1. Primers are listed in Table S1.
Table S1.
Primers used for cloning and RNAi of Aedae-KR
| Primers | Primer sequences |
| Primers for PCR | |
| Aedaekinin 5′ UTR 0 | 5′-GGAATACCAAATTATCTACAAGAATGCGA-3′ |
| Aedaekinin 3′ UTR 1 | 5′-TGGTTCAAATTCTACAAGTTGTTAATGTGC-3′ |
| AedaekininF2 | 5′-AACGAGAATTCCACAAGCGATATCCGTTCC-3′ |
| AedaekininR2 | 5′-AAGTCCGGGTAGAGTTTTGCCGACATGG-3′ |
| AedaekininF3 | 5′-CAAGTGTTGTCCATGTCGGCAAAACTCTACC-3′ |
| AedaekininR3 | 5′-GGAACGGATATCGCTTGTGGAATTCTCG-3′ |
| Aedaekinin5′UTR | 5′-TTAGCTGTCGTATGTATCAACACGGATCATTG-3′ |
| Aedaekinin3′UTR0 | 5′-GATTTTCTCATTAACTAGGGTAAGTGTACC-3′ |
| Aedaekinin 5′UTR0 | 5′-GGAATACCAAATTATCTACAAGAATGCGA-3′ |
| Aedaekinin 3′UTR1 | 5′-TGGTTCAAATTCTACAAGTTGTTAATGTGC-3′ |
| Primers for syntheses of dsRNA | |
| AedaekininT7F | 5′-TAATACGACTCACTATAGGGTGTATCAACACGGATCATTGCATGGAATGGC-3′ |
| AedaekininT7R | 5′-TAATACGACTCACTATAGGGCATCGCTGCCGTTCAGTGTATTGTTGTTTGC-3′ |
| GFPT7F | 5′-TTAATACGACTCACTATAGGGAGAATGGTGAGCAAGGGCGAGGAGCTGT-3′ |
| GFPT7R | 5′-TTAATACGACTCACTATAGGGAGATTACTTGTACAGCTCGTCCATGCC-3′ |
| Primers for qPCR | |
| AedaekininQPCRF | 5′-CGAGAATTCCACAAGCGATA-3′ |
| AedaekininQPCRR | 5′-ACTGCTCCTGGTGGTAGCTT-3′ |
| Aedae18SRQPCRF | 5′-CCTTCAACAAGGATCAAGTGG-3′ |
| Aedae18SRQPCRR | 5′-GGAGTAGCACCCGTGTTGG-3′ |
Underlined sequences indicate T7 polymerase promoter.
SI Materials and Methods
Mosquito Rearing.
Larvae of A. aegypti (Diptera: Culicidae), Rockefeller strain, were reared at 26.5 °C under a 16-h light:8-h dark photoperiod in plastic trays (30 × 20 × 9 cm) with 2 L water. To obtain mosquitoes of consistent size, each pan contained ∼200 larvae. Larvae were fed with Purina One Natural Blends (Nestle Purina PetCare). Pupae were kept in water in cups, which were placed in cages for adult emergence. Adults were fed using cotton wicks soaked in a 10% sugar solution (5).
Synthesis of Kinin Analogs.
Insect kinin analogs containing Aib (1728 and 1729) or β-amino acid (1460) were synthesized as previously described (Fig. S1) (12, 26). Kinin analogs were solubilized in 100 µL of 80% acetonitrile containing 0.01% trifluoroacetic acid and were vacuum-dried and kept at −20 °C until use.
No-Choice Feeding Assays with Kinin Analogs.
To determine whether agonist kinin analogs 1728 and 1729 have any adverse effect on mosquito females, these analogs were provided in a sucrose solution containing Evans blue (12, 26). Non–blood-fed (NBF) 3- to 5-d-old females were used for all feeding assays.
CAFE assays.
Female mosquitoes were starved for 48 h but were provided access to water via a cotton wick inserted in a 25-mL flask. They were transferred by groups of five into fly glass vials. The vials were closed with a shortened plug, into which we inserted a single 5-µL calibrated capillary (32 mm in length) (VWR International) filled with the test solution. Each test solution contained 300 mM sucrose, 0.06% Evans blue, and kinin 1728 or 1729 at 0, 0.1, 0.3, 0.6, or 1 mM. The pH of the 1-mM solution of analog 1728 was <7 and ≥6.5. One tube was prepared with a capillary containing only sugar and Evans blue, without mosquitoes, to evaluate evaporation. Tubes were kept in a Plexiglas chamber at ∼80% humidity and 26.7 °C. A picture of the group of tubes was taken at the beginning and at the end of the experiment. The volume of liquid in each capillary was measured using a ruler under ImageJ (44). The volume of liquid that disappeared during the observation period was converted into microliters per insect per hour. To evaluate better the effect of the analogs on actual feeding, we selected assays in which the volume of sugar solution that disappeared in the presence of mosquitoes was at least 1.5 times the volume of solution that disappeared in their absence (e.g., because of evaporation). For analog 1728 the results were analyzed by a one-way ANOVA (after checking normality with a Shapiro–Wilk test) followed by Dunnett’s multiple comparisons to the amount of liquid consumed in the sucrose-only treatment (45). For analog 1729 the results were analyzed by nonparametric Kruskal–Wallis ANOVA followed by Dunn’s multiple comparison test.
Plate assays.
Analogs were solubilized in 50 µL of 10% sucrose solution containing 0.1% Evans blue (Alfa Aesar), pH 7.0 (hereafter referred to as “sucrose solution”). These assays were performed to evaluate the independent effect of each kinin analog. Diets were prepared by mixing 10% sucrose with either analog 1728 or 1729 (at 1 mM, 600 µM, 300 µM, 100 µM, 10 µM, or 1 µM). Twenty females were introduced into Petri dishes (100 × 15 mm) containing a single drop (50 µL) of one of the analogs at each concentration and one Petri dish containing only sucrose solution as control plate, making a total of seven plates per analog replicate. Three independent series were performed for each analog. Females’ behavior in these feeding assays toward the kinin analogs 1728 and 1729 at 1 mM and 600 µM and toward the sucrose solution was videotaped for 1 h, and the time that elapsed from the onset of touching the solution [with the leg(s), the proboscis, or both] to flying or walking away from it was recorded. Data for the time spent in contact with the diets in plates containing analogs at 1 mM and 600 µM and sucrose solution were compared. At the end point (5 h) of these experiments, the total number of excreted drops (observed as blue deposits on the Petri plates) on the treatment plates of analogs 1728 and 1729 at 1 mM and 600 μM and the control sucrose solution was counted under a dissecting microscope (Fig. S4).
Additionally, for each plate, the remaining amount of ingested Evans blue in the 20 females was determined by their homogenization as a pool in 1 mL N, N-dimethyl formamide and incubation at 50 °C for 18 h (46). The samples’ OD at 620 nm was measured with a VersaMAX tunable microplate reader (Molecular Devices) and compared with those of an Evans blue standard curve (0.001–0.5 mg/mL).
Electrophysiological Recordings on Labellar Long Hair Sensilla.
Females used for electrophysiology were a kind gift from Louis Lambrechts (Institut Pasteur, Paris). For electrophysiological experiments, 3- to 5-d-old females were anesthetized by being placed on ice for 1–2 min and then were immobilized sideways on putty (UHU patafix) using fine strips of tape placed over the body and the mouthparts to expose the 30- to 35-μm-long sensilla present at the tip of the proboscis, as in A. gambiae (Fig. S5A) (30). Recordings were obtained from dorsal and ventral long labellar hairs nos. 3–9, as mapped by Hill and Smith (28). The insect was grounded using a drop of electrocardiogram gel placed on the abdomen and was connected to a grounded silver wire (0.15 mm in diameter) (Fig. S5A). To stimulate individual taste sensilla, each sensillum was covered in turn by a capillary electrode (tip diameter 10 µm) (Fig. S5A) filled with the chemical to be tested and 30 mM tricholine citrate (TCC) (Sigma-Aldrich) in distilled water. TCC acts as an electrolyte and inhibits the activity of the water cells (47). We observed no significant response to this control solution (Fig. S5B). Because pilot experiments showed that Evans blue was inactive (Fig. S5C), we tested kinin analogs alone. The stimulus electrode was brought into contact with the sensillum for 2 s under visual control (Leica MZ12) with a micromanipulator (NMN-25; Narishige). The capillary touching the tip of a taste sensillum established an electrical contact. The signal was recorded through a nonblocking taste preamplifier (Tasteprobe DTP-02; Syntech) (48) connected to an amplifier (CyberAmp 320; Axon Instruments), where the signal was amplified further (100–1,000×) and filtered (eighth order Bessel filter, 10–2,800 Hz), digitized (16 bits, 10 kHz: A/D card DT9803; Data Translation), and stored on a disk for further analysis using a custom program (dbWave) (49). The number of action potentials in each recording was detected using a variable threshold adjusted over the digitally filtered recording (using a running median computed over 30 points on each side) and was exported to Excel for further analysis either as the number of spikes per second or by 100-ms bins.
mRNA Isolation and Cloning of Aedae-KR from Labellum and Legs.
Labella were dissected from 3- to 5-d-old NBF females (n = 210). After the tissues were ground in liquid nitrogen, total RNA was isolated following the protocol of the NucleoSpin RNA manufacturer (Macherey–Nagel). Total RNA (0.1 µg) was used to synthesize 3′ RACE cDNA with the SMARTer RACE cDNA amplification kit (Clontech Laboratories). To obtain the full-length ORF cDNA of Aedae-KR from labellum, a PCR amplification was performed using the RACE cDNA with the primers Aedaekinin5′UTR0 and Aedaekinin3′UTR1 (see Table S1 for the primers used in this section). The PCR program was as follows: 94 °C for 5 min; 40 cycles of 94 °C for 30 s; 59 °C for 1 min; 72 °C for 2 min; and a final extension at 72 °C for 5 min. The three pairs of legs from 3- to 5-d-old female (n = 50) and male (n = 50) mosquitoes were dissected, and mRNA was isolated following the protocol given in the Dynabeads mRNA Direct Kit (Invitrogen). Before the addition of lysate buffer (250 µL) the legs were ground in liquid nitrogen. After mRNA elution, single-strand cDNA was synthesized using SuperScript III reverse transcriptase (200 U/µL) (Invitrogen). The cloning strategy to obtain the full-length cDNA from legs involved obtaining three PCR products. All PCR products were cloned in a TOPO TA cloning kit (Invitrogen) and were sequenced at the Gene Technologies Laboratory of Texas A&M University. First, the ORF of Aedae-KR after the seventh transmembrane region (TM#7) was amplified from these cDNA templates with AedaekininF2 and AedaekininR2 primers designed within the predicted ORF. PCR amplifications were performed with 94 °C for 5 min; 40 cycles of 94 °C for 30 s; 59 °C for 1 min; 72 °C for 2 min; and a final extension at 72 °C for 5 min. A product of the expected size (393 bp) was obtained. In addition, RACE cDNA was synthesized from mRNA isolated from female legs using the SMARTer RACE cDNA amplification kit (Clontech Laboratories). To obtain the 3′ UTR and 5′ UTR sequences of Aedae-KR, a first amplification was performed using the RACE cDNAs with universal primer mix (adaptor primer) and AedaekininF2 and AedaekininR2 primers for the 3′ and 5′ UTRs, respectively. Amplified PCR products were diluted (1:25) and used for a nested amplification with universal nest primer mix and AedaekininF3 for the 3′ UTR (the product obtained was 917 bp) and AedaekininR3 for the 5′ UTR (the product obtained was 1,861 bp). PCR conditions for both amplifications were 94 °C for 5 min; 40 cycles of 94 °C for 30 s; 61 °C for 1 min; and 72 °C for 2 min, with a final extension at 72 °C for 5 min. To obtain the ORF cDNA of Aedae-KR from legs in a single PCR product, either RACE cDNA from female legs or regular cDNA from male legs was amplified with the primers Aedaekinin5′UTR and Aedaekinin3′UTR0. PCR conditions were 94 °C for 5 min; 40 cycles of 94 °C for 30 s; 59 °C for 1 min; and 72 °C for 2 min, with a final extension at 72 °C for 5 min. Diluted PCR products (1:25) were used for a nested amplification with primers Aedaekinin5′UTR0 and Aedaekinin3′UTR1. PCR conditions were 94 °C for 5 min; 40 cycles of 94 °C for 30 s; 54 °C for 1 min; and 72 °C for 2 min, with a final extension at 72 °C for 5 min. The ORF was 1,789 bp.
Frozen-Section Immunohistochemistry of Aedae-KR in Labellum and Prothoracic Tarsi.
Preparation of the anti–Aedae-KR antibody (anti-KR-Ct328-345, NEKFKREFHKRYPF RGRN) (5) and immunostaining procedures were performed as described in refs. 50 and 51, with modifications. Labellum and prothoracic tarsi were removed from 3- to 5-d-old NBF females (n = 230) and were fixed in 2% paraformaldehyde in PBS plus 0.1% Triton X-100 (PBST) for 1 h at 4 °C. After being washed in PBS at room temperature, the tissues were infiltrated with 12% sucrose in PBST for 8 h and for an additional 8 h with 25% sucrose in PBST (both steps at 4 °C). They then were embedded in Tissue-Tek optimum cutting temperature (O.C.T.) compound (Ted Pella) at room temperature for 10 min and were placed immediately inside the cryostat at −20 °C for at least 5 min. Frozen sections (14 µm) were cut at −20 °C with a Leica Cryostat (Leica Microsystems) and were collected with a small brush on ColorFrost Plus microscope slides (Fisher Scientific). The sections on slides were dried at 37 °C for 24 h and were fixed by immersion in 4% paraformaldehyde in PBST for 30 min. After washing for 3 × 5 min in PBST, the sections were incubated with blocking solution (PBST, 5% normal goat serum) for 1 h at room temperature. The sections were incubated with either anti–KR-Ct328–345 (1:10 in blocking solution, 115 µg IgG/mL) or anti–KR-Ct328–345 preabsorbed antibody or preimmune serum (1:2,000) at 4 °C, overnight (7). The preabsorbed antibody was prepared in blocking solution with 500 µg kinin C-terminal peptide (amino acid residues 328–345 in the receptor sequence; see above) per 40 µg antibody (∼1,000 molar excess). Neurons were labeled with Alexa Fluor 488-AffiniPure goat anti-HRP antibody (3 µg IgG/mL; 1:500 in blocking solution) (Jackson ImmunoResearch) at 4 °C, overnight (in coincubation with primary antibody) (52). After washing for 4 × 20 min in PBST, the sections were incubated with biotinylated goat anti-rabbit IgG (8.5 µg/mL; 1:200) (Jackson ImmunoResearch) in blocking solution for 2 h at room temperature. Sections were washed 4 × 20 min in PBST, incubated with Alexa Fluor 546 and streptavidin (10 µg IgG/mL; 1:200) (Invitrogen) in blocking solution at room temperature for 1 h, and then washed 6 × 30 min in PBST. Tissues were mounted with Vectashield Mounting Medium with DAPI (Vector), and images were obtained with either a Carl Zeiss Axio Imager A1 microscope (Carl Zeiss MicroImaging) or an Olympus FV1000 confocal microscope (Olympus America Inc.) at the Microscopy and Imaging Center at Texas A&M University.
Effects of Gene Silencing on Feeding Behavior.
dsRNA synthesis and gene silencing.
The N terminus of Aedae-KR sequenced from female’s legs was chosen as the target region of dsRNA. Specific primers flanked with the T7 promoter sequence were designed to amplify T7 DNA templates of Aedae-KR and GFP (Table S1). The MEGAscript RNAi kit (Life Technologies) was used for syntheses of dsRNA following the manufacturer’s instructions. The dsRNA product was precipitated with ammonium acetate-ethanol and resolubilized in nuclease-free water to 5 µg/µL. One-day-old NBF females anesthetized on ice were injected in the thorax with ∼800 ng of dsRNA.
RNAi evaluation by RT-qPCR.
Females (n = 20) at 2 d postinjection with dsRNA were homogenized in TRIzol reagent (Life Technologies), according to the manufacturer’s protocol, to isolate total RNA. The isolated RNA was purified further with the RNA Clean & Concentrator-5 kit (Zymo Research) and was quantified using a NanoDrop spectrophotometer. cDNA was synthesized using the RevertAid First Strand cDNA Synthesis Kit (Thermo Scientific) using 1 µg total RNA. Expression of Aedae-KR was evaluated using either gene-specific primers or 18S rRNA primers (Table S1) (7). RT-qPCR was performed using the QuantStudio 3 Real-Time PCR System (Thermo Scientific) with PowerUp SYBR Green Master Mix (Thermo Scientific). A comparative cycle threshold (2−ΔΔCt) method was used to assess relative transcript level (53).
RNAi evaluation by no-choice plate-feeding assay.
Five days postinjection, dsGFP- or dsKR-injected female mosquitoes (n = 20 per treatment) were transferred into a Petri dish (100 × 15 mm) after overnight starvation and were challenged with sucrose or a sucrose solution containing one of the kinin analogs at 1 mM as described above. The females’ feeding behaviors were videorecorded during the first hour to evaluate the time spent in contact with the diet (from the onset of touching the diet to leaving it) at 27 °C and 80% relative humidity.
Statistical Analyses.
Feeding bioassays were performed in three independent replicates. The time spent in contact with kinin analogs 1728 or 1729 at 1 mM and at 600 µM or sucrose solution was analyzed by a nonparametric one-way ANOVA (Fig. 1) with GraphPad Prism 5.0 (GraphPad, Inc.). The treatment effect on the volume of Evans blue remaining per female was analyzed with the IBM SPSS Statistics 21 (SPSS, Inc.). Initially all data were analyzed by the univariate general linear model (GLM) considering analogs (1728 and 1729) and concentrations of analogs (1–1,000 µM) as independent variables (factors). Subsequently we analyzed these data by one-way ANOVAs, followed by Tukey's honestly significant difference (HSD) test, as follows. First, for treatment effects, the two analogs 1728 and 1729 and sucrose solution treatments were compared when analogs were given at the same concentration (independent ANOVAs from Fig. S3 A–F). Second, data for different concentrations of the same treatment (within-treatment concentration comparisons for analogs 1728 and 1729 and to sucrose) were compared by running two independent ANOVAs (Fig. S3, Insets I and II). Treatment effect on the number of deposited urine drops after 5 h (Fig. S4) was analyzed by a nonparametric one-way ANOVA followed by the Kruskal–Wallis ranks test (GraphPad Prism 5.0). For analyses of electrophysiological recordings from long labellar sensilla (Fig. 3A), repeated-measures analysis of data (the number of spikes during the first second of 2-s recordings) was performed using the PROC GLMM Tukey–Kramer test. Data were analyzed by SAS 9.4 software (SAS Institute Inc.).
Supplementary Material
Acknowledgments
We thank Drs. S. Vitha (Texas A&M University Microscopy and Imaging Center); L. Zwiebel for the anti-ORCO 7 antibody used in initial tests; L. Lambrechts (Institut Pasteur, Paris) for the mosquitoes used for electrophysiology; and the Biology Information Technology staff at Iowa State University. Analyses were funded by an award from the Texas A&M University Statistics Department. Drawings were a gift of Ms. H. J. Oh. H.K. was supported by a Vector Biology Grant from Texas AgriLife Research (to P.V.P.). P.V.P. was supported by National Institute of Food and Agriculture-Hatch Act funding. R.J.N. received support from US Department of Agriculture/Department of Defense Deployed War-Fighter Protection Initiative 6202-22000-029-00D. M.A.A. and F.M.-P. were supported by the French National Research Agency Program DESIRABLE ANR-12-ALID-0001. R.C.S. received funds from the Agricultural Experiment Station at Iowa State University.
Footnotes
The authors declare no conflict of interest.
This article is a PNAS Direct Submission. F.G.N. is a Guest Editor invited by the Editorial Board.
This article contains supporting information online at www.pnas.org/lookup/suppl/doi:10.1073/pnas.1520404113/-/DCSupplemental.
References
- 1.Morrison AC, Zielinski-Gutierrez E, Scott TW, Rosenberg R. Defining challenges and proposing solutions for control of the virus vector Aedes aegypti. PLoS Med. 2008;5(3):e68. doi: 10.1371/journal.pmed.0050068. [DOI] [PMC free article] [PubMed] [Google Scholar]
- 2.Garrett-Jones C, Shidrawi GR. Malaria vectorial capacity of a population of Anopheles gambiae: An exercise in epidemiological entomology. Bull World Health Organ. 1969;40(4):531–545. [PMC free article] [PubMed] [Google Scholar]
- 3.Hernández-Martínez S, Rivera-Perez C, Nouzova M, Noriega FG. Coordinated changes in JH biosynthesis and JH hemolymph titers in Aedes aegypti mosquitoes. J Insect Physiol. 2015;72:22–27. doi: 10.1016/j.jinsphys.2014.11.003. [DOI] [PMC free article] [PubMed] [Google Scholar]
- 4.Coast GM. Neuropeptides implicated in the control of diuresis in insects. Peptides. 1996;17(2):327–336. doi: 10.1016/0196-9781(95)02096-9. [DOI] [PubMed] [Google Scholar]
- 5.Lu HL, Kersch C, Pietrantonio PV. The kinin receptor is expressed in the Malpighian tubule stellate cells in the mosquito Aedes aegypti (L.): A new model needed to explain ion transport? Insect Biochem Mol Biol. 2011;41(2):135–140. doi: 10.1016/j.ibmb.2010.10.003. [DOI] [PMC free article] [PubMed] [Google Scholar]
- 6.Veenstra JA, Pattillo JM, Petzel DH. A single cDNA encodes all three Aedes leucokinins, which stimulate both fluid secretion by the malpighian tubules and hindgut contractions. J Biol Chem. 1997;272(16):10402–10407. doi: 10.1074/jbc.272.16.10402. [DOI] [PubMed] [Google Scholar]
- 7.Kersch CN, Pietrantonio PV. Mosquito Aedes aegypti (L.) leucokinin receptor is critical for in vivo fluid excretion post blood feeding. FEBS Lett. 2011;585(22):3507–3512. doi: 10.1016/j.febslet.2011.10.001. [DOI] [PubMed] [Google Scholar]
- 8.Schepel SA, et al. The single kinin receptor signals to separate and independent physiological pathways in Malpighian tubules of the yellow fever mosquito. Am J Physiol Regul Integr Comp Physiol. 2010;299(2):R612–R622. doi: 10.1152/ajpregu.00068.2010. [DOI] [PMC free article] [PubMed] [Google Scholar]
- 9.Pietrantonio PV, Jagge C, Taneja-Bageshwar S, Nachman RJ, Barhoumi R. The mosquito Aedes aegypti (L.) leucokinin receptor is a multiligand receptor for the three Aedes kinins. Insect Mol Biol. 2005;14(1):55–67. doi: 10.1111/j.1365-2583.2004.00531.x. [DOI] [PubMed] [Google Scholar]
- 10.Nachman RJ, et al. Enhanced in vivo activity of peptidase-resistant analogs of the insect kinin neuropeptide family. Peptides. 2002;23(4):735–745. doi: 10.1016/s0196-9781(01)00654-4. [DOI] [PubMed] [Google Scholar]
- 11.Zubrzak P, et al. β-amino acid analogs of an insect neuropeptide feature potent bioactivity and resistance to peptidase hydrolysis. Biopolymers. 2007;88(1):76–82. doi: 10.1002/bip.20638. [DOI] [PubMed] [Google Scholar]
- 12.Taneja-Bageshwar S, et al. Biostable agonists that match or exceed activity of native insect kinins on recombinant arthropod GPCRs. Gen Comp Endocrinol. 2009;162(1):122–128. doi: 10.1016/j.ygcen.2008.10.013. [DOI] [PubMed] [Google Scholar]
- 13.Nachman RJ, et al. A C-terminal aldehyde insect kinin analog enhances inhibition of weight gain and induces significant mortality in Helicoverpa zea larvae. Peptides. 2003;24(10):1615–1621. doi: 10.1016/j.peptides.2003.06.008. [DOI] [PubMed] [Google Scholar]
- 14.Smagghe G, Mahdian K, Zubrzak P, Nachman RJ. Antifeedant activity and high mortality in the pea aphid Acyrthosiphon pisum (Hemiptera: Aphidae) induced by biostable insect kinin analogs. Peptides. 2010;31(3):498–505. doi: 10.1016/j.peptides.2009.07.001. [DOI] [PubMed] [Google Scholar]
- 15.Zhang C, et al. Design, synthesis and aphicidal activity of N-terminal modified insect kinin analogs. Peptides. 2015;68:233–238. doi: 10.1016/j.peptides.2014.07.028. [DOI] [PubMed] [Google Scholar]
- 16.Ignell R, et al. Presynaptic peptidergic modulation of olfactory receptor neurons in Drosophila. Proc Natl Acad Sci USA. 2009;106(31):13070–13075. doi: 10.1073/pnas.0813004106. [DOI] [PMC free article] [PubMed] [Google Scholar]
- 17.Jung JW, et al. Neuromodulation of olfactory sensitivity in the peripheral olfactory organs of the American cockroach, Periplaneta americana. PLoS One. 2013;8(11):e81361. doi: 10.1371/journal.pone.0081361. [DOI] [PMC free article] [PubMed] [Google Scholar]
- 18.Root CM, Ko KI, Jafari A, Wang JW. Presynaptic facilitation by neuropeptide signaling mediates odor-driven food search. Cell. 2011;145(1):133–144. doi: 10.1016/j.cell.2011.02.008. [DOI] [PMC free article] [PubMed] [Google Scholar]
- 19.Siju KP, Hansson BS, Ignell R. Immunocytochemical localization of serotonin in the central and peripheral chemosensory system of mosquitoes. Arthropod Struct Dev. 2008;37(4):248–259. doi: 10.1016/j.asd.2007.12.001. [DOI] [PubMed] [Google Scholar]
- 20.Wang Y, Pu Y, Shen P. Neuropeptide-gated perception of appetitive olfactory inputs in Drosophila larvae. Cell Reports. 2013;3(3):820–830. doi: 10.1016/j.celrep.2013.02.003. [DOI] [PubMed] [Google Scholar]
- 21.Siju KP, et al. Neuropeptides in the antennal lobe of the yellow fever mosquito, Aedes aegypti. J Comp Neurol. 2014;522(3):592–608. doi: 10.1002/cne.23434. [DOI] [PMC free article] [PubMed] [Google Scholar]
- 22.Radford JC, Davies SA, Dow JAT. Systematic G-protein-coupled receptor analysis in Drosophila melanogaster identifies a leucokinin receptor with novel roles. J Biol Chem. 2002;277(41):38810–38817. doi: 10.1074/jbc.M203694200. [DOI] [PubMed] [Google Scholar]
- 23.de Haro M, et al. Detailed analysis of leucokinin-expressing neurons and their candidate functions in the Drosophila nervous system. Cell Tissue Res. 2010;339(2):321–336. doi: 10.1007/s00441-009-0890-y. [DOI] [PubMed] [Google Scholar]
- 24.López-Arias B, Dorado B, Herrero P. Blockade of the release of the neuropeptide leucokinin to determine its possible functions in fly behavior: Chemoreception assays. Peptides. 2011;32(3):545–552. doi: 10.1016/j.peptides.2010.07.002. [DOI] [PubMed] [Google Scholar]
- 25.Al-Anzi B, et al. The leucokinin pathway and its neurons regulate meal size in Drosophila. Curr Biol. 2010;20(11):969–978. doi: 10.1016/j.cub.2010.04.039. [DOI] [PMC free article] [PubMed] [Google Scholar]
- 26.Taneja-Bageshwar S, et al. Identification of selective and non-selective, biostable beta-amino acid agonists of recombinant insect kinin receptors from the southern cattle tick Boophilus microplus and mosquito Aedes aegypti. Peptides. 2008;29(2):302–309. doi: 10.1016/j.peptides.2007.07.034. [DOI] [PubMed] [Google Scholar]
- 27.Ignell R, Okawa S, Englund J-E, Hill SR. Assessment of diet choice by the yellow fever mosquito Aedes aegypti. Physiol Entomol. 2010;35(3):274–286. [Google Scholar]
- 28.Hill SR, Berry Smith JJ. Consistent pattern in the placement of taste sensilla on the labellar lobes of Aedes aegypti. Int J Insect Morphol Embryol. 1999;28(4):281–290. [Google Scholar]
- 29.Hill SR, Hansson BS, Ignell R. Characterization of antennal trichoid sensilla from female southern house mosquito, Culex quinquefasciatus Say. Chem Senses. 2009;34(3):231–252. doi: 10.1093/chemse/bjn080. [DOI] [PubMed] [Google Scholar]
- 30.Kessler S, Vlimant M, Guerin PM. The sugar meal of the African malaria mosquito Anopheles gambiae and how deterrent compounds interfere with it: A behavioural and neurophysiological study. J Exp Biol. 2013;216(Pt 7):1292–1306. doi: 10.1242/jeb.076588. [DOI] [PubMed] [Google Scholar]
- 31.Owen WB, Larsen JR, Pappas LG. Functional units in the labellar chemosensory hairs of the mosquito Culiseta inornata (Williston) J Exp Zool. 1974;188(2):235–247. doi: 10.1002/jez.1401880211. [DOI] [PubMed] [Google Scholar]
- 32.Pappas LG, Larsen JR. Gustatory hairs on the mosquito, Culiseta inornata. J Exp Zool. 1976;196(3):351–360. doi: 10.1002/jez.1401960309. [DOI] [PubMed] [Google Scholar]
- 33.Lee RMKW, Craig DA. Fine structure of the sense organs on the labella and labium of the mosquito Aedes aegypti (L.) Open Entomol J. 2009;3:7–17. [Google Scholar]
- 34.Phillips CE, Vande Berg JS. Mechanism for sensillum fluid flow in trichogen and tormogen cells of Phormia regina (Meigen) (Diptera: Calliphoridae) Int J Insect Morphol Embryol. 1976;5(6):423–431. [Google Scholar]
- 35.Phillips CE, Vande Berg JS. Directional flow of sensillum liquor in blowfly (Phormia regina) labellar chemoreceptors. J Insect Physiol. 1976;22(3):425–429. doi: 10.1016/0022-1910(76)90013-5. [DOI] [PubMed] [Google Scholar]
- 36.Maekawa E, et al. The role of proboscis of the malaria vector mosquito Anopheles stephensi in host-seeking behavior. Parasit Vectors. 2011;4:10. doi: 10.1186/1756-3305-4-10. [DOI] [PMC free article] [PubMed] [Google Scholar]
- 37.McIver S, Siemicki R. Fine structure of tarsal sensilla of Aedes aegypti (L.) (Diptera: Culicidae) J Morphol. 1978;155(2):137–155. doi: 10.1002/jmor.1051550202. [DOI] [PubMed] [Google Scholar]
- 38.Seenivasagan T, et al. Surface morphology and morphometric analysis of sensilla of Asian tiger mosquito, Aedes albopictus (Skuse): An SEM investigation. J Vector Borne Dis. 2009;46(2):125–135. [PubMed] [Google Scholar]
- 39.Bhatt G, da Silva R, Nachman RJ, Orchard I. The molecular characterization of the kinin transcript and the physiological effects of kinins in the blood-gorging insect, Rhodnius prolixus. Peptides. 2014;53:148–158. doi: 10.1016/j.peptides.2013.04.009. [DOI] [PubMed] [Google Scholar]
- 40.O’Connor KR, Beyenbach KW. Chloride channels in apical membrane patches of stellate cells of Malpighian tubules of Aedes aegypti. J Exp Biol. 2001;204(Pt 2):367–378. doi: 10.1242/jeb.204.2.367. [DOI] [PubMed] [Google Scholar]
- 41.Pézier A, et al. Calcium activates a chloride conductance likely involved in olfactory receptor neuron repolarization in the moth Spodoptera littoralis. J Neurosci. 2010;30(18):6323–6333. doi: 10.1523/JNEUROSCI.0261-10.2010. [DOI] [PMC free article] [PubMed] [Google Scholar]
- 42.Pappas LG, Larsen JR. Gustatory mechanisms and sugar-feeding in the mosquito, Culiseta inornata. Physiol Entomol. 1978;3(2):115–119. [Google Scholar]
- 43.Ling F, Dahanukar A, Weiss LA, Kwon JY, Carlson JR. The molecular and cellular basis of taste coding in the legs of Drosophila. J Neurosci. 2014;34(21):7148–7164. doi: 10.1523/JNEUROSCI.0649-14.2014. [DOI] [PMC free article] [PubMed] [Google Scholar]
- 44.Abramoff MD, Magalhaes PJ, Ram SJ. Image processing with ImageJ. Biophotonics Int. 2004;11(7):36–42. [Google Scholar]
- 45.Liesch J, Bellani LL, Vosshall LB. Functional and genetic characterization of neuropeptide Y-like receptors in Aedes aegypti. PLoS Negl Trop Dis. 2013;7(10):e2486. doi: 10.1371/journal.pntd.0002486. [DOI] [PMC free article] [PubMed] [Google Scholar]
- 46.Matullo CM, O’Regan KJ, Hensley H, Curtis M, Rall GF. Lymphocytic choriomeningitis virus-induced mortality in mice is triggered by edema and brain herniation. J Virol. 2010;84(1):312–320. doi: 10.1128/JVI.00727-09. [DOI] [PMC free article] [PubMed] [Google Scholar]
- 47.Wieczorek H, Wolff G. The labellar sugar receptor of Drosophila. J Comp Physiol A Neuroethol Sens Neural Behav Physiol. 1989;164(6):825–834. [Google Scholar]
- 48.Marion-Poll F, Van Der Pers J. Un-filtered recordings from insect taste sensilla. Entomol Exp Appl. 1996;80(1):113–115. [Google Scholar]
- 49.Marion-Poll F. Object-oriented approach to fast display of electrophysiological data under MS-windows. J Neurosci Methods. 1995;63(1-2):197–204. doi: 10.1016/0165-0270(95)00110-7. [DOI] [PubMed] [Google Scholar]
- 50.Benton R, Sachse S, Michnick SW, Vosshall LB. Atypical membrane topology and heteromeric function of Drosophila odorant receptors in vivo. PLoS Biol. 2006;4(2):e20. doi: 10.1371/journal.pbio.0040020. [DOI] [PMC free article] [PubMed] [Google Scholar]
- 51.Melo AC, Rützler M, Pitts RJ, Zwiebel LJ. Identification of a chemosensory receptor from the yellow fever mosquito, Aedes aegypti, that is highly conserved and expressed in olfactory and gustatory organs. Chem Senses. 2004;29(5):403–410. doi: 10.1093/chemse/bjh041. [DOI] [PubMed] [Google Scholar]
- 52.Jan LY, Jan YN. Antibodies to horseradish peroxidase as specific neuronal markers in Drosophila and in grasshopper embryos. Proc Natl Acad Sci USA. 1982;79(8):2700–2704. doi: 10.1073/pnas.79.8.2700. [DOI] [PMC free article] [PubMed] [Google Scholar]
- 53.Livak KJ, Schmittgen TD. Analysis of relative gene expression data using real-time quantitative PCR and the 2(-Δ Δ C(T)) Method. Methods. 2001;25(4):402–408. doi: 10.1006/meth.2001.1262. [DOI] [PubMed] [Google Scholar]
Associated Data
This section collects any data citations, data availability statements, or supplementary materials included in this article.


