

Abstract
Background:
Even though low back pain (LBP) is common, some occupations pose a higher risk. Identifying these occupations and specific factors will help to reduce the suffering and burden. This study aims to compare the prevalence of chronic LBP among bus drivers and to find its association with some occupational factors.
Materials and Methods:
It is a cross-sectional study to compare prevalence of LBP and factors associated with it, in two groups of drivers (n = 178) and nondrivers (n = 184).
Results:
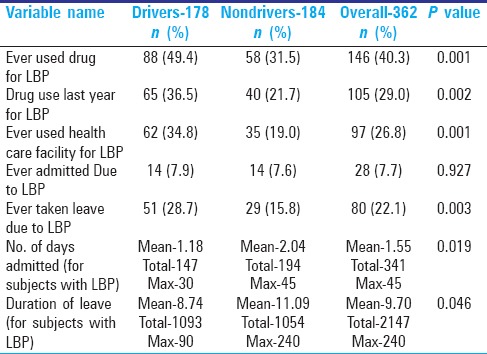
The 10 years’ percentage prevalence of LBP was found to be 70.8 and 51.6 among drivers and nondrivers respectively, whereas point prevalence in the same was 64.0 and 44.6. Drivers are at a higher risk for LBP with Odds ratio—2.270 (1.471–3.502). Risk factors such as prolonged sitting in one posture, night shifts, job dissatisfaction, tobacco use, and lack of exercise were significantly higher among drivers. Though the prevalence and intensity of LBP was higher among drivers, their number of leaves and hospital admitted days were less among drivers.
Conclusion:
This is a potential group for intervention as prevalence of LBP, neck pain, and most of the suspected risk factors were higher among the drivers. Drivers got less recovery time and had higher sequelae.
Keywords: Disability, drivers, neck pain, occupational health, low back pain, tobacco
INTRODUCTION
Low back pain (LBP) (International Classification of Diseases 10-M54.5)[1] is one of the most common complaints and has the highest prevalence among all symptoms both at individual as well at outpatient department level.[2,3,4,5] LBP affects major portions of the population ranging from 64-80%, at some point of time in their whole life because of a wide range of causative factors and is one of the most frequent reasons both for consulting a primary care physician and for taking leaves.[2,3,6,7] Unfortunately, this problem was rarely a focus of public health.
LBP has double burden on the quality of life as well as on health expenditure. LBP badly affects Health-Related Quality Of Life (HRQOL)[3] and mental health, causing depression and anxiety which in turn retards the recovery of LBP as well as other diseases.[8,9] The cumulative cost for LBP with the physician's consultations, costly investigations such as magnetic resonance imaging (MRI) or computerized tomography (CT) scan, absenteeism, compensation, and rehabilitation in case of disability is huge. It was estimated in a study done in 2005 that occupational LBP is responsible for 8,18,000 Disability Adjusted Life Years (DALYs) loss annually.[10] In Netherlands, expenditure on backache problems was found to be 1.7% of the Gross National Product (GNP) making it the fifth most expensive disease in general and the most expensive regarding work absenteeism, having direct medical costs nearly US$200 million which is seven percentage of the total cost in 1995.[11] Similar data from a study done in the UK indicated that the direct cost of LBP was £ 1,632 million and total cost was £ 10,668 million in 1998.[12] National Institute for Occupational Safety and health (NIOSH), USA identified average cost of $18,000 per back injury, excluding indirect costs with total cost of $460.9 million for 10 years from 1995–2005.[13] In some high income countries, specific interventions have been started to reduce the sickness-absenteeism due to LBP with positive results.[7] In low- and middle-income countries where most of the expenditure on health is out of pocket by the patients with limited access to specialty care, this problem poses a huge burden at the household level. But there is a huge gap in terms of data suggesting burden of LBP from these countries.
A World Health Organization (WHO) report on global health risks—2009, indicates that 37% of LBP is attributed to the occupational risk factors[10,14] and LBP constitutes 52-65% of the burden in work-related illnesses.[5]
Heavy motor vehicle (HMV) drivers are at a higher risk for LBP.[15,16,17,18] It is expected to be due to exposure to vibration levels close to resonance frequency of the lower spine.[18,19] Studies have additionally shown that there is a high prevalence of intervertebral disc prolepses and degenerative changes among HMV drivers compared to other people.[6,20,21] As per NIOSH, for work-related LBP following five factors are primarily considered to be significantly important—heavy physical work, lifting, and forceful movements, bending and twisting (awkward postures), whole-body vibration (WBV), and static work postures.[5,22] Out of which, bus drivers are exposed to at least last three factors that makes this group highly vulnerable for bad health outcomes in terms of LBP.[15] Additionally, it is suggested that LBP is associated with prolonged awkward sittings.[15,23] State-transport bus drivers drive for long routes and spend hours in a single posture without any breaks in the rural areas with very bad roads.
Various mechanisms are suggested to cause LBP among HMV drivers. Vibration-induced blood vessels constriction leading to hypoperfusion of spinal and paraspinal tissue, paraspinal muscle injury, and imbalance due to awkward position, tissue injury due to vibration, lessened recovery of paraspinal muscles from strain and fatigue.[9,22] Additionally, it is seen that due to unhealthy lifestyle factors such as-physical inactivity, alcohol consumption, tobacco use, and bad postures there is a higher risk of LBP among drivers.[15,24,25]
Studies done on bus drivers in high-income countries show the 1 year period prevalence of LBP from 65-80%[6,17,22] but they are using different tools. There are very few studies from developing countries and without comparison groups it is very difficult to find the added risk due to driving occupation hence, comparative study with the nondriver group is important.
MATERIALS AND METHODS
This is a quantitative, cross-sectional study conducted in one of the district depots of Maharashtra state road transport corporation (MSRTC), India, which serves all ten taluks of the district. All 233 drivers (exposed group) were approached for participation. After acceptance with written consent and elimination of some participants as per inclusion criteria, the effective number of participants was 178. Inclusion criteria for drivers were—minimum 2 years of service, no LBP at the time of joining in the department, and willingness to participate in the study with a written informed consent. The control group was a mix group of people from the same depot who were mechanics, clerical staff, maintenance staff, security guards, and other office staff. Bus conductors were deliberately avoided because of confounding factors. Out of total 383 eligible people for the comparison group, most of the people available in the duration of data collection were approached in all the sections of occupations and after incorporating willing subjects and eliminating improperly filled questionnaire, subjects with deformities and women (as in exposed group there were no women) the effective size of comparison (non-exposed) group was 184. A self-administered questionnaire capturing occupational practices, history of LBP, other related health complaints, medication, such as Likert scale for pain intensity and with other pictorial validated scales was used to collect the data. The questionnaire was translated in the local language (Marathi) and distributed to the participants at their convenient time (in breaks/before work/after work) after taking informed consent. The study has been approved by institute's ethical committee and technical advisory committee.
The sample size was calculated with the help of: “Epi-info 3.5.2”. Based on other similar studies, it was assumed that minimal prevalence of LBP among drivers is 40% and among nondrivers is 25%.[26] Alpha error was set to 5% and power of the study was set at 80%. The required sample size came to be 165 in each group. Data entry and analysis was done using Statistical Package for the Social Sciences (SPSS)-15 for Sree Chitra Tirunal Institute of Medical Science and Technology, Trivendrum, Kerala, India.
RESULTS
The baseline characteristics of the two groups such as sex (all men), and mean age were not significantly different and there was not much difference in mean years of experience and mean income hence, these groups were comparable.
The prevalence of LBP given in Table 1 is showing significant difference in the two groups. The unadjusted OR was found to be 2.270 (1.471–3.502) among bus drivers as compared to nondrivers for chronic LBP. Among the occupational risk factors, night shifts and less numbers of brakes was much higher among drivers with 66.8% of drivers working in night shifts as compared to 17.4% of nondrivers in the past month. The comfort levels on a five-point scale at the start of the work of drivers and nondrivers were significantly different (P value < 0.001) where only 36.2% of drivers were fully comfortable as compared to 48.3% that of nondrivers; whereas at the end of work 40.7% drivers feel totally uncomfortable as compared to 20.4% that of nondrivers. On a five-point scale 25.8% drivers and 56.5% of nondrivers were fully satisfied with their job; the proportion of drivers (28.7%) who were not satisfied at all with their job was significantly higher as compared to nondrivers (7.6%).
Table 1.
Prevalence of low back pain (LBP) (original)
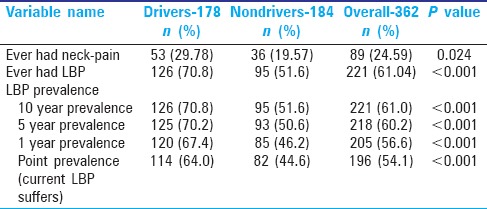
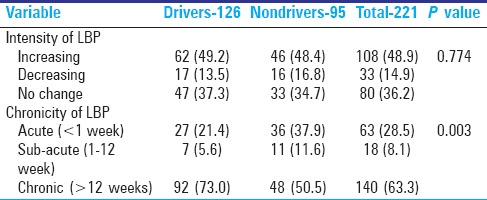
Table 2 gives the characters of LBP showing that among LBP sufferers, more drivers have chronic pain.
Table 2.
Further details of LBP among the sufferers (original)
To detect the level of pain intensity among LBP sufferers a nonvalidated analogue scale is used with ten incremental choices. It was like an objective scale with scoring from one to ten, created using available literature. The purpose was to compare the pain intensities within these groups so that the subjective component can be eliminated and the intensity scores can be compared using nonparametric tests (Mann-Whitney). As given in Table 3 these scores are taken for two categories—the intensity of “maximum LBP ever had” and intensity of their “current LBP.”
Table 3.
Pain intensity scores (original)
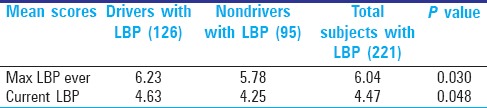
Table 4 helps in knowing the details of sequelae of LBP as it can help in understanding recovery process and its impact.
Table 4.
Sequelae of LBP (original)
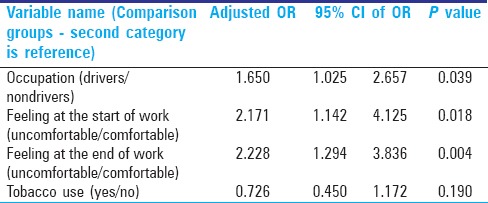
Multivariate analysis
Table 5 did not give any conclusive model mostly because of a smaller sample size with exposed and unexposed groups. It was done using the ENTER method mainly because one variable of occupation (driver or nondriver) has to be there in the model irrespective of its statistical significance. Then only was it possible to explain the model and compare the risk factors between the two groups. By entering occupation as one of the variable by ENTER method this is the most explanatory regression model.
Table 5.
Binary logistic regression model-LBP as outcome (original)
DISCUSSION
Findings of other few studies for point prevalence of LBP are similar to this study.[17,22] This study gives adjusted OR 1.65 but intensive studies with larger sample size and meticulous measurement of other parameters are required. The unadjusted OR was found to be 2.270 (1.471-3.502) for bus drivers as compared to nondrivers. Unadjusted OR varies largely in the available literature that is mostly with small sample sizes and without comparison groups. In a recent study done in Nigeria, the prevalence of the LBP was found to be 73.5% among bus drivers with OR 10.49.[16] Very well-argued risk factor of LBP for HMV drivers is vehicle-induced vibration[21,22,24,27] and in this study, duration of experience was expected to give an account of exposure of this factor.[21] But no significant association was found between years of experience and LBP.
Other occupational risk factors such as sitting in one posture, night shifts, less number of breaks, and awkward postures were significantly high among drivers and in bivariate analysis these were significantly associated with LBP but in multivariate analysis some of these factors lost the significance. In addition, it is in line with the findings of other similar studies.[17,21,24,26]
It is evident that job dissatisfaction and discomfort are associated with this occupation significantly. Even though the causality cannot be established between these factors, this association gives quite a good insight. Job dissatisfaction and comfortlessness can translate in to other psychosomatic conditions.[27,28] A prospective study found that the work-related psychological factors affect the LBP outcomes independently from work-related physical conditions in drivers.[28] People on regular night shifts tend to get sleep disturbance and this in turn can cause or aggravate LBP.[29]
The chances of recovery from chronic LBP were very less as very few people came out of 10 years’ prevalence group. It means that once someone becomes a chronic LBP sufferer, it is likely for that person to have this problem for long. One study in Kolkata city, West Bengal, India public bus drivers found all the bus drivers had LBP.[30]
This study showed that there was no association between alcohol consumption and LBP. Another meta-analysis additionally concludes similar result.[31] In addition, there was no association between tobacco use and LBP but prevalence of use of chewable tobacco was significantly high among drivers.
Lack of exercise is associated with musculoskeletal problems including LBP and additionally, better recovery is seen among people doing regular exercise.[32,33] This study found that percentage of exercise doers among drivers was significantly low (19.7%) as compared to nondrivers (41.7%). One of the reasons could be rotating duties and night shifts making it difficult to adopt regular exercises.
In this study, no specific age distribution of LBP was found.
There are few studies on LBP of HMV drivers but most of these studies do not have a comparison group. So, finding prevalence with different tools will not give a complete picture of added risk due to driving occupation. This study tried to find out the added risk attributed to the driving occupation with a comparison group responding to the same tool.
As evident from Table 2, drivers have a higher chronic LBP as once it develops it tends to be there without subsiding. Higher and frequent use of medication for LBP among drivers indicates that once they suffer from chronic LBP the recovery is compromised. Additionally, it is evident from lesser duration of leaves for LBP among drivers even though overall prevalence is higher. It is difficult to get leaves for drivers due to compelling nature of the job and it affects their recovery process leading to prolong LBP and higher use of medication. This study points toward the fact that the driving occupation is not only a risk factor for occurrence of the LBP but is a risk factor for retarding the recovery from LBP as well. All these findings indicate that the burden of LBP is not only affecting the quality of life but also it is leading to higher expenditure by drivers on medication and hospital visits.
Financial support and sponsorship
Nil.
Conflicts of interest
There are no conflicts of interest.
Acknowledgement
I acknowledge Dr. Kannan Shrinivasan for his guidance. I additionally acknowledge all the officers from Maharashtra state road transport corporation (MSRTC) and its district depot who permitted and helped me in this research and finally all the participants who gave their valuable time.
REFERENCES
- 1.WHO International classification of diseases (ICD) [Last accessed on 2015 Apr 4]. Available from: http://apps.who.int/classifications/apps/icd/icd10online/
- 2.Bener A, Dafeeah EE, Alnaqbi K. Prevalence and correlates of low back pain in primary care: What are the contributing factors in a rapidly developing country. Asian Spine J. 2014;8:227–36. doi: 10.4184/asj.2014.8.3.227. [DOI] [PMC free article] [PubMed] [Google Scholar]
- 3.Coste J, Lefrançois G, Guillemin F, Pouchot J. French Study Group for Quality of Life in Rheumatology. Prognosis and quality of life in patients with acute low back pain: Insights from a comprehensive inception cohort study. Arthritis Rheum. 2004;51:168–76. doi: 10.1002/art.20235. [DOI] [PubMed] [Google Scholar]
- 4.Gureje O, Von Korff M, Simon GE, Gater R. Persistent pain and well-being: A World Health Organization study in primary care. JAMA. 1998;280:147–51. doi: 10.1001/jama.280.2.147. [DOI] [PubMed] [Google Scholar]
- 5.Bernard BP. Musculoskeletal Disorders and Workplace Factors: A Critical Review of Epidemiologic Evidence for Work-Related Musculoskeletal Disorders of the Neck, Upper Extremity, and Low Back, US Department of Health and Human Services, Public Health Service, Centers for Disease Control and Prevention, National Institute for Occupational Safety and Health; 1997, Publication No. 97B141; Ch 6. :1–96. [Google Scholar]
- 6.Capkin E, Karkucak M, Cakırbay H, Topbas M, Karaca A, Köse MM, et al. The prevalence and risk factors of low back pain in the eastern Black Sea region of Turkey. J Back Musculoskelet Rehabil. 2015;28:783–7. doi: 10.3233/BMR-150584. [DOI] [PubMed] [Google Scholar]
- 7.Schaafsma FG, Whelan K, van der Beek AJ, van der Es-Lambeek LC, Ojajärvi A, Verbeek JH. Physical conditioning as part of a return to work strategy to reduce sickness absence for workers with back pain. Cochrane Database Syst Rev. 2013;8:CD001822. doi: 10.1002/14651858.CD001822.pub3. [DOI] [PMC free article] [PubMed] [Google Scholar]
- 8.Linton SJ. A review of psychological risk factors in back and neck pain. Spine (Phila Pa 1976) 2000;25:1148–56. doi: 10.1097/00007632-200005010-00017. [DOI] [PubMed] [Google Scholar]
- 9.Bener A, El-Rufaie OF, Kamran S, Georgievski AB, Farooq A, Rysavy M. Disability, depression and somatization in a low back pain population. APLAR J Rheumatol. 2006;9:257–63. [Google Scholar]
- 10.Punnett L, Prüss-Ütün A, Nelson DI, Fingerhut MA, Leigh J, Tak S, et al. Estimating the global burden of low back pain attributable to combined occupational exposures. Am J Ind Med. 2005;48:459–69. doi: 10.1002/ajim.20232. [DOI] [PubMed] [Google Scholar]
- 11.van Tulder MW, Koes BW, Bouter LM. A cost-of-illness study of back pain in The Netherlands. Pain. 1995;62:233–40. doi: 10.1016/0304-3959(94)00272-G. [DOI] [PubMed] [Google Scholar]
- 12.Maniadakis N, Gray A. The economic burden of back pain in the UK. Pain. 2000;84:95–103. doi: 10.1016/S0304-3959(99)00187-6. [DOI] [PubMed] [Google Scholar]
- 13.James Sharpe, Niosh Issues Guidance On Reducing Back Pain. Rock Products. 2009. [Last accessed on 2015 Apr 4]. Available from: http://rockproducts.com/index.php/key-issues/safety/7879.html .
- 14.WHO global health risks report- 2009. [Last accessed on 2015 Apr 4]. Available from: http://www.who.int/healthinfo/global_burden_disease/GlobalHealthRisks_report_full.pdf .
- 15.Ramond-Roquin A, Bodin J, Serazin C, Parot-Schinkel E, Ha C, Richard I, et al. Biomechanical constraints remain major risk factors for low back pain. Results from a prospective cohort study in French male employees. Spine J. 2015;15:559–69. doi: 10.1016/j.spinee.2013.05.040. [DOI] [PubMed] [Google Scholar]
- 16.Rufa’i AA, Sa’idu IA, Ahmad RY, Elmi OS, Aliyu SU, Jajere AM, et al. Prevalence and risk factors for low back pain among professional drivers in Kano, Nigeria. Arch Environ Occup Health. 2015;70:251–5. doi: 10.1080/19338244.2013.845139. [DOI] [PubMed] [Google Scholar]
- 17.Anderson R. The back pain of bus drivers. Prevalence in an urban area of California. Spine (Phila Pa 1976) 1992;17:1481–8. doi: 10.1097/00007632-199212000-00007. [DOI] [PubMed] [Google Scholar]
- 18.Blood RP, Yost MG, Camp JE, Ching RP. Whole-body vibration exposure intervention among professional bus and truck drivers: A laboratory evaluation of seat-suspension designs. J Occup Environ Hyg. 2015;12:351–62. doi: 10.1080/15459624.2014.989357. [DOI] [PubMed] [Google Scholar]
- 19.Pope MH, Goh KL, Magnusson ML. Spine ergonomics. Annu Rev Biomed Eng. 2002;4:49–68. doi: 10.1146/annurev.bioeng.4.092101.122107. [DOI] [PubMed] [Google Scholar]
- 20.Burström L, Nilsson T, Wahlström J. Whole-body vibration and the risk of low back pain and sciatica: A systematic review and meta-analysis. Int Arch Occup Environ Health. 2015;88:403–18. doi: 10.1007/s00420-014-0971-4. [DOI] [PubMed] [Google Scholar]
- 21.Bovenzi M, Zadini A. Self-reported low back symptoms in urban bus drivers exposed to whole-body vibration. Spine (Phila Pa 1976) 1992;17:1048–59. doi: 10.1097/00007632-199209000-00007. [DOI] [PubMed] [Google Scholar]
- 22.Magnusson ML, Pope MH, Wilder DG, Areskoug B. Are occupational drivers at an increased risk for developing musculoskeletal disorders? Spine (Phila Pa 1976) 1996;21:710–7. doi: 10.1097/00007632-199603150-00010. [DOI] [PubMed] [Google Scholar]
- 23.Robb MJ, Mansfield NJ. Self-reported musculoskeletal problems amongst professional truck drivers. Ergonomics. 2007;50:814–27. doi: 10.1080/00140130701220341. [DOI] [PubMed] [Google Scholar]
- 24.Alkherayf F, Wai EK, Tsai EC, Agbi C. Daily smoking and lower back pain in adult Canadians: The Canadian community health survey. J Pain Res. 2010;3:155–60. doi: 10.2147/JPR.S11031. [DOI] [PMC free article] [PubMed] [Google Scholar]
- 25.Ernst E. Smoking, a cause of back trouble? Br J Rheumatol. 1993;32:239–42. doi: 10.1093/rheumatology/32.3.239. [DOI] [PubMed] [Google Scholar]
- 26.Boshuizen HC, Bongers PM, Hulshof CT. Self-reported back pain in fork-lift truck and freight-container tractor drivers exposed to whole-body vibration. Spine (Phila Pa 1976) 1992;17:59–65. doi: 10.1097/00007632-199201000-00010. [DOI] [PubMed] [Google Scholar]
- 27.Eriksen W, Bruusgaard D, Knardahl S. Work factors as predictors of intense or disabling low back pain; a prospective study of nurses’ aides. Occup Environ Med. 2004;61:398–404. doi: 10.1136/oem.2003.008482. [DOI] [PMC free article] [PubMed] [Google Scholar]
- 28.Krause N, Ragland DR, Fisher JM, Syme SL. Psychosocial job factors, physical workload, and incidence of work-related spinal injury: A 5-year prospective study of urban transit operators. Spine (Phila Pa 1976) 1998;23:2507–16. doi: 10.1097/00007632-199812010-00005. [DOI] [PubMed] [Google Scholar]
- 29.Lusa S, Miranda H, Luukkonen R, Punakallio A. Sleep disturbances predict long-term changes in low back pain among Finnish firefighters: 13-year follow-up study. Int Arch Occup Environ Health. 2015;88:369–79. doi: 10.1007/s00420-014-0968-z. [DOI] [PMC free article] [PubMed] [Google Scholar]
- 30.Gangopadhyay S, Dev S. Effect of low back pain on social and professional life of drivers of Kolkata. Work. 2012;41(Suppl 1):2426–33. doi: 10.3233/WOR-2012-0652-2426. [DOI] [PubMed] [Google Scholar]
- 31.Leboeuf-Yde C. Alcohol and low-back pain: A systematic literature review. J Manipulative Physiol Ther. 2000;23:343–6. doi: 10.1067/mmt.2000.106866. [DOI] [PubMed] [Google Scholar]
- 32.Rasmussen-Barr E, Campello M, Arvidsson I, Nilsson-Wikmar L, Ang BO. Factors predicting clinical outcome 12 and 36 months after an exercise intervention for recurrent low-back pain. Disabil Rehabil. 2012;34:136–44. doi: 10.3109/09638288.2011.591886. [DOI] [PubMed] [Google Scholar]
- 33.Taimela S, Diederich C, Hubsch M, Heinricy M. The role of physical exercise and inactivity in pain recurrence and absenteeism from work after active outpatient rehabilitation for recurrent or chronic low back pain: A follow-up study. Spine (Phila Pa 1976) 2000;25:1809–16. doi: 10.1097/00007632-200007150-00012. [DOI] [PubMed] [Google Scholar]