

ABSTRACT
Autophagy and apoptosis are 2 stress-response mechanisms that are closely interconnected. However, the molecular interplays between these 2 pathways remain to be clarified. Here we report that the crucial proautophagic factor AMBRA1 can act as a positive mediator of mitochondrial apoptosis. Indeed, we show that, in a proapoptotic positive feedback loop, the C-terminal part of AMBRA1, generated by CASP/CASPASE cleavage upon apoptosis induction, inhibits the antiapoptotic factor BCL2 by a direct binding through its BH3-like domain. The mitochondrial AMBRA1-BCL2 complex is thus at the crossroad between autophagy and cell death and may represent a novel target in development of therapeutic approaches in clinical diseases.
KEYWORDS: AMBRA1, apoptosis, autophagy, BCL2, BH3 domain
Introduction
Autophagy is an important eukaryotic process involved in the lysosomal degradation of cytosolic components, both under physiological and pathological conditions. During autophagy, the autophagosomes—specific double-membrane vesicles—engulf a number of different cargoes and then fuse with lysosomes for subsequent recycling of their content. Several key proteins are involved in autophagosome formation, such as BECN1/Beclin 1 and its positive regulator AMBRA1; AMBRA1 and BECN1 are present in the class III phosphatidylinositol 3-kinase (PtdIns3K) complex,1,2 and are involved in autophagosome nucleation, an early step of autophagy induction. More recently, it has been demonstrated that AMBRA1 and BECN1 can also regulate autophagy at different steps of the process, by binding other key interactors.3-6 Interestingly, a pool of AMBRA1 is localized at the mitochondria, where its proautophagic activity is inhibited by mitochondrial resident BCL2.7 Moreover, AMBRA1 regulates mitophagy, a form of autophagy that ensures the specific removal of damaged mitochondria, both dependently or independently of the E3-ubiquitin Ligase PARK2/PARKIN.8
The fact that AMBRA1 interacts with the antiapoptotic factor BCL2 places it at the crossroad between autophagy and cell death. In fact, BCL2, a well-known antiapoptotic factor whose overexpression protects against a wide range of apoptotic inducers, can regulate BECN1-induced autophagy at the endoplasmic reticulum by a direct binding to the BECN1 BH3 domain and with the contribution of CISD2/NAF-1 (CDGSH iron sulfur domain 2).9,10 BCL2 can also regulate BECN1-induced autophagy by sequestering AMBRA1 (the activator of BECN1) at the mitochondria.6 Conversely, it has been demonstrated that a number of regulators of autophagy, such as BECN1 and PI3K3C3/Vps34,11,12,13,14,15 ATG4A/ATG4, ATG5,16,17,18,19 or AMBRA1,20 are subjected to proteolytic cleavage during cell death so as to abrogate their proautophagic function. Another point of convergence between autophagy and apoptosis is the binding between ATG12 and BCL2 family members that takes place in order to induce mitochondrial apoptosis.21
Besides AMBRA1 binding to BCL2 in the mitochondrial fraction, we have previously demonstrated that this event is reduced following apoptosis induction,7 this indicating that AMBRA1 could be involved in cell death regulation.
In this work, we explore the relationship between AMBRA1 and the death machinery by investigating whether AMBRA1 could disrupt BCL2's ability to protect against apoptosis. In particular, because AMBRA1 is cleaved by CASP during apoptosis, we decided to study the effect of the C-terminal fragment of AMBRA1, which is released by this CASP cleavage, on BCL2. We found that this fragment, through a BH3-like domain, is able to inhibit the antiapoptotic function of BCL2 so as to enhance apoptosis. To summarize, we propose a model in which AMBRA1 is involved in both autophagy and apoptosis, depending upon the presence of its full-length or cleaved form.
Results
To test whether AMBRA1 could have an effect on BCL2 antiapoptotic functions, we first cotransfected HEK293 cells with a vector encoding AMBRA1 and a vector encoding mito-BCL2, a mutant of BCL2 which have a mitochondria-restricted subcellular localization and which is known to interact with AMBRA1.7 We next measured cell viability following treatment with staurosporin (STS), a pan-kinase inhibitor commonly used to induce rapid activation of mitochondrial apoptosis.
However, surprisingly, when AMBRA1 was cotransfected together with mito-BCL2, this protective effect was lost (Fig. 1A). This result was also observed by counting pyknotic nuclei in transfected cells (Fig. S1A). To elucidate the action of AMBRA1 on the protective effect of mito-BCL2, we performed a western blot analysis for the cleavage of PARP1 (fragment of 89 kDa), a CASP substrate. Again, cotransfection of AMBRA1 with mito-BCL2 abrogates this protective effect (Fig. 1B).
Figure 1.
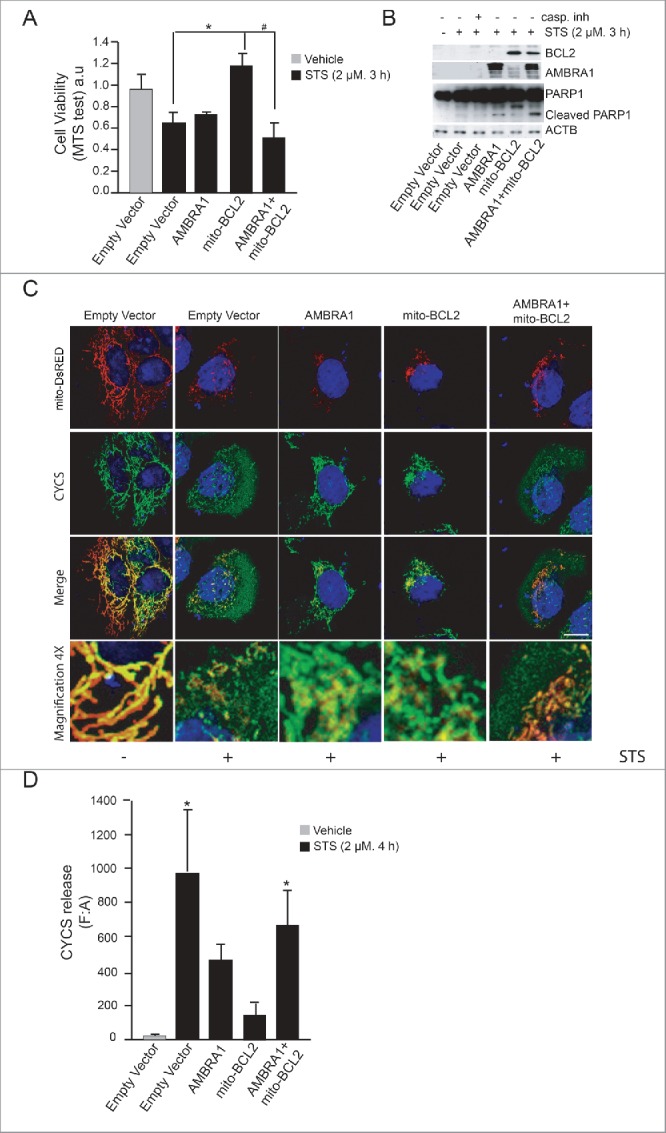
AMBRA1 becomes proapoptotic in combination with mito-BCL2. (A) HEK293 cells were transfected with an empty vector or vectors encoding AMBRA1, mito-BCL2 or cotransfected with both AMBRA1 and mito-BCL2. Twenty-four h after transfection, cells were treated or not with 2 µM STS for 3 h and viable cells were estimated using the MTS assay. Results are expressed as arbitrary unit (a.u). Each point represents the mean (± SD) of triplicate wells from 3 independent experiments. Statistical analysis was performed using the Student t test (*P < 0.05) versus pcDNA3 and (#, P < 0.05) vs. mito-BCL2. (B) HEK293 cells were transfected with an empty vector or vectors encoding AMBRA1, mito-BCL2 or either cotransfected with both AMBRA1 and mito-BCL2. Twenty-four h after transfection, cells were treated with or without 2 µM STS for 3 h. After extraction of proteins, we performed a western blot analysis by using antibodies against PARP1, AMBRA1, BCL2 and against ACTB (as a loading control). (C) HEK293 cells were cotransfected with an empty vector and mito-DsRED (in order to stain mitochondria) or with mito-DsRED and vectors encoding AMBRA1, mito-BCL2 or cotransfected with both AMBRA1 and mito-BCL2. Cells were then treated with STS 2 µM during 4 h and stained using an anti-CYCS (green) antibody. Nuclei were stained with DAPI 1µg/µl 20 min. Merge of the different fluorescence signals are illustrated. Scale bar: 8 µm. (D) Graphic of densitometry values of CYCS release, expressed as mean fluorescence of individual cells, normalized to total cellular surface (F:A, n = 30 cells/groups).
Next, we decided to investigate CYCS/cytochrome C release from mitochondria, another crucial step during apoptosis induction. To this end, we performed a confocal microscopy analysis on HEK293 cells cotransfected with a vector encoding mito-DsRED used in order to stain mitochondria (this vector contains a mitochondria targeting sequence fused with Ds-RED protein) , and with AMBRA1 alone, mito-BCL2 alone or the 2 constructs together. As expected, mito-BCL2 overexpression was able to reduce CYCS release from mitochondria, as shown by an almost complete overlap between mitochondria (red staining) and CYCS (green staining) (Fig. 1C). However, the merging between mitochondria and CYCS was completely lost in cells overexpressing both AMBRA1 and mito-BCL2, so indicating a stronger release of CYCS in these cells. Quantification of CYCS release from mitochondria confirms that the BCL2 antiapoptotic effect is abolished when AMBRA1 is cotransfected with BCL2 (Fig. 1D). Overall, these results indicate that AMBRA1, in combination with mito-BCL2, may exert a proapoptotic activity.
Pagliarini et al. have previously demonstrated that AMBRA1 is subjected to proteolytic cleavage during apoptosis,20 which leads to generation of 2 protein fragments. Of note, the C-terminal part of the protein proves to be more stable than the N-terminal fragment, which, instead, undergoes rapid degradation. Based on this finding, we thus hypothesized that one possible way by which AMBRA1 could regulate the BCL2 antiapoptotic effect, is via its C-terminal part (generated after CASP cleavage).
First, in order to test this hypothesis, we decided to investigate whether AMBRA1's C-terminal fragment (AMBRA1CT), resulting from CASP cleavage, interacted with BCL2 during cell death. To answer this question, endogenous proteins extracted from HEK293 cells treated with DMSO (as control) or with STS were analyzed by size-exclusion fast protein liquid chromatography (sec-FPLC). The collected protein fractions were then studied by western blot analysis, using specific antibodies against AMBRA1 and BCL2. As shown in Fig. 2A, AMBRA1 (molecular mass of ∼130 kDa) is copurified in the same fraction with BCL2 in DMSO conditions (fraction 24). In contrast, a fragment of AMBRA1 (molecular mass of ∼100 kDa, only visible upon staurosporine treatment and likely corresponding to endogenous AMBRA1CT) and BCL2 are copurified in the same fractions (fractions 31 to 33, indicated with #), demonstrating the existence of a macromolecular complex comprising the 2 proteins, and with a molecular mass of ∼120 kDa. This result indicates that the endogenous C-terminal part of AMBRA1 generated during cell death, as revealed by PARP cleavage in the given conditions (right panel in Fig. 2A), is in a macromolecular complex with endogenous BCL2.
Figure 2.
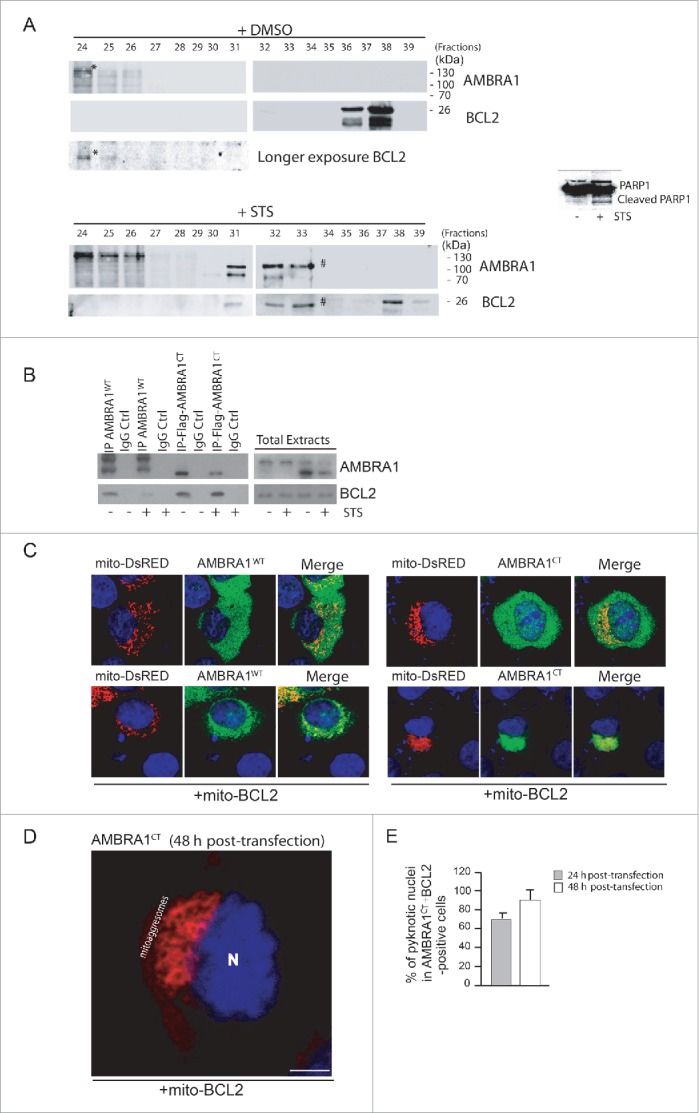
The C-terminal part of AMBRA1, resulting from CASP cleavage, interacts with BCL2 and increases cell death following STS treatment. (A) 2 mg of HEK293 cell lysate, obtained from DMSO-treated cells (control cells) or staurosporine-treated cells, were injected onto a superose 6 HR 10/30 FPLC gel filtration column. Proteins were collected in 500 μl fractions. Equal amounts of each fraction have been analyzed by western blot using antibodies against AMBRA1 and BCL2. To control that the STS treatment was efficient, we analyzed PARP cleavage by using an antibody against PARP. (B) HEK293 cells were transfected with a vector encoding MYC-AMBRA1WT or Flag-AMBRA1CT. Twenty-four h after transfection, cells were treated or not with STS (2 µM, 2 h). Protein extracts were immunoprecipitated using an anti-MYC or anti-Flag antibodies. Purified complexes and corresponding total extracts were analyzed by western blot (WB) using anti-AMBRA1 and anti-BCL2 antibodies. (C) HEK293 cells were cotransfected with a vector encoding mito-DsRED (to stain mitochondria) and a vector encoding MYC-AMBRA1WT or AMBRA1CT (lane 1) or in addition with a vector encoding mito-BCL2 (lane 2). Twenty-four h after transfection, cells were then stained using antibody anti-AMBRA1 (AMBRA1WT and AMBRA1CT, green). Nuclei were stained with DAPI 1 µg/µl 20 min. The merging of the different fluorescence signals is illustrated. Scale bar: 8 µm. (D) HEK293 cells were cotransfected with a vector encoding AMBRA1CT and a vector encoding mito-BCL2. Forty-eight h after transfection, cells were fixed and stained using anti-AMBRA1 antibody (AMBRA1CT, red). Nuclei were stained with DAPI 1µg/µl 20 min. The merging of the different fluorescence signals is illustrated. Scale bar: 8 µm. (E) HEK293 cells were cotransfected with a vector encoding Flag-AMBRA1CT and a vector encoding mito-BCL2. Twenty-four or 48 h following transfection, cells were fixed and assessed by immunolabelling using anti-Flag antibody and cells with condensed or fragmented nuclei were scored as pyknotic. Results are expressed as the percentage of transfected cells displaying pyknotic nuclei. For each condition, transfected cells were counted in 10 random fields from 3 independent experiments. Values are given as a percentage (± SD) of cell death.
Second, to assess BCL2 interaction with AMBRA1CT, we transfected HEK293 cells with a construct encoding MYC-tagged AMBRA1 wild-type (AMBRA1WT) or Flag-tagged AMBRA1CT (Flag-AMBRA1CT). We then treated these cells with STS in order to induce cell death; we next immunoprecipitated, using an anti-MYC antibody for the AMBRA1WT construct or, with an anti-Flag antibody for the AMBRA1CT construct, in normal and apoptotic conditions. As shown in Fig. 2B, BCL2 coimmunoprecipitates with AMBRA1WT in normal conditions whereas this binding is disrupted following STS treatment. In contrast, AMBRA1CT coimmunoprecipitatess with BCL2 with higher affinity both in normal conditions and following cell death induction. To confirm this result, we performed a confocal microscopy analysis between AMBRA1WT or AMBRA1CT with endogenous BCL2, in normal conditions or following STS treatment. As shown in Fig. S1B, endogenous BCL2 strongly colocalizes with AMBRA1CT following STS treatment when compared to AMBRA1WT. Interestingly, we found that cleaved AMBRA1 competes with full-length AMBRA1 for binding to BCL2 (Fig. S2), suggesting that cleaved AMBRA1 is more prone to bind BCL2 than full-length AMBRA1. Since we previously have demonstrated that AMBRA1 is able to bind the mitochondrial pool of BCL2,6 in order to verify whether AMBRA1CT was also able to bind the mitochondrial pool of BCL2, we performed a confocal microscopy analysis to check the subcellular distribution of AMBRA1WT or AMBRA1CT. In order to stain mitochondria, we overexpressed mito-DsRED with AMBRA1WT or AMBRA1CT alone (Fig. 2C, top panels) or with both AMBRA1WT or AMBRA1CT and mito-BCL2 (Fig. 2C, bottom panels). AMBRA1WT and AMBRA1CT (green staining) are widely distributed in the cytoplasm, and a partial colocalization with the mitochondrial network is detected (merged). Of note, the mitochondrial network (red staining) appears fragmented following AMBRA1CT overexpression, indicating a putative proapoptotic effect of AMBRA1CT. More interestingly, we observed that mito-BCL2 overexpressed together with AMBRA1CT is sufficient to massively recruit AMBRA1CT on mitochondria. Forty-eight h post-transfection, cells double-positive for AMBRA1CT and mito-BCL2 undergo cell death (as shown by detection of apoptotic nuclei), exhibiting a mitochondrial network, which is completely aggregated around the nucleus (often defined as “mitoaggresomes,"(22) Fig. 2D). These results led us to check whether AMBRA1CT, in combination with mito-BCL2, was sufficient to induce apoptosis in the absence of any specific death stimuli, such as STS. To this end, we cotransfected HEK293 cells with AMBRA1CT and mito-BCL2, and counted pyknotic nuclei in transfected cells, 24 h and 48 h after transfection. As shown in Fig. 2E, 24 h post-transfection more than 60% cells underwent death. Forty-eight h after transfection, we observed up to 100% of apoptosis in cells overexpressing both AMBRA1CT and mito-BCL2. These results demonstrate that AMBRA1CT, in combination with mito-BCL2, induces apoptosis.
At this point, to demonstrate that the C-terminal fragment of AMBRA1 could become proapoptotic following cell death signals, we decided to use a mutant of AMBRA1 resistant to CASP cleavage (AMBRA1D482A). In fact, the AMBRA1D482A mutant, carrying a single-point mutation (D482 → A) was initially mutated in order to disrupt the predicted putative caspase cleavage site.20 We overexpressed either a vector encoding AMBRA1D482A or AMBRA1CT in HEK293 cells, and treated them with STS to induce apoptosis. We next checked, by confocal microscope, CYCS release from mitochondria. As shown in Fig. 3A (top panels), AMBRA1D482A did not induce CYCS release in normal condition. Also, following STS treatment, we observed that cells overexpressing AMBRA1D482A were healthy, with a still significant overlap of CYCS staining with mitochondria, indicating an antiapoptotic activity of this mutant. By contrast, overexpression of AMBRA1CT is sufficient to induce, in normal conditions, CYCS release from mitochondria (Fig. 3B, top panels), and this release is also visible in cells treated with STS (Fig. 3B, bottom panels). The graphic of Fig. 3C illustrates quantification of CYCS release. Last, by performing a western blot analysis, we observed that BAX activation, following STS treatment, is reduced in cells overexpressing AMBRA1D482A compared with cells overexpressing AMBRA1WT or AMBRA1CT (Fig. 3D). Altogether, these results indicate that, during apoptosis, AMBRA1 cleavage by CASP is fundamental to support BAX activation.
Figure 3.
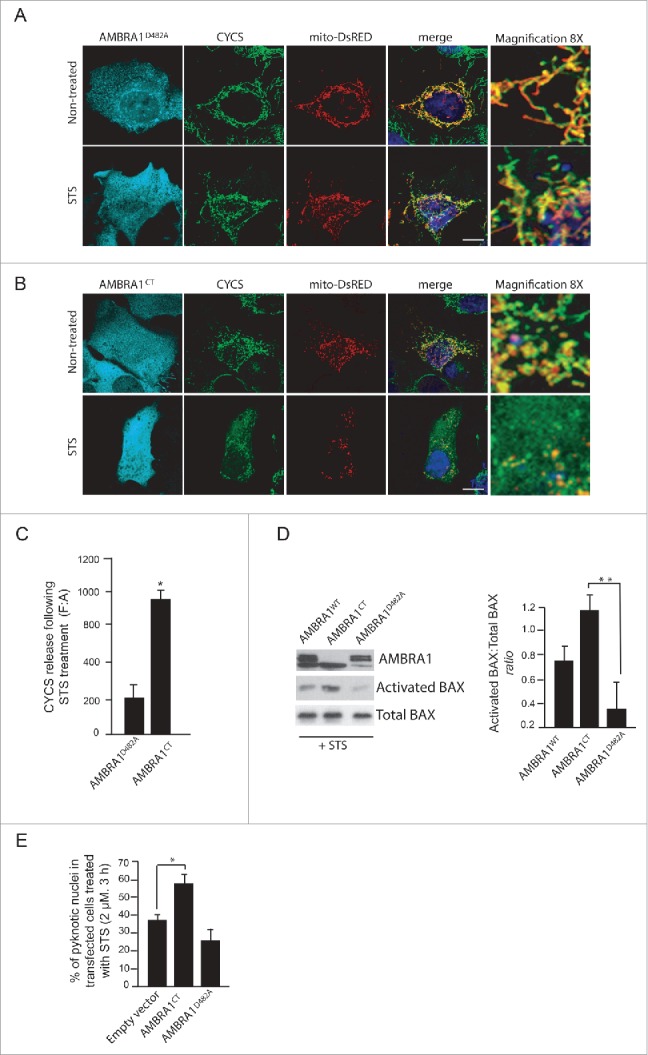
The C-terminal part of AMBRA1 functions upstream of MOMP. (A) HEK293 cells were cotransfected with a vector encoding AMBRA1D482A and mito-DsRED (in order to stain mitochondria) or (B) with mito-DsRED and vectors encoding AMBRA1CT. Twenty-four h after transfection, cells were treated with or without STS (2 µM) for 4 h. Cells were fixed and then stained using antibodies against CYCS (green) and against AMBRA1 (blue staining) that recognize only the overexpressed form of the protein. Nuclei were stained with DAPI 1µg/µl 20 min. The merging of the different fluorescence signals is illustrated. Scale bar: 8 µm. (C) Graphic of densitometric values of CYCS release, expressed as mean fluorescence of individual cells, normalized to total cellular surface (F:A, n=30 cells/groups). (D) HEK293 cells were transfected with vectors encoding AMBRA1WT, AMBRA1D482A or AMBRA1CT. Twenty-four h after transfection, cells were treated with 2 µM STS for 2 h. After extraction of proteins, we performed a western blot analysis using antibodies against AMBRA1, activated BAX, and total BAX (as a loading control). The band density ratio of activated BAX/total BAX was analyzed in 3 independent experiments; each point value represents the mean ± SD from 3 independent experiments. Statistical analysis was performed using the Student t test (*, P < 0.05). (E) HEK293 cells were transfected with an empty vector or with a vector encoding AMBRA1D482A or AMBRA1CT. Twenty-four h following transfection, cells were treated with 2 µM STS for 2 h. Cells were next fixed and examined by immunolabelling using anti-AMBRA1 antibody and cells with condensed or fragmented nuclei were scored as pyknotic. Results are expressed as the percentage of transfected cells displaying pyknotic nuclei. For each condition, transfected cells were counted in 10 random fields from 3 independent experiments. Values are given as a percentage (± SD) of cell death.
This being the case, in contrast with cells overexpressing AMBRA1CT, cells overexpressing AMBRA1D482A are expected to be protected from cell death. We thus decided to monitor cell death by counting pyknotic nuclei in transfected cells. As shown in Fig. 3E, cells positive for AMBRA1D482A undergo cell death to a lesser extent than to AMBRA1CT-transfected cells. In fact, it has been demonstrated in another cell system that AMBRA1D482A delays cell death by maintaining its proautophagic activity.20 Our observation confirms that AMBRA1CT favors apoptosis, whereas its mutant resistant to CASP cleavage can partially prolong cell survival.
Next, we decided to investigate the molecular mechanism of AMBRA1CT activity on BCL2. BCL2 is a member of the BCL2 protein family; this family shares a consensus sequence called BH3 domain; often, proapoptotic members of this family regulate, through direct binding via their BH3 domain, other BH3-containing proteins. We thus hypothesized that AMBRA1CT could act on BCL2 as a BH3 protein. First, we used a well-known BH3-mimetic, ABT-737, to test whether the interaction between AMBRA1 and mito-BCL2 could occur through a BH3 domain. We thus treated HEK293 cells overexpressing MYC-AMBRA1WT with 10 µM ABT-737 for 3 h. We next immunoprecipitated AMBRA1 with an anti-MYC antibody. As shown in Fig. 4A, mito-BCL2 is associated with AMBRA1 in normal conditions, this binding being reduced by ABT-737. We next examined in silico the AMBRA1 sequence and found that AMBRA1 possesses, indeed, a putative BH3 motif in its C-terminal region (1215LPEAGQLA1222, see Fig. 4B). Therefore, in principle, AMBRA1 could bind BCL2 through this motif. As expected, 2 point mutations of this putative BH3 domain (AMBRA1BH3-AE, [L1215A and G1219E]) almost abolished the interaction between MYC-AMBRA1WT and mito-BCL2 (Fig. 4A). These results indicate that AMBRA1 can interact with mito-BCL2 through a previously unrevealed BH3 domain. A quantification of the ratio between mito-BCL2 coimmunopreciptated on the quantity of precipitated AMBRA1 is reported in the graph (Fig. 4B).
Figure 4.
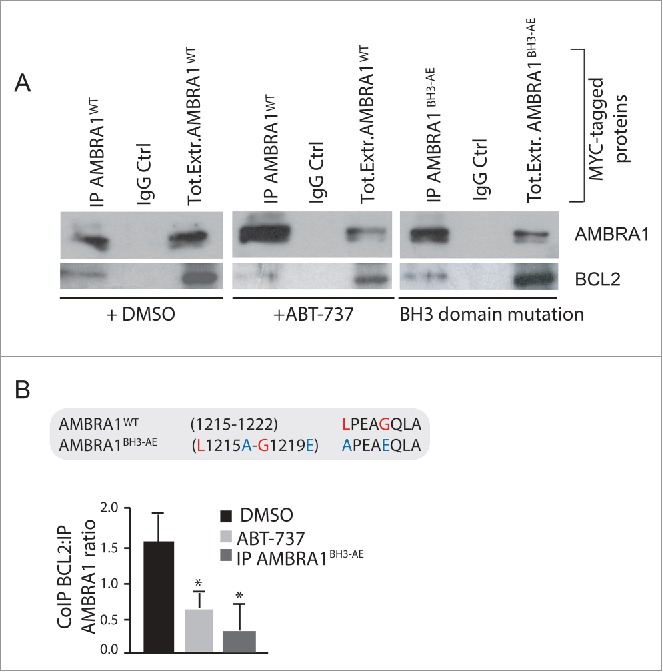
The C-terminal part of AMBRA1 interacts with mito-BCL2 via a BH3-like motif. (A) HEK293 cells were transfected with a vector encoding MYC-AMBRA1WTor MYC-AMBRA1BH3-AE. Twenty-four h after transfection, cells were treated with DMSO (ctrl) or with ABT-737 during 3 h (10 µM). Total extracts were next immunoprecipitated using an anti-MYC antibody. Purified complexes were analyzed by western blot (WB) using anti-AMBRA1 and anti-BCL2 antibodies. (B) Identification of a BH3-like motif within the AMBRA1 sequence. Point mutations of both an aromatic residue and the conserved residue are shown (AMBRA1BH3-AE [L1215A-G1219E; APEAEQLA]). The band density ratio of immunoprecipitated AMBRA1 relative to immunoprecipitated BCL2 was analyzed in 3 independent experiments; each point value represents the mean ± SD from 3 independent experiments. Statistical analysis was performed using the Student t test (*P < 0.05) versus the DMSO condition.
Finally, we investigated the effect of AMBRA1BH3-AE on apoptosis induction. To this end, we performed a confocal microscopy analysis and checked for CYCS release from mitochondria, upon STS treatment, in cells overexpressing AMBRA1WT or AMBRA1BH3-AE. CYCS release was reduced in cells overexpressing AMBRA1BH3-AE following STS treatment (Fig. 5B and C). Again, we quantified apoptosis upon STS treatment in cells overexpressing this novel mutant construct. As shown in Fig. 5D, AMBRA1BH3-AE can delay apoptosis similarly to AMBRA1D482A, confirming that the AMBRA1CT acts on BCL2, through its BH3 domain, during apoptosis. Last, by performing a western blot analysis using an antibody against activated BAX, we observed that cells overexpressing AMBRA1BH3-AE exhibited a lower basal activation of BAX when compared with AMBRA1CT (Fig. 5E). Also, the capability of AMBRA1 fragments to bind BH3-domain-containing proteins is further proved by their dynamic interactions with other antiapoptotic members of the BH3 family, as shown in Fig. S4.
Figure 5.
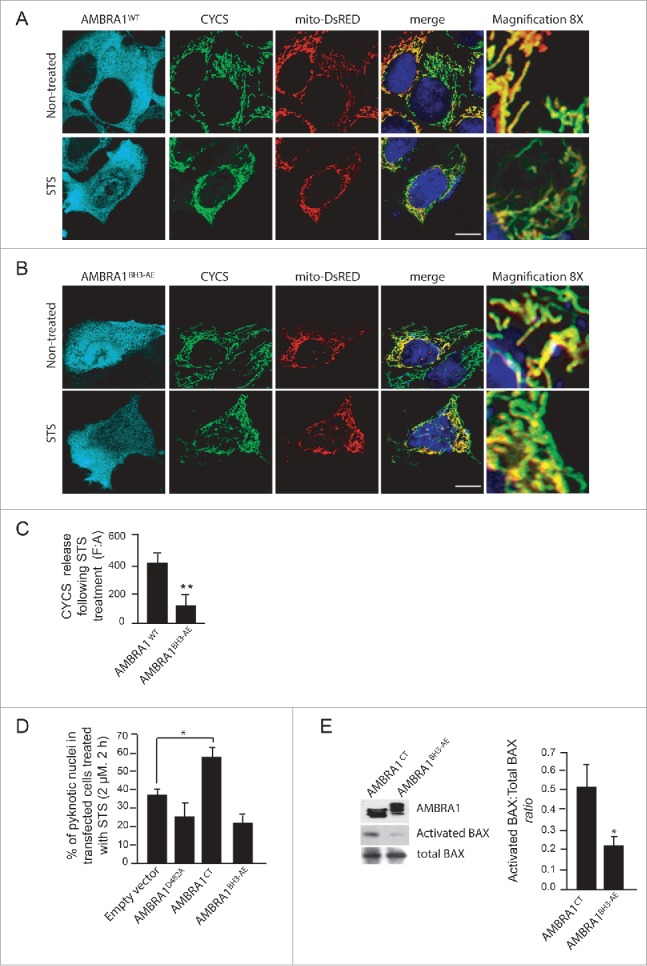
The mutant of AMBRA1 that cannot bind BCL2 loses its proapoptotic effect during cell death. (A) HEK293 cells were cotransfected with a vector encoding AMBRA1WT or (B) AMBRA1BH3-AE and mito-DsRED (in order to stain mitochondria). Twenty-four h after transfection, cells were treated with or without STS (2 µM) for 4 h. Cells were fixed and then stained using the anti-CYCS (green) antibody. Nuclei were stained with DAPI 1µg/µl 20 min. The merging of the different fluorescence signals is illustrated. Scale bar: 8 µm. (C) HEK293 cells were transfected with an empty vector or with a vector encoding AMBRA1D482A, AMBRA1CT (see Fig. 3D) or with a vector encoding AMBRA1BH3-AE. Twenty-four h following transfection, cells were treated with 2 µM STS during 3 h. Cells were next fixed and examined by immunolabelling using anti-AMBRA1 antibody that recognizes only the overexpressed form of the protein and cells with condensed or fragmented nuclei were scored as pyknotic. Results are expressed as the percentage of transfected cells displaying pyknotic nuclei. For each condition, transfected cells were counted in 10 random fields from 3 independent experiments. Values are given as a percentage (± SD) of cell death. (D) Graphic of densitometric values of CYCS release, expressed as mean fluorescence of individual cells, normalized to total cellular surface (F:A, n=30 cells/groups). (E) HEK293 cells transfected with a vector encoding AMBRA1CT or AMBRA1BH3-AE were analyzed by western blot using antibodies against activated BAX and total BAX. The band density ratio of activated BAX/total BAX was analyzed in 3 independent experiments; each point value represents the mean ± SD from 3 independent experiments. Statistical analysis was performed using the Student t test (*P < 0.05).
At this point, our data suggest that AMBRA1 can regulate the antiapoptotic effect of BCL2 during apoptosis induction by a direct binding of this protein through a BH3 motif. To strengthen these results, we decided to render AMBRA1 protein both autophagy deficient and BCL2-binding deficient. To this end, we performed 2 point mutations of the BH3 domain on the cleaved form of AMBRA1, which is deficient for autophagy activity (Pagliarini et al., and Fig. S5; AMBRA1CT-BH3-AE). As expected, these mutations almost abolished the interaction between AMBRA1CT and mito-BCL2 (Fig. 6A). A quantification of the ratio between coimmunoprecipitated mito-BCL2 and cleaved-AMBRA1 is reported in the graph (Fig. 6B). Further, by counting pyknotic nuclei in transfected cells, we observed that AMBRA1CT-BH3-AE exhibits less apoptotic activity than AMBRA1CT (Fig. 6C). Also, by looking at CYCS release (Fig. 6D), we found that AMBRA1CT-BH3-AE-positive cells present less release of CYCS from mitochondria than cells overexpressing AMBRA1CT. Altogether these results suggest that AMBRA1CT-BH3-AE induces less mitochondrial permeabilization than AMBRA1CT. Indeed, by monitoring BAX translocation from cytosol to mitochondria, we found that cells overexpressing AMBRA1CT-BH3-AE present less translocated BAX on mitochondria than cells overexpressing AMBRA1CT (Fig. 6F).
Figure 6.
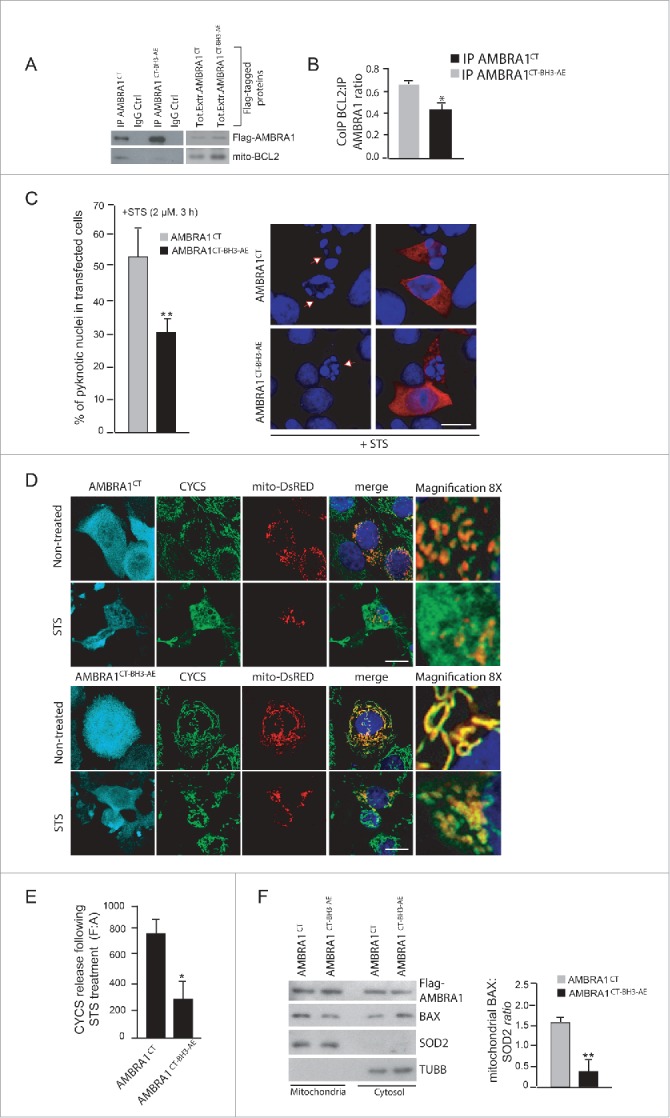
The mutant form of cleaved AMBRA1 that cannot bind BCL2 loses its proapoptotic effect during cell death. (A) HEK293 cells were transfected with a vector encoding Flag-AMBRA1CT or Flag-AMBRA1CT-BH3-AE. Twenty-four h after transfection, total extracts were next immunoprecipitated using an anti-Flag antibody. Purified complexes were analyzed by western blot (WB) using anti-AMBRA1 and anti-BCL2 antibodies. (B) The band density ratio of immunoprecipitated AMBRA1 relative to immunoprecipitated BCL2 was analyzed in 3 independent experiments; each point value represents the mean ± SD from 3 independent experiments. Statistical analysis was performed using the Student t test (*, P < 0.05) vs. CT. (C) HEK293 cells were transfected with a vector encoding Flag-AMBRA1CT or Flag-AMBRA1CT-BH3-AE. Twenty-four h following transfection, cells were treated with 2 µM STS during 2 h. Cells were next fixed and examined by immunolabelling using anti-AMBRA1 antibody that recognizes only the overexpressed form of the protein and cells with condensed or fragmented nuclei were scored as pyknotic. Results are expressed as the percentage of transfected cells displaying pyknotic nuclei. For each condition, transfected cells were counted in 10 random fields from 3 independent experiments. Values are given as a percentage (± SD) of cell death. (D) HEK293 cells were cotransfected with a vector encoding Flag-AMBRA1CT or Flag-AMBRA1CT-BH3-AE and mito-DsRED (in order to stain mitochondria). Cells were then treated with STS 2 µM during 4 h and stained using an anti-CYCS antibody (green). Nuclei were stained with DAPI 1µg/µl during 20 min. The merging of the different fluorescence signals is illustrated. Scale bar: 8 µm. (E) Graphic of densitometric values of CYCS release, expressed as mean fluorescence of individual cells, normalized to total cellular surface (F:A, n=30 cells/groups). (F) HEK293 cells were transfected with a vector encoding Flag-AMBRA1CT or Flag-AMBRA1CT-BH3-AE. Twenty-four h after transfection, cytosolic and mitochondrial fractions were analyzed by western blot (WB) using anti-BAX and anti-SOD2 antibodies. The band density ratio of translocated BAX on mitochondria was analyzed in 3 independent experiments; each point value represents the mean ± SD from 3 independent experiments. Statistical analysis was performed using the Student t test (**, P < 0.01) versus CT.
In conclusion, our data clearly indicate that AMBRA1 can regulate the antiapoptotic effect of BCL2 during apoptosis induction, by direct binding of this protein through a BH3 motif. A proposed working model for AMBRA1 in apoptosis is finally shown in Fig. 7.
Figure 7.
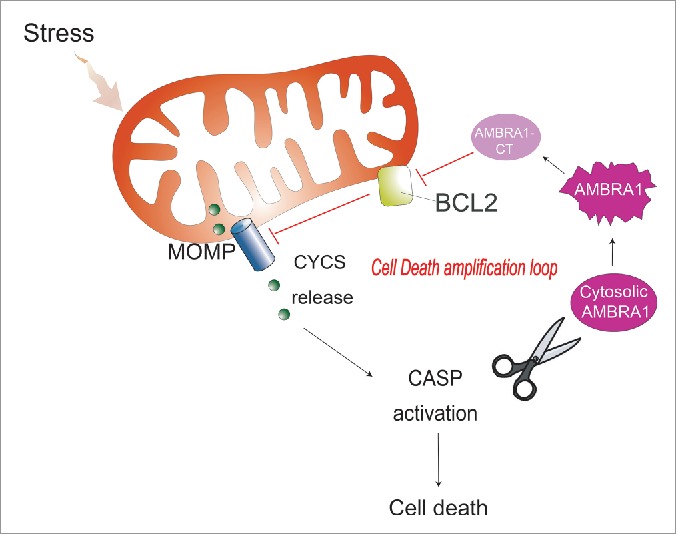
The proposed working model for AMBRA1 in mitochondrial apoptosis. Upon induction of apoptosis, AMBRA1 is subjected to CASP cleavage. In the initial phase of apoptosis, the C-terminal fragment of AMBRA1 is stable and interacts directly with BCL2 through its BH3-like domain, thus likely increasing cell death (cell death amplification loop).
Discussion
Our results indicate that AMBRA1, in addition to its roles in macroautophagy and mitophagy (reviewed in ref. 23), can act as a positive mediator of mitochondrial apoptosis. We propose here that the C-terminal part of AMBRA1, AMBRA1CT, generated by CASP cleavage, inactivates the BCL2 antiapoptotic factor, by a direct binding through its BH3-like domain. This work demonstrates the existence of a reciprocal regulation between AMBRA1 and BCL2 at the mitochondria.
The functional deficiency of Ambra1 in mice induces a large number of supernumerary apoptotic cells in several areas of the nervous system.1 Pagliarini et al.20 have demonstrated that reduced levels of AMBRA1 in several cell lines lead to increased susceptibility to different apoptotic stimuli. Altogether, these results underline a prosurvival effect of AMBRA1; in line with these results, we demonstrated that cerebellar granule neurons overexpressing AMBRA1 are more resistant to trophic factor withdrawal than control neurons.7 Similarly to other proautophagic factors, such as ATG5 and ATG12,16,21 AMBRA1 is cleaved during apoptosis, in order to abolish its prosurvival effect. Since a mutant form of AMBRA1 resistant to CASP cleavage increases resistance to cell death by blocking both BAX activation and CYCS release from mitochondria, it can be postulated that AMBRA1 cleavage is involved in mitochondrial outer membrane permeabilization (MOMP). However, mutation of the AMBRA1 CASP cleavage site does not completely protect cells against cell death. This result can be explained by the fact that, in addition to CASP cleavage, AMBRA1 (or its cleaved fragments) may also be subjected to CAPN (calpain) cleavage, this leading to a complete destruction of the protein. In addition, other proautophagic proteins, and thus other prosurvival proteins, such as BECN1, are also cleaved during cell death, contributing to cell death induction. The fact that AMBRA1 requires to be cleaved in order to inhibit BCL2 opens the question about why the full-length form is not able to have such an effect. It is well possible that the N-terminal part of the protein, by binding other proteins, induces a particular conformation that blocks its inhibitory action on BCL2. This hypothesis is supported by the fact that AMBRA1 can dynamically binds the antiapoptotic proteins MCL1 and BCL2L1/BCLX. In particular, the cleaved form of AMBRA1 binds preferentially these antiapoptotic proteins when compared to full-length AMBRA1 during cell death. These data suggest that a conformational change of AMBRA1, that occurs during cell death, is necessary to allow its binding with antiapoptotic factors of the BCL2 family. Most likely, in addition to BCL2, in order to potentiate cell death, AMBRA1CT could also act on MCL1 and BCL2L1. Interestingly, no binding can be found between AMBRA1 and the proapoptotic members of the BCL2 family proteins, such as BAX and BAK1/BAK.
BCL2 binds BECN1 on its BH3 domain. We show here that also AMBRA1 contains a BH3-like motif along its sequence. Of note, AMBRA1BH3-AE partially loses its binding with mito-BCL2. In fact, we previously have proved that AMBRA1 binds dynamically to the mitochondrial pool of BCL2 with both the amino and the C-terminal domains of the protein. It is thus possible that the resistant binding observed with mutant AMBRA1BH3-AE is mediated by the N-terminal part of the protein. It will be interesting to identify the precise region of binding between AMBRA1 and BCL2 in this N-terminal region.
Human cancer grows by evading cell death. In fact, some cancers, and in particular breast cancers, express high levels of BCL2. Proteins from the BCL2 family are involved in MOMP, a phenomenon mediating CYCS release from mitochondria (essential in cell death induction) and, for this reason, MOMP is a good target in cancer therapy. Indeed, BH3 mimetics are already used in chemotherapy and have provided beneficial insights into the regulation of the BCL2-BECN1 complex as well as in identifying additional pathways involved in autophagic cell death. ABT-737 and HA14-1 also stimulate other proautophagic pathways and hence activate the nutrient sensors SIRT1 (sirtuin 1) and AMPK, inhibit MTOR, deplete cytoplasmic TP53/p53, and trigger the CHUCK/IKKα and IKBKB/IKKβ kinases.24 Here we propose a novel mechanism of action of ABT-737, which disrupts the interaction between AMBRA1 and mito-BCL2, thus contributing to autophagy induction. Consequently, exploiting the AMBRA1-BCL2 interaction could be used to develop novel anticancer therapies.
BCL2 is upregulated in human breast cancers and mediates the resistance of these cancers to chemotherapeutic strategies,25,26 while, by contrast, AMBRA1 is an haploinsufficient tumor suppressor gene;27 given both these factors, modulating the reciprocal AMBRA1 and BCL2 levels in cancer cells by targeting their interaction could contribute to early diagnosis and to predicting prognosis for breast cancer.
Further studies are needed to discover binding partners that can alter the reciprocal affinity of BCL2 and AMBRA1 at the mitochondria. It should also be interesting to investigate whether post-translational modifications on AMBRA1 (such as its phosphorylation by kinases) regulate this binding. Developing combination therapies between BH3 mimetics and kinase activators could provide a powerful “double effect” on the AMBRA1-BCL2 complex. In conclusion, identification of the mechanisms that maintain or disrupt this complex may allow us to develop additional drugs that can target it, thus ensuring an improved therapeutic outcome.
Materials and methods
Antibodies
Mouse monoclonal anti-ACTB/β actin (Sigma-Aldrich, A2228), monoclonal anti-BCL2 (Santa Cruz Biotechnology, sc-7382), polyclonal anti-AMBRA1 (Novus, 26190002), monoclonal anti-AMBRA1 (Santa Cruz Biotechnology, sc-398204), mouse monoclonal anti-CYCS (Assay designs-Enzo Life Sciences, 6H2-B4), polyclonal anti-LC3 (Cell Signaling Technology, 2775), monoclonal anti-SQSTM1/p62 (Santa Cruz Biotechnology, sc-28369), polyclonal anti-activated BAX (6A7; Abcam 5714), polyclonal anti-BAX (Santa Cruz Biotechnology, sc-493, N-20), polyclonal anti-PARP1 (Cell Signaling Technology, 9542), goat anti-BAK1 (G-23; Santa Cruz Biotechnology, sc-832), mouse monoclonal anti-MYC (9E10; Santa Cruz Biotechnology, sc-4), mouse monoclonal anti-Flag (Sigma-Aldrich, F3165), rabbit polyclonal anti-SOD2/MnSOD (Enzo Life Sciences, 110F) and mouse monoclonal anti-TUBB/β tubulin (Sigma-Aldrich, T9026).
Cloning and plasmids
Construct coding for AMBRA1WT, AMBRA1D482A and AMBRA1CT (483-1300 amino acids) was cloned in pLPCX vector (Clontech, 631511).18
The construct coding for “mito-BCL2,” a mitochondrial-targeted BCL2 in which the C‐terminal hydrophobic sequence of BCL2 is exchanged for an equivalent sequence from modified ActA (Listeria monocytogenes actin assembly-inducing protein) which binds specifically to the cytoplasmic face of mitochondrial outer membranes, was kindly provided by Beth Levine9 and was cloned in prcCMV vector.
The mito-DsRED construct encodes for human Cox8A mitochondria signal which is fused with wild-type-DsRED in pcDNA3 vector (Invitrogen).
We summarized in the table all constructs used in the present work:
| Constructs | Type of mutation | Feature |
|---|---|---|
| Flag-tagged-AMBRA1D482A | Single-point mutation (D482 → A) on the predicted caspase cleavage site of AMBRA1 | This mutant of AMBRA1 is uncleavable by caspases following apoptosis induction and maintains its proautophagic activity |
| MYC-tagged-AMBRA1WT | No mutation | This construct encodes for the wild-type form of AMBRA1 |
| MYC-tagged-AMBRA1BH3-AE | Two-point mutations in the BH3 domain of AMBRA1 L1215 → A and G1219 → E | This mutant of AMBRA1 partially loses its binding with mito-BCL2 protein |
| Flag-tagged-AMBRA1CT | Terminal fragment of AMBRA1 resulting from caspase cleavage (483-1300 amino acids) | This construct encodes for the C-terminal part of AMBRA1 resulting fronm caspase cleavage. This fragment binds mito-BCL2 |
| Flag-tagged-AMBRA1CT-BH3-AE | Two-point mutations in the BH3 domain of the C-terminal fragment of AMBRA1L1215 → A and G1219 → E resulting from caspase cleavage (483-1300 amino acids) | This construct encodes a C-terminal fragment of AMBRA1 which partially loses its binding with mito-BCL2 |
| Mito-BCL2 | The mitochondrial-targeted BCL2 presents the C-terminal hydrophobic sequence of BCL2 exchanged for an equivalent sequence from modified ActA (Listeria monocytogenes Actin assembly-inducing protein), which binds specifically to the cytoplasmic face of mitochondrial outer membranes. In this case BCL2 is fused with ActA sequence. | This construct encodes a BCL2 protein that it is specifically targeted to the mitochondria where it acts as an antiapoptotic factor. |
| Mito-DsRED | Human Cox8A mitochondria signal is fused with wild-type-DsRED protein in pcDNA3 vector. | This construct encodes for a red protein that is targeted to the mitochondria. It is used in microscopy analysis in order to stain the mitochondria network. |
Point mutations were generated using the QuickChange site-directed mutagenesis kit (Stratagene, 200519) and all plasmid constructs made in this study were verified by DNA sequencing (Eurofins). The oligonucleotides used for mutagenesis, PCR, and DNA sequencing were purchased from Invitrogen.
Cell cultures
The human embryonic kidney HEK293 cells and HeLa cells were cultured in Dulbecco's modified Eagle's medium (Lonza, BE12-604F) supplemented with 10% FBS (Gibco; Thermo Fisher Scientific, 10270-106) , and 1% penicillin-streptomycin solution (Lonza, 17-602 E) at 37°C under 5% CO2.
Cell culture transfection
Transient transfections of expression plasmids into HEK293 cells were performed using TurboFect according to the supplier's instructions (Thermo Fisher Scientific, R0532).
Determination of cell viability
Cell survival was estimated by using the MTS assay or by counting the number of condensed or fragmented nuclei as observed using DAPI (Sigma Aldrich, D9542) staining. The tetrazolium salt MTS (3-[4,5-dimethyl-2-thiazolyl]-2-5diphenyl-2H tratrazolium bromide; Sigma Aldrich, M2128) was added to cell cultures (1 mg/ml) and incubated for 30 min a 37°C. Cells were then lysed in DMSO (Sigma Aldrich, 472301). Formazan production by living cells was assessed by measuring absorbance at 540 nm using a Biotek Elx-800 microplate reader (Mandel Scientific Inc.) For cell counting, cultures were fixed in 4% paraformaldehyde (Merck Millipore, 104005) in PBS (UCS Diagnostic, PBS1199) for 10 min at 4°C and stained with DAPI in PBS for 20 min at room temperature. Cells were washed 3 times with PBS, then mounted and observed under a ZEISS confocal laser microscope (CLSM700; Jena, Germany). For each condition, random images were captured and analyzed using Zen Light edition software. Cell viability was then scored on the basis of nuclear morphology: cells containing condensed or fragmented nuclei were counted as dying or dead cells.
Immunocytochemistry
Cells were washed in PBS and fixed with 4% paraformaldehyde in PBS for 15 min. After permeabilization with 0.4% Triton X-100 (Sigma Aldrich, X100) in PBS for 5 min, cells were blocked in 3% normal goat serum (Sigma-Aldrich, G9023) in PBS and incubated overnight at 4 degrees with primary antibodies. We used the antibodies directed against AMBRA1 and CYCS. Cells were then washed in blocking buffer and incubated for 1 h with labeled anti-mouse (Alexa Fluor 488; Thermo Fisher Scientific, A11017) or anti-rabbit (CyTM3; Jackson ImmunoResearch, 115-165-166) secondary antibodies. Nuclei were stained with 1 μg/ml DAPI and examined under a Zeiss LSM 700 100x oil-immersion objective (CLSM700; Jena, Germany). We used “ZEN 2009 Light edition” software for image analysis. All acquisitions were performed in non-saturated single z-confocal planes.
Western blot analysis
Cell extracts were centrifuged at 13,000 g for 10 min at 4°C. Protein concentrations were determined with the Bio-Rad Protein Assay Kit (Bio-Rad, 5000001). Cell extracts or immunoprecipitates were separated by SDS-PAGE and transferred onto nylon membranes (Immobilon P; Merck-Millipore, IPFL10100). Membranes were incubated with primary antibodies followed by horseradish peroxidase-conjugate secondary antibody (Bio-Rad, 1706515 and 1721011) and visualized with ECL (Merck-Millipore WBKLS0500).
Immunoprecipitation
Cells were lysed in RIPA buffer plus protease inhibitor cocktail (Sigma Aldrich, P8340). Equal amounts of protein (500 µg) were incubated with 2 µl of monoclonal anti-MYC antibody for 4 h followed by 60 min incubation with 30 µl of protein A agarose beads (Roche, 11719408001). The beads were collected by centrifugation and washed 4 times with the RIPA buffer. Proteins bound to the beads were eluted with 30 µl of SDS-polyacrylamide gel electrophoresis sample buffer and heated to 95°C for 10 min.
Mitochondria/cytosol purification
Mitochondria and cytosol purification occurs by standard differential centrifugations. HEK293 cells were suspended in homogenization buffer (0.25 M sucrose, 10 mM HEPES, pH 7, 1 mM EDTA [Sigma-Aldrich, S0389, H4034, and ED-100, respectively]) with protease and phosphatase inhibitors. Mitochondria suspensions were obtained homogenizing the solution with 40°–60 pulses (one pulse corresponds to approximately one sec), in vertical movements. After homogenization, the suspension was centrifuged at 11 000 g for 15 min at 4°C. The mitochondrial pellet fraction was suspended in isolation buffer (0.2 M sucrose, 10 mM Tris-MOPS [Sigma, M1254], pH 7.4, 0.1 mM EGTA-Tris [Sigma Aldrich, E4378]). The supernatant fraction corresponded to soluble cytosolic proteins.
Size-exclusion fast protein liquid chromatography (sec-FPLC)
Two milligrams of HEK293 cell lysate, obtained from DMSO-treated cells or staurosporine-treated cells, were injected onto a Superose 6 HR 10/30 fast protein liquid chromatography (FPLC) gel filtration column (Amersham Pharmacia Biosciences, 17-0537-01) connected to a Pharmacia LKB LCC 501 Plus FPLC System (Amersham Pharmacia LKB Biotechnologies, Piscataway, N.J.). Lysate preparation and column equilibration have been previously described.5 CAPN (calpain II inhibitor, 50 µM; Sigma-Aldrich, A6060) and CASP (Q-VD-OPH, 100 µM; Santa Cruz Biotechnology, sc-222230) inhibitors were added in the lysis buffer in order to prevent AMBRA1 cleavage during the fraction separation. Proteins were collected in 500 μl fractions, precipitated with 10% trichloroacetic acid, and resolved in SDS-PAGE for western blot analyses. Gel filtration column was calibrated as previously described.25 Equal amounts of each fraction were analyzed by western blot.
Quantification of CYCS release
Quantification of CYCS release from mitochondria was performed on transfected cells by densitometric analyses, as previously described.28 After background subtraction, CYCS cell-associated signals were quantified by manually outlining individual cells and measuring cell-associated fluorescence intensity with the ImageJ software (http://rsb.info.nih.gov/ij/). The F:A ratio defines mean fluorescence of individual cells (F) normalized to total cellular surface (A).
Statistical analyses
Statistical analyses were performed using the Student 2-tailed ttest. Data were shown as means ± SD of 3 independent experiments. Values of p < 0,05 were considered significant.
Supplementary Material
Abbreviations
- AMBRA1
autophagy/Beclin 1 regulator 1
- AMBRA1BH3-AE
autophagy/Beclin 1 regulator 1, mutated in BH3 motif
- AMBRA1CT
C-terminal part of AMBRA1
- AMBRA1CT-BH3-AE
C-terminal part of AMBRA1, mutated in BH3 motif
- BAX
BCL2-associated X protein
- BCL2
B-cell CLL/lymphoma 2
- BECN1
Beclin 1, autophagy related
- BH3
BCL2 homology domain 3
- CASP
caspase
- CYCS
cytochrome c, somatic
- FPLC
fast protein liquid chromatography
- HEK293
human embryonic kidney
- MOMP
mitochondrial outer membrane permeabilization
- Mito-BCL2
mitochondrial targeted BCL2
- PARK2
parkin RBR E3 ubiquitin protein ligase
- STS
staurosporin
Disclosure of potential conflicts of interest
The authors declare no conflict of interest.
Acknowledgments
We thank M. Acuña Villa andM. Bennett for secretarial and proofreading work, and V. Nanni and B. Biferali for research assistance. We are indebted to B. Levine (Dallas, TX), for kindly providing us with the mito-BCL2 construct and M. Priault (Bordeaux, France) for kindly providing us with the MCL1 and BCL2L1 constructs.
Funding
This work was supported in part by grants from the Telethon Foundation (GGP14202), AIRC (IG2013 to FC, IG2012-13529 and IG 2015-17404 to GMF), FISM (2013), the Italian Ministry of University and Research (FIRB Accordi di Programma 2011), the Italian Ministry of Health (Ricerca Finalizzata and Ricerca Corrente to FC and GMF, Progetto Giovani Ricercatori GR2011-2012 to FS). VC is supported by the Lundbeck Foundation (R165-2013-15982). This work has been also supported by a KBVU grant from the Danish Cancer Society (R72-A4408). We are also grateful to the Bjarne Saxhof Foundation, the Lundbeck Foundation (R167-2013-16100), and the NovoNordisk Foundation (7559). Further, FC lab in Copenhagen is part of the Center of Excellence in Autophagy, Recycling and Disease (CARD), funded by the Danish National Research Foundation.
References
- [1].Fimia GM, Stoykova A, Romagnoli A, Giunta L, Nardacci R, Corazzari M, Fuoco C, Ucar A, Schwartz P, Gruss P, et al.. Ambra1 regulates autophagy and development of the nervous system. Nature 2007; 447: 1121-1125; PMID:17589504 [DOI] [PubMed] [Google Scholar]
- [2].Di Bartolomeo S, Corazzari M, Nazio F, Oliverio S, Lisi G, Antonioli M, Paglierini V, Mattoni S, Fuoco C, Giunta L, et al.. The dynamic interaction of AMBRA1 with the dynein motor complex regulates mammalian autophagy. J Cell Biol. 2010; 191:155-68; PMID; http://dx.doi.org/ 10.1083/jcb.201002100 [DOI] [PMC free article] [PubMed] [Google Scholar]
- [3].He C, Levine B. The Beclin 1 interactome. Curr Opin Cell Biol. 2010; 2:140-9; http://dx.doi.org/ 10.1016/j.ceb.2010.01.001 [DOI] [PMC free article] [PubMed] [Google Scholar]
- [4].Nazio F, Strappazzon F, Antonioli M, Bielli P, Cianfanelli V, Bordi M, Gretzmeier C, Dengjel J, Piacentini M, Fimia GM, et al.. mTOR inhibits autophagy by controlling ULK1 ubiquitination, self-association and function via AMBRA1 and TRAF6. Nat Cell Biol. 2013; 4:406-16; http://dx.doi.org/ 10.1038/ncb2708 [DOI] [PubMed] [Google Scholar]
- [5].Cianfanelli V, Fuoco C, Lorente M, Salazar M, Quondamatteo F, Gherardini PF, De Zio D, Nazio F, Antonioli M, D'Orazio M, et al.. AMBRA1 links autophagy to cell proliferation and tumorigenesis by promoting c-Myc dephosphorylation and degradation. Nat Cell Biol. 2015; 17:20-30; PMID:25438055; http://dx.doi.org/ 10.1038/ncb3072 [DOI] [PMC free article] [PubMed] [Google Scholar]
- [6].Antonioli M, Albiero F, Nazio F, Vescovo T, Perdomo AB, Corazzari M, Marsella C, Piselli P, Greztmeier P, Denjiel J, et al.. AMBRA1 interplay with cullin E3 ubiquitin ligases regulates autophagy dynamics. Dev Cell. 2014; 6:734-46; http://dx.doi.org/ 10.1016/j.devcel.2014.11.013 [DOI] [PubMed] [Google Scholar]
- [7].Strappazzon F, Vietri-Rudan M, Campello S, Nazio F, Florenzano F, Fimia GM, Piacentini M, Levine B, Cecconi F. Mitochondrial BCL-2 inhibits AMBRA1-induced autophagy. Embo j. 2011; 30:1195-208; PMID:21358617; http://dx.doi.org/ 10.1038/emboj.2011.49 [DOI] [PMC free article] [PubMed] [Google Scholar]
- [8].Strappazzon F, Nazio F, Corrado M, Cianfanelli V, Romagnoli A, Fimia GM, Campello S, Nardacci R, Piacentini M, Campanella M. et al.. AMBRA1 is able to induce mitophagy via LC3 binding, regardless of PARKIN and p62/SQSTM1. Cell Death Differ. 2015; 3:419-32; http://dx.doi.org/ 10.1038/cdd.2014.139 [DOI] [PMC free article] [PubMed] [Google Scholar]
- [9].Pattingre S, Tassa A, Qu X, Garuti R, Liang XH, Mizushima N, Packer M, Schneider MD, Levine B. Bcl-2 antiapoptotic proteins inhibit Beclin 1-dependent autophagy. Cell 2005; 122:927-39; PMID:16179260; http://dx.doi.org/ 10.1016/j.cell.2005.07.002 [DOI] [PubMed] [Google Scholar]
- [10].Chang NC, Nguyen M, Germain M, Shore GC. Antagonism of Beclin 1-dependent autophagy by BCL-2 at the endoplasmic reticulum requires NAF-1. Embo J 2010; 29:606-18; PMID; http://dx.doi.org/ 10.1038/emboj.2009.369 [DOI] [PMC free article] [PubMed] [Google Scholar]
- [11].Cho DH, Jo YK, Hwang JJ, Lee YM, Roh SA, Kim JC. Caspase-mediated cleavage of ATG6/Beclin-1 links apoptosis to autophagy in HeLa cells. Cancer Lett. 2009; 274:95-100; PMID:18842334; http://dx.doi.org/ 10.1016/j.canlet.2008.09.004 [DOI] [PubMed] [Google Scholar]
- [12].Luo S, Rubinsztein DC. Apoptosis blocks Beclin 1-dependent autophagosome synthesis: an effect rescued by Bcl-xL. Cell Death Differ 2010; 17:268-277; PMID:19713971; http://dx.doi.org/ 10.1038/cdd.2009.121 [DOI] [PMC free article] [PubMed] [Google Scholar]
- [13].Zhu Y, Zhao L, Liu L, Gao P, Tian W, Wang X, Jin H, Xu H, Chen Q. Beclin 1 cleavage by caspase-3 inactivates autophagy and promotes apoptosis. Protein Cell 2010; 1:468-477; PMID:21203962; http://dx.doi.org/ 10.1007/s13238-010-0048-4 [DOI] [PMC free article] [PubMed] [Google Scholar]
- [14].Djavaheri-Mergny M, Maiuri MC, Kroemer G. Cross talk between apoptosis and autophagy by caspase-mediated cleavage of Beclin 1. Oncogene 2010; 12:1717-9; http://dx.doi.org/ 10.1038/onc.2009.519 [DOI] [PubMed] [Google Scholar]
- [15].Maiuri MC, Criollo A, Kroemer G. Crosstalk between apoptosis and autophagy within the Beclin 1 interactome. Embo J 2010; 29:515-6; PMID:20125189; http://dx.doi.org/ 10.1038/emboj.2009.377 [DOI] [PMC free article] [PubMed] [Google Scholar]
- [16].Pyo JO, Jang MH, Kwon YK, Lee HJ, Jun JI, Woo HN, Cho DH, Choi B, Lee H, Kim JH, et al.. Essential roles of Atg5 and FADD in autophagic cell death: dissection of autophagic cell death into vacuole formation and cell death. J. Biol. Chem. 2005; 280:20722-9; PMID:15778222; http://dx.doi.org/ 10.1074/jbc.M413934200 [DOI] [PubMed] [Google Scholar]
- [17].Yousefi S, Perozzo R, Schmid I, Ziemiecki A, Schaffner T, Scapozza L, Brunner T, Simon HU. Calpain-mediated cleavage of Atg5 switches autophagy to apoptosis. Nat. Cell Biol. 2006; 8:1124-32; PMID:16998475; http://dx.doi.org/ 10.1038/ncb1482 [DOI] [PubMed] [Google Scholar]
- [18].Zalckvar E, Yosef N, Reef S, Ber Y, Rubinstein AD, Mor I, Sharan R, Ruppin E, Kimchi A. A systems level strategy for analyzing the cell death network: implication in exploring the apoptosis/autophagy connection. Cell Death Differ. 2010; 17:1244-53; PMID; http://dx.doi.org/ 10.1038/cdd.2010.7 [DOI] [PubMed] [Google Scholar]
- [19].Maskey D, Yousefi S, Schmid I, Zlobec I, Perren A, Friis R, Simon HU. ATG5 is induced by DNA-damaging agents and promotes mitotic catastrophe independent of autophagy. Nat Commun. 2013; 4:2130; PMID:23945651; http://dx.doi.org/ 10.1038/ncomms3130 [DOI] [PMC free article] [PubMed] [Google Scholar]
- [20].Pagliarini V, Wirawan E, Romagnoli A, Ciccosanti F, Lisi G, Lippens S, Cecconi F, Fimia GM, Vandenabeele P, Corazzari M, et al.. Proteolysis of Ambra1 during apoptosis has a role in the inhibition of the autophagic pro-survival response. Cell Death Differ. 2012; 9:1495-504; http://dx.doi.org/ 10.1038/cdd.2012.27 [DOI] [PMC free article] [PubMed] [Google Scholar]
- [21].Rubinstein AD, Eisenstein M, Ber Y, Bialik S, Kimchi A. The autophagy protein Atg12 associates with antiapoptotic Bcl-2 family members to promote mitochondrial apoptosis. Mol Cell. 2011; 5:698-709; http://dx.doi.org/ 10.1016/j.molcel.2011.10.014 [DOI] [PubMed] [Google Scholar]
- [22].Lee JY, Nagano Y, Taylor JP, Lim KL, Yao TP. Disease-causing mutations in parkin impair mitochondrial ubiquitination, aggregation, and HDAC6-dependent mitophagy. J Cell Biol. 2010; 4:671-9; http://dx.doi.org/ 10.1083/jcb.201001039 [DOI] [PMC free article] [PubMed] [Google Scholar]
- [23].Cianfanelli V, De Zio D, Di Bartolomeo S, Nazio F, Strappazzon F, Cecconi F. Ambra1 at a glance. Cell Science at a glance 2015; 11:2003-8; http://dx.doi.org/ 10.1242/jcs.168153 [DOI] [PubMed] [Google Scholar]
- [24].Malik SA, Shen S, Mariño G, BenYounès A, Maiuri MC, Kroemer G. BH3 mimetics reveal the network properties of autophagy-regulatory signaling cascades. Autophagy. 2011; 8:914-6; http://dx.doi.org/ 10.4161/auto.7.8.15785 [DOI] [PubMed] [Google Scholar]
- [25].Huang Z. Bcl-2 family proteins as targets for anticancer drug design. Oncogene 19:6627-31; PMID:11426648; http://dx.doi.org/ 10.1038/sj.onc.1204087 [DOI] [PubMed] [Google Scholar]
- [26].Karnak D, Xu L. Chemosensitization of prostate cancer by modulating Bcl-2 family proteins. Curr Drug Targets 2010; 11:699-707; PMID; http://dx.doi.org/ 10.2174/138945010791170888 [DOI] [PMC free article] [PubMed] [Google Scholar]
- [27].Cianfanelli V, D'Orazio M, Cecconi F. AMBRA1 and BECLIN 1 interplay in the crosstalk between autophagy and cell proliferation. Cell cycle 2015; 14:959-63; PMID:25803737; http://dx.doi.org/ 10.1080/15384101.2015.1021526 [DOI] [PMC free article] [PubMed] [Google Scholar]
- [28].Oddi S, Latini L, Viscomi MT, Bisicchia E, Molinari M, Maccarrone M. Distinct regulation of nNOS and iNOS by CB2 receptor in remote delayed neurodegeneration. J Mol Med (Berl) 2012; 90:371-87; PMID:22198001; http://dx.doi.org/ 10.1007/s00109-011-0846-z [DOI] [PubMed] [Google Scholar]
Associated Data
This section collects any data citations, data availability statements, or supplementary materials included in this article.