

ABSTRACT
Renal fibrosis is the final, common pathway of end-stage renal disease. Whether and how autophagy contributes to renal fibrosis remains unclear. Here we first detected persistent autophagy in kidney proximal tubules in the renal fibrosis model of unilateral ureteral obstruction (UUO) in mice. UUO-associated fibrosis was suppressed by pharmacological inhibitors of autophagy and also by kidney proximal tubule-specific knockout of autophagy-related 7 (PT-Atg7 KO). Consistently, proliferation and activation of fibroblasts, as indicated by the expression of ACTA2/α-smooth muscle actin and VIM (vimentin), was inhibited in PT-Atg7 KO mice, so was the accumulation of extracellular matrix components including FN1 (fibronectin 1) and collagen fibrils. Tubular atrophy, apoptosis, nephron loss, and interstitial macrophage infiltration were all inhibited in these mice. Moreover, these mice showed a specific suppression of the expression of a profibrotic factor FGF2 (fibroblast growth factor 2). In vitro, TGFB1 (transforming growth factor β 1) induced autophagy, apoptosis, and FN1 accumulation in primary proximal tubular cells. Inhibition of autophagy suppressed FN1 accumulation and apoptosis, while enhancement of autophagy increased TGFB1-induced-cell death. These results suggest that persistent activation of autophagy in kidney proximal tubules promotes renal interstitial fibrosis during UUO. The profibrotic function of autophagy is related to the regulation on tubular cell death, interstitial inflammation, and the production of profibrotic factors.
KEYWORDS: Autophagy, kidney injury, proximal tubule, renal fibrosis, unilateral ureteral obstruction
Introduction
Renal interstitial fibrosis, characterized by the excess deposition of extracellular matrix (ECM) in tubulointerstitium, is the final common pathway of all progressive chronic kidney diseases (CKD) leading to end-stage renal disease. The pathogenesis of fibrosis is thought to be a failed or maladaptive renal repair process that occurs after initial injuries, which involves an enormously complex and dynamic interaction and coordination of virtually all cell types in the kidney.1 Among them, the tubular epithelium plays an active role in regulating renal interstitial fibrosis, especially in the context of the transition from acute kidney injury (AKI) to CKD.2-4 Earlier studies show the appearance of focal fibrotic lesions around the atrophic, but not intact, proximal tubules after AKI.5,6 Further studies indicate that these atrophic proximal tubules are poorly differentiated, with hyperactive, autoregulated TGFB signaling and enhanced production of profibrotic cytokines.7-9 Using several models of AKI, more recent work demonstrates that a prolonged cell cycle G2/M arrest in proliferating tubular cells may facilitate the generation and secretion of profibrotic cytokines.10 Interestingly, these tubule-derived molecules may induce epigenetic modifications in resident fibroblasts, leading to persistent activation of fibroblasts and renal interstitial fibrosis.11 Repeated acute injury in proximal tubules is sufficient to trigger interstitial fibrosis and glomerulosclerosis.12 Therefore, diseased proximal tubules may be a driving force for interstitial fibrosis through autocrine signals on themselves and paracrine activities on neighboring cells.3,4
Autophagy is a cellular process of bulk degradation of cytoplasmic components via the formation of autophagosomes followed by autolysosomes.13 In addition to its bona fide function of catabolism, autophagy is a cellular response to stress and plays important roles in the pathogenesis of various diseases.14-16 This “self-eating” process primarily acts as a prosurvival mechanism, whereas deregulated autophagy may also contribute to cell death.13,15 In nephrotoxic and ischemic kidney injury models, autophagy is induced in proximal tubules and plays a protective role.17-21 Recent work has further demonstrated autophagy in fibrotic diseases of the liver, lung and heart. Intriguingly, depending on the cell or tissue type and pathological settings, autophagy can be profibrotic or antifibrotic in these organs.22-25 For example, autophagy induced in hepatic stellate cells can break down lipids to fuel the activation of these cells to promote liver fibrosis.26,27 In contrast, autophagy in hepatic macrophages and hepatocytes inhibits inflammation and apoptosis, resulting in the prevention of liver fibrosis.23 In the kidney, autophagy appears to occur in the UUO model of kidney fibrosis.28-32 Also, TGFB1 activates autophagy in renal tubules in mice and in cultured renal tubular and mesangial cells.33-35 Under these conditions, however, the role(s) of autophagy in renal interstitial fibrosis is poorly understood.36 On the one hand, autophagy has been suggested to induce tubular atrophy and decomposition to promote fibrosis.28,29,31,35 On the other hand, autophagy may contribute to the degradation of COL1/collagen I and active TGFB1 to inhibit kidney fibrosis.32,34 Thus, autophagy regulation in renal fibrosis may be multifaceted and cell-specific. As a result, dissecting autophagy in different cell types of the kidney to understand their regulation of fibrosis is particularly necessary.
In the current study, we investigated the role of autophagy in renal interstitial fibrosis using both in vivo and in vitro models. The experiments examined the effects of autophagy inhibitors and kidney proximal tubule-specific Atg7 knockout, demonstrating a profibrotic role of autophagy. Mechanistically, we showed the evidence that autophagy in proximal tubules may promote fibrosis by coordinately activating tubular cell death, interstitial inflammation, and particularly, the production of profibrotic factors such as FGF2.
Results
Autophagy is persistently induced in kidney proximal tubules during UUO
To examine autophagy in C57Bl/6 mice subjected to UUO, we first performed immunohistochemical staining of MAP1LC3B/LC3B (microtubule-associated protein 1 light chain 3 isoform B) in kidney tissues. When autophagy is absent, the localization pattern of LC3B in cells is diffuse in cytosol (unlipidated LC3B-I). In contrast, lipidated, membrane-bound LC3B (LC3B-II) gives a granular, punctate staining scattered throughout the cytoplasm, reflecting the formation of autophagosomes.37 As shown in Figure 1A, albeit at a low intensity, sham-operated mice had a granular staining of LC3B in the cytoplasm of proximal tubules, indicating a basal level of autophagy that is essential for maintaining tubular homeostasis. Importantly, LC3B granules increased significantly in both numbers and intensity one week after UUO. By quantification, the number of LC3B-positive puncta was increased from 3 per proximal tubule in control tissues to 15 in obstructed kidneys (Fig. 1B). As accumulation of autophagosomes at a steady-state level could reflect either induction of autophagy or reduction in autophagic flux, we then monitored the dynamic changes of autophagosome formation and maturation in obstructed proximal tubules by using CAG-RFP-GFP-LC3 transgenic mice. These autophagy reporter mice express a tandem RFP-GFP-LC3 fusion protein ubiquitously under the control of a CAG promoter.38 The principle of this method is that acid-sensitive GFP fluorescence can be quenched in the low pH lysosomal environment (pH 4 to 5) whereas acid-insensitive RFP is more stable and maintained.38,39 Therefore, colocalization of RFP fluorescence with GFP in a particle indicates an autophagosome, whereas a RFP-only signal without GFP is considered an autolysosome.38,39 In sham-operated mice, minimal amount of GFP-LC3 and RFP-LC3 puncta with a relatively weak signal was detected mainly at the apical region of proximal tubular cells toward the lumen (Fig. 1C, sham). One week after UUO, numerous GFP-LC3 and RFP-LC3 puncta accumulated around the nuclei in proximal tubular cells (Fig. 1C, UUO 1-w). Despite the occasional appearance of GFP-only puncta (less than 5% of the total number of GFP-LC3 dots) for unknown reasons, most of the GFP signals (more than 95%) were colocalized with RFP, giving a yellow staining that indicated autophagosomes. Notably, a portion of the RFP-LC3 puncta either did not have GFP or coemitted very weak GFP signals and in turn, showed orange-red color in overlapping images indicative of autolysosomes (Fig. 1C). Quantitative analysis at multiple time points further demonstrated that UUO induced the formation of autophagosomes as well as the maturation to autolysosomes in a time-dependent manner (Fig. 1D). Sham control mice had an average of 6 autophagosomes per proximal tubule, which was increased by UUO to 17 on d 2 and further to 23 on d 4. One wk after UUO, the induction of autophagosome formation reached a peak at 41 and then reduced to 36 by the end of 2 wk (Fig. 1D, GFP). The number of autolysosomes per proximal tubule was reduced from a basal level of 3 to 1 after the first 2 d of UUO, suggesting that autophagosome formation was predominant at this time point. Starting from d 4, the number of autolysosomes per proximal tubule was remarkably increased by UUO, with 22 on d 4, 43 by 1 wk, and 32 by 2 wk, respectively (Fig. 1D, RFP-GFP). We further calculated the proportion of autolysosomes in the total number of autophagosomes and autolysosomes to indicate autophagic turnover or flux. There was a basal rate of 30% autophagic flux in sham control mice, which was briefly reduced by UUO to 6% on d 2 but significantly increased to 50% on d 4. Importantly, this rate was maintained at the high level throughout 2 wk of UUO treatment (Fig. 1E). To further determine the temporal relationship between autophagy and renal fibrosis, we collected kidney cortical tissues at different time points following UUO and examined the expression of autophagy proteins (LC3B and SQSTM1/p62 [sequestosome 1]), and fibrosis markers (FN1 [fibronectin 1] and ACTA2/α-smooth muscle actin [actin, α 2, smooth muscle, aorta]). The results are shown in Fig. 1F and 1G. Upon UUO, LC3B-II accumulated in a time-dependent manner in kidney tissues. A slight increase of LC3B-II was detected on d 4, which was significantly enhanced by 1 wk (2-fold) and further increased after 2 wk (3-fold). Although not obvious at earlier time points, the degradation of SQSTM1, a selective autophagy receptor and substrate, occurred 2 wk after UUO, showing ˜50% decrease compared to sham control. Together with LC3 staining, these results suggest that autophagy is persistently induced in proximal tubules following UUO. Along with autophagy induction in proximal tubules, UUO led to a progressive renal interstitial fibrosis. ACTA2 was upregulated in a time-dependent manner, indicating proliferation of interstitial fibroblasts with myofibroblast transformation. Expression of FN1, an ECM protein, was also markedly increased in obstructed kidney tissues (Fig. 1F and 1G). UUO-induced kidney fibrosis was further determined morphologically by Masson trichrome staining (Fig. 1H). Massive collagen deposition was detected in renal interstitium following 2 wk of UUO, either diffusely expanding along damaged or atrophic tubules or forming foci close to small blood vessels. No fibrotic lesion was seen in sham-operated mice. Collectively, these results suggest that autophagy is induced and sustained in proximal tubules during UUO, along with the progression of renal interstitial fibrosis.
Figure 1.

Autophagy is persistently induced in renal proximal tubules during UUO. C57Bl/6 (A, B, F, G and H) or CAG-RFP-GFP-LC3 (C, D and E) mice were subjected to either sham operation or UUO surgery. The mice were sacrificed at the indicated time points (2 days, 4 d, 1 wk and 2 wk) and left kidneys were collected for histological and immunoblot analyses. (A) Representative images of immunohistochemical staining of LC3B. Occasionally, there was LC3B-positive staining in nuclei; however, no LC3B-positive staining was observed in either sham control or UUO kidney tissues in the absence of primary antibody (data not shown), suggesting the specificity of this LC3B staining. Scale bar: 20 µm. (B) Quantitative analysis of punctate LC3B staining. Data are expressed as mean ± SD. *, P < 0.05, significantly different from the sham group. (C) Representative images of GFP-LC3 and RFP-LC3 fluorescence staining. Scale bar: 15 µm. (D) Quantitative analysis of GFP-LC3 and RFP-LC3 puncta. Data are expressed as mean ± SD. *, P < 0.05, significantly different from the sham group; #, P < 0.05, values of RFP-LC3 puncta significantly different from the relevant values of GFP-LC3 puncta. (E) Analysis of autophagic flux rate. Data are expressed as mean ± SD. *, P < 0.05, significantly different from the sham group. (F) Representative images of immunoblot analysis of LC3B, SQSTM1, ACTA2, and FN1. PPIB was used as a loading control. (G) Densitometric analysis of LC3B, SQSTM1, ACTA2, and FN1 signals. After normalization with PPIB, the protein signal of the sham was arbitrarily set as 1, and the signals of other conditions were normalized with the sham control to calculate fold changes. Data are expressed as mean ± SD. *, P < 0.05, significantly different from the sham group. (H) Representative images of Masson trichrome staining. Scale bar: 50 µm.
Pharmacological inhibition of autophagy suppresses kidney fibrosis and tubular apoptosis induced by UUO
To delineate the role of autophagy in regulating renal fibrosis, we first examined the effects of 2 pharmacological autophagy inhibitors, chloroquine and 3-methyladenine, on UUO-induced fibrosis in C57Bl/6 mice. As shown in Fig. 2A, UUO led to autophagy in kidney cortical tissues, as indicated by accumulation of LC3B-II and decrease of SQSTM1 (lane 2 vs lane 1). By blocking lysosomal degradation of autophagosomes, chloroquine further enhanced LC3B-II accumulation and prevented SQSTM1 degradation (lane 3 vs lane 2). 3-methyladenine, a class I phosphoinositide 3-kinase and class III phosphatidylinositol 3-kinase inhibitor that blocks autophagosome formation, reduced LC3B-II accumulation as well as SQSTM1 degradation (lane 4 vs lane 2). These results confirm the inhibitory effects of these 2 inhibitors on autophagy at different stages. Under this condition, UUO-induced kidney interstitial fibrosis was notably attenuated. Upregulation of ACTA2 and FN1 following UUO was partially but significantly reduced by both chloroquine and 3-methyladenine (Fig. 2A, lanes 3 and 4 vs lane 2). These observations were verified by densitometric analyses (Fig. 2B). In addition, UUO-induced collagen deposition was also inhibited in the presence of chloroquine or 3-methyladenine (Fig. 2C). Morphometric analyses of the collagen-positive stained areas revealed that UUO induced 14.7% interstitial fibrosis after one wk of obstruction, which was significantly reduced to 9.3% by chloroquine and to 8.9% by 3-methyladenine, respectively. The antifibrotic effects of chloroquine and 3-methyladenine were maintained throughout 2 wk of obstruction (Fig. 2D). Together, these pharmacological results suggest that persistent autophagy induced in obstructed proximal tubules may facilitate the progression of kidney interstitial fibrosis.
Figure 2.

Pharmacological inhibition of autophagy reduces interstitial fibrosis during UUO. C57Bl/6 mice were divided into 4 groups: 1. sham operation; 2. UUO + saline; 3. UUO + 60 mg/kg chloroquine (CQ); 4. UUO + 30 mg/kg 3-methyladenine (3-MA). The mice were sacrificed at the indicated time points (1 wk and 2 wk) and left kidneys were collected for histological and immunoblot analyses. (A) Representative images of immunoblot analysis of LC3B, SQSTM1, ACTA2, and FN1. ACTB was used as a loading control. (B) Densitometric analysis of LC3B, SQSTM1, ACTA2, and FN1 signals. After normalization with ACTB, the protein signal of the sham was arbitrarily set as 1, and the signals of other conditions were normalized with the sham to calculate fold changes. Data are expressed as mean ± SD. *, P < 0.05, significantly different from the sham group; #, P < 0.05, significantly different from the UUO + saline group. (C) Representative images of Masson trichrome staining. Scale bar: 50 µm. (D) Quantitative analysis of Masson trichrome staining. Data are expressed as mean ± SD. *, P < 0.05, significantly different from the sham group; #, P < 0.05, significantly different from the UUO + saline group.
UUO initiates a series of events in obstructed kidneys, which include interstitial inflammation, tubular cell death, phenotypic transition of resident renal cells, proliferation and activation of fibroblasts, and excess ECM deposition, eventually leading to the development of kidney fibrosis.40 Among these events tubular cell death appears to have a close association with progressive cell loss and tubular atrophy during fibrosis.40 The involvement of tubular cell apoptosis in renal interstitial fibrosis during UUO has also been documented by previous studies.41,42 To determine the role of autophagy in UUO-induced tubular cell apoptosis, we performed TUNEL (terminal deoxynucleotidyl transferase-mediated dUTP nick end labeling) staining (Fig. 3). While no TUNEL-positive cells were detected in sham-operated mice, 89 apoptotic cells per mm2 tissue were detected after 1 wk of UUO, which was reduced respectively to 59 by choloroquine and to 63 by 3-methyladenine (Fig. 3A, 3B). At 2 wk of UUO, the number of apoptotic cells increased to 161, which was again suppressed by both chloroquine and 3-methyladenine (Fig. 3B). Together, these results suggest that sustained autophagy in obstructed kidneys may contribute to UUO-induced tubular cell death.
Figure 3.
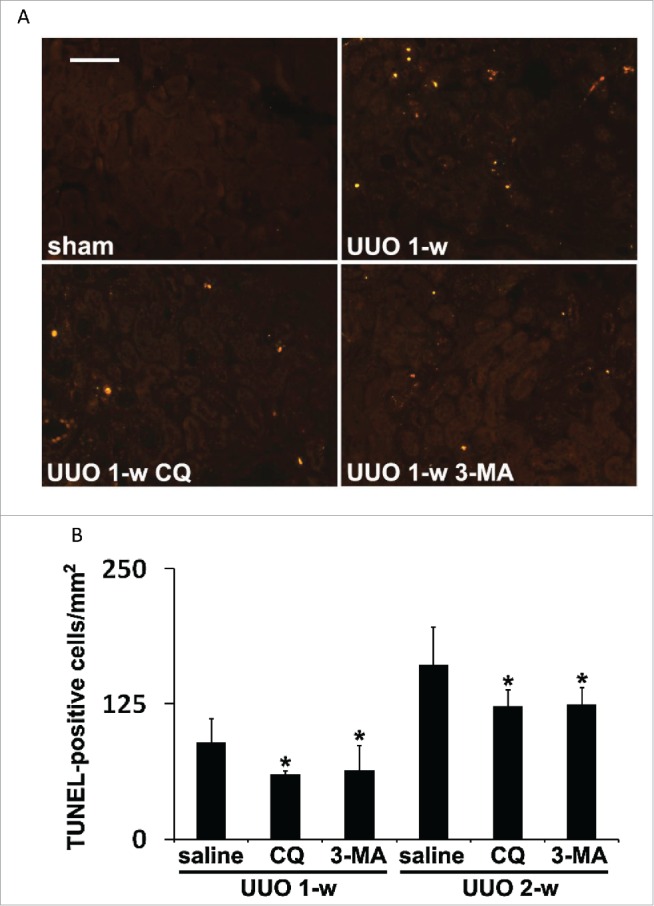
Pharmacological inhibition of autophagy attenuates tubular cell apoptosis induced during UUO. Animals and their treatment were the same as described in Figure 2. (A) Representative images of TUNEL staining. Scale bar: 50 µm. (B) Quantitative analysis of TUNEL staining. Data are expressed as mean ± SD. *, P < 0.05, significantly different from the UUO + saline group.
UUO-induced renal fibrosis together with tubular apoptosis and interstitial inflammation are suppressed in PT-Atg7 KO mice with impaired autophagy
The findings from our pharmacological experiments are in sharp contrast to a recent study showing that inhibition of autophagy by 3-methyladenine enhances tubular cell apoptosis and interstitial fibrosis in rats subjected to UUO.30 To address this discrepancy and further define the role of tubular autophagy in kidney fibrosis, we employed a conditional knockout mouse model with Atg7 specifically deleted from renal proximal tubules (PT-Atg7 KO). This model was recently generated by our lab and demonstrated autophagy defects in proximal tubules in nephrotoxic and ischemic models of AKI.21 We first verified the effects of Atg7 deficiency in proximal tubules on UUO-induced autophagy. In floxed control (PT-Atg7 FC) mice, UUO induced the accumulation of LC3B-positive puncta in proximal tubules, indicating an increase of autophagosome formation (Fig. 4A: upper 2 panels). In contrast, no obvious punctate LC3B staining was detected in proximal tubules of PT-Atg7 KO mice subjected to either sham or UUO surgery; instead, diffuse and homogenous LC3B staining was observed in some tubules (Fig. 4A: lower 2 panels). At higher magnifications, granular membrane-bound LC3B staining was clearly shown in UUO-treated floxed control mice, whereas cytosolic LC3B was observed in the PT-Atg7 KO kidney tubular cells (Fig. 4B). The morphological findings were confirmed by immunoblot analysis (Fig. 4C). Following UUO, floxed control mice had a time-dependent LC3B-II accumulation with LC3B-I barely detected, whereas the conversion of LC3B-I to LC3B-II was significantly inhibited in PT-Atg7 KO mice. Consistently, degradation of SQSTM1 was abrogated in the knockout kidneys. Compared with floxed control tissues, expression of ATG7 was largely reduced in PT-Atg7 KO mice. Thus, both basal and UUO-induced autophagy in renal proximal tubules was impaired in PT-Atg7 KO mice.
Figure 4.
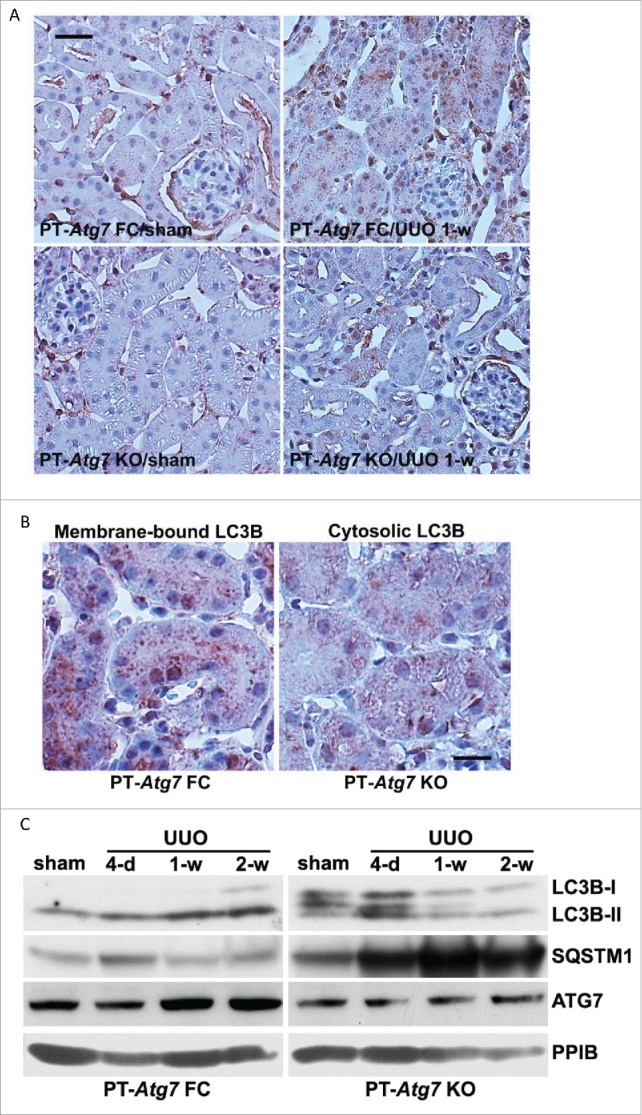
Autophagy in proximal tubules is impaired in PT-Atg7 knockout mice during UUO. Floxed control (PT-Atg7 FC) and PT-Atg7 KO mice (littermates or age-matched) were subjected to either sham operation or UUO surgery. The mice were sacrificed at the indicated time points (4 d, 1 wk and 2 wk) and left kidneys were collected for histological and immunoblot analyses. (A) Representative images of immunohistochemical staining of LC3B. Scale bar: 20 µm. (B) Enlarged images of LC3B staining. Scale bar: 20 µm. (C) Representative images of immunoblot analysis of LC3B, SQSTM1, and ATG7. PPIB was used as a loading control.
Using PT-Atg7 KO mice, we then determined the role of proximal tubular autophagy in regulating renal interstitial fibrosis. As shown in Fig. 5A, ACTA2 was induced in floxed control kidney tissues following UUO (lanes 3, 5 and 7 vs lane 1), which was markedly suppressed in PT-Atg7 KO kidneys at 4-d and one wk of treatment (lane 3 vs lane 4, lane 5 vs lane 6). By 2 wk of UUO, a similar amount of ACTA2 was induced in both floxed control and PT-Atg7 KO mice (lane 7 vs lane 8). Nevertheless, UUO-induced upregulation of VIM, another fibroblast marker, was reduced by Atg7 deficiency at both one-wk and 2wk time points (Fig. 5A). Consistently, compared to the floxed control mice, UUO-induced accumulation of FN1 in kidney tissues was also attenuated in PT-Atg7 KO mice. Of interest, UUO led to an increased expression of FGF2 in floxed control kidneys, which was notably reduced in PT-Atg7 KO mice (Fig. 5A). These results were confirmed by densitometric analyses of the immunoblots from at least 5 separate experiments (Fig. 5B). In addition to FGF2, UUO also induced the expression of other profibrotic cytokines, such as active TGFB1, CTGF (connective tissue growth factor), and PDGFB (platelet derived growth factor, subunit B), in floxed control mice (Fig. S1). Interestingly, induction of these cytokines was not suppressed in PT-Atg7 KO kidneys, suggesting that autophagy in proximal tubular cells may specifically participate in the production of FGF2 during UUO. We further examined kidney fibrosis by Masson trichrome staining (Fig. 5C). No obvious tubulointerstitial collagen/blue staining was detected in sham-operated floxed control or PT-Atg7 KO animals. Two wk after UUO, a widespread collagen deposition was seen in renal interstitium of floxed control mice. Much less collagen-positive staining was detected in PT-Atg7 KO tissue as compared to the floxed control. Consistently, morphometric analysis showed that UUO induced 8.4% interstitial fibrosis in floxed control kidneys after 4 d of obstruction, which was further increased to 13.5% by one wk and 25% after 2 wk. The fibrotic lesions were significantly reduced in PT-Atg7 KO kidneys at all 3 time points, with 4.5% for 4-d, 7.9% for wk 1 and 15.2% for wk 2 respectively (Fig. 5D). Periodic acid-Schiff (PAS) staining further revealed that one or 2 wk following UUO normal proximal tubules were decreased in number and the tubules became atretic in both floxed control and PT-Atg7 KO kidneys (Fig. 5E). In floxed control mice, many proximal tubules were variably dilated and lined by flat, thin epithelium devoid of brush borders at one wk of UUO. By 2 wk, the majority of proximal tubules became atrophic and enveloped by greatly thickened or wrinkled basement membranes or disappeared altogether. The peritubular interstitium was significantly expanded with infiltrated cells (Fig. 5E, PT-Atg7 FC). The pathology of tubular atrophy was ameliorated in PT-Atg7 KO mice. Less tubular dilation and/or atresia were seen in these mice. In some areas, the structure of proximal tubules was relatively well preserved with intact brush borders stained red-purple. The expansion of fibrotic interstitium and tubular basement membranes was also reduced (Fig. 5E, PT-Atg7 KO). Kidney tissues were further stained with lotus tetragonolobus lectin (LTL), a proximal tubule marker. Compared to floxed control kidneys, more LTL-positive proximal tubules were preserved in PT-Atg7 KO kidneys following UUO (Fig. 5F). Quantitative analysis of LTL-positive stained areas further confirmed that nephron loss in floxed control mice was partially but significantly attenuated in PT-Atg7 KO mice (Fig. 5G). These results suggest that persistent autophagy in proximal tubular cells may represent a cell injury mechanism that contribute to tubular atrophy and nephron loss during UUO-induced renal fibrosis.
Figure 5.

Autophagy deficiency in PT-Atg7 knockout mice suppresses renal interstitial fibrosis, tubular atrophy and nephron loss during UUO. Animals and their treatment were the same as described in Fig. 4. (A) Representative images of immunoblot analysis of ACTA2, VIM, FN1, and FGF2. PPIB was used as a loading control. (B) Densitometric analysis of ACTA2, VIM, FN1, and FGF2 signals. After normalization with PPIB, the protein signal of PT-Atg7 FC sham was arbitrarily set as 1, and the signals of other conditions were normalized with PT-Atg7 FC sham to calculate fold changes. Data are expressed as mean ± SD. *, P < 0.05, significantly different from PT-Atg7 FC sham group; #, P < 0.05, significantly different from the relevant PT-Atg7 FC group. (C) Representative images of Masson trichrome staining. Scale bar: 50 µm. (D) Quantitative analysis of Masson trichrome staining. Data are expressed as mean ± SD. *, P < 0.05, significantly different from PT-Atg7 FC sham group; #, P < 0.05, significantly different from the relevant PT-Atg7 FC group. (E) Representative images of PAS staining. Scale bar: 50 µm. (F) Representative images of LTL staining. Scale bar: 50 µm. (G) Quantitative analysis of LTL staining. Data are expressed as mean ± SD. *, P < 0.05, significantly different from PT-Atg7 FC sham group; #, P < 0.05, significantly different from the relevant PT-Atg7 FC group.
We further examined tubular cell apoptosis and inflammation during UUO (Fig. 6). No TUNEL-positive cells were detected in sham-operated mice. Following UUO, there was a time-dependent increase of tubular cell apoptosis in floxed control mice, which was inhibited in PT-Atg7 KO kidneys. Quantification of TUNEL-positive cells revealed that the most effective inhibition was detected at 1 week of UUO, from 111 in floxed control mice reduced to 48 in PT-Atg7 KO mice (Fig. 6A and 6B). UUO-induced interstitial inflammation was determined by immunohistochemical analysis of macrophage infiltration. As shown in Figure 6C, macrophages were very rarely seen in sham mice regardless of genotype. UUO induced a peritubular accumulation of macrophages in both floxed control and PT-Atg7 KO mice, with the latter showing much less intense staining. Indeed quantitatively, the areas of tubulointerstitial macrophage infiltration in PT-Atg7 KO mice were significantly less than those in the floxed control, suggesting that UUO-induced interstitial inflammation was also suppressed by autophagy impairment (Fig. 6D). Together with the pharmacological results (Figs. 2, 3), these studies provide convincing evidence that persistent activation of autophagy in proximal tubules promotes kidney interstitial fibrosis during UUO. Mechanistically, autophagy may regulate interstitial fibrosis by activating tubular cell death, interstitial inflammation, and the production of specific profibrotic cytokines, such as FGF2.
Figure 6.
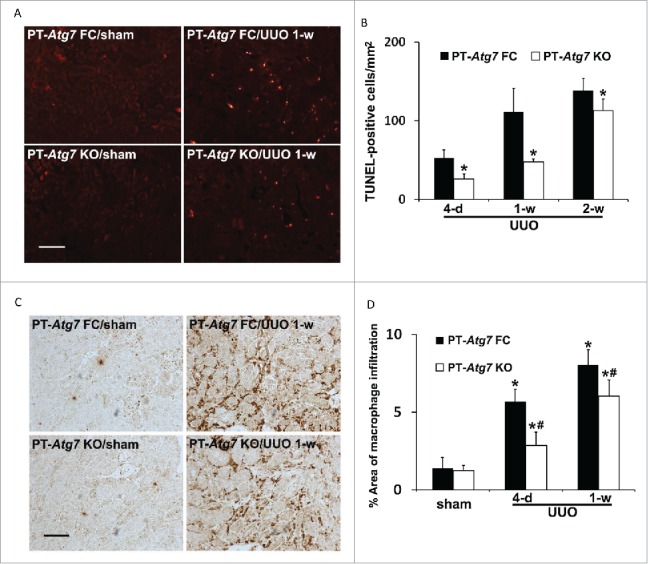
Tubular apoptosis and interstitial inflammation are also attenuated in PT-Atg7 knockout mice during UUO. Animals and their treatment were the same as described in Figure 4. (A) Representative images of TUNEL staining. Scale bar: 50 µm. (B) Quantitative analysis of TUNEL staining. Data are expressed as mean ± SD. *, P < 0.05, significantly different from the relevant PT-Atg7 FC group. (C) Representative images of macrophage staining. Scale bar: 50 µm. (D) Quantitative analysis of macrophage staining. Data are expressed as mean ± SD. *, P < 0.05, significantly different from PT-Atg7 FC sham group; #, P < 0.05, significantly different from the relevant PT-Atg7 FC group.
Coordinated activation of MTORC1 (mechanistic target of rapamycin, complex 1) and autophagy in proximal tubules during UUO
As described above, the production of FGF2 as well as ECM proteins in kidneys during UUO was inhibited by autophagy deficiency in proximal tubular cells (Fig. 5A to D). These interesting findings suggest a connection between tubular cell autophagy and the synthesis of secretory proteins. It is well recognized that protein synthesis and autophagy degradation are regulated by MTOR in an opposite manner. How possibly can the catabolic machinery of autophagy participate in an anabolic process of protein synthesis? A recent study by Narita et al.43 suggests that, in cells undergoing senescence, autophagy induction and MTOR activation occur simultaneously to facilitate the synthesis of secretory proteins. The formation of a distinct cellular compartment, the TOR-autophagy spatial coupling compartment (TASCC), allows the simultaneous activation of catabolic and anabolic machineries in the same cells. Autophagosomes are formed outside the TASCC and then move into the TASCC to fuse with lysosomes that contain MTORC1 to form autolysosomes for degradation. Due to the tight spatial coupling of autophagy and MTORC1, amino acids and other metabolites released from these autolysosomes can rapidly activate MTORC1 and boost protein synthesis.43 To gain initial insight into this possibility in our experimental models, we examined MTORC1 activity by immunoblot analysis of phosphorylation of RPS6KB1 (ribosomal protein S6 kinase, polypeptide 1). As shown in Figure 7A, MTORC1 was activated by UUO in kidney cortical tissues of floxed control mice, as indicated by an increased phosphorylation of RPS6KB1 (lanes 3, 5 and 7 vs lane 1). Notably, activation of MTORC1 was abrogated in PT-Atg7 KO mice with defective autophagy in proximal tubules (p-RPS6KB1, lanes 4, 6 and 8 vs lanes 3, 5 and 7). Densitometric analysis further confirmed that UUO led to an average of 3- to 8-fold increase of RPS6KB1 phosphorylation in floxed control mice, which was significantly reduced in PT-Atg7 KO mice at all 3 time points (Fig. 7B). These results suggest that MTORC1 is activated in proximal tubules concurrently with autophagy induction during UUO and importantly, MTORC1 activation in proximal tubular cells is largely dependent on intact autophagy machinery. With these observations, we speculate that the coordinated activation of MTORC1 and autophagy might be what is happening in the proximal tubules during UUO to assist the production of FGF2 as well as ECM proteins as seen in oncogene-induced senescence.43
Figure 7.
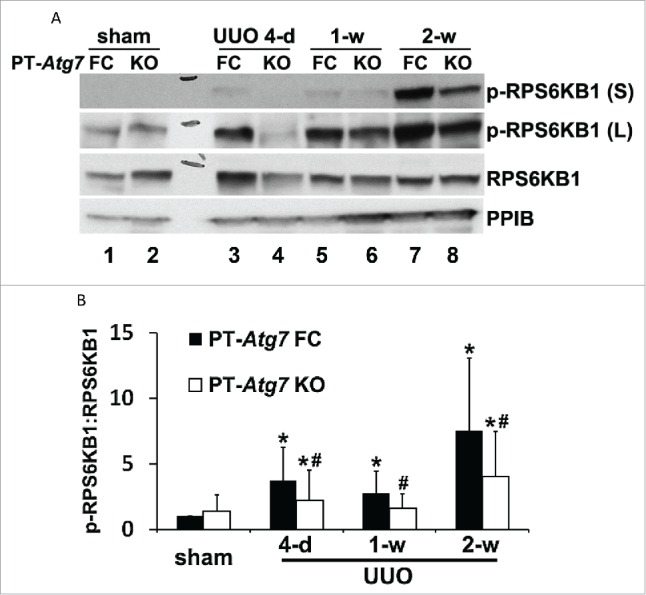
MTOR activation in proximal tubules during UUO is inhibited by autophagy deficiency in PT-Atg7 knockout mice. Animals and their treatment were the same as described in Fig. 4. (A) Representative images of immunoblot analysis of phospho-RPS6KB1 and RPS6KB1. PPIB was used as a loading control. (B) Densitometric analysis of phospho-RPS6KB1 signals. After normalization with RPS6KB1 and PPIB, the protein signal of PT-Atg7 FC sham was arbitrarily set as 1, and the signals of other conditions were normalized with PT-Atg7 FC sham to calculate fold changes. Data are expressed as mean ± SD. *, P < 0.05, significantly different from PT-Atg7 FC sham group; #, P < 0.05, significantly different from the relevant PT-Atg7 FC group.
Autophagy is induced by TGFB1 in BUMPT mouse proximal tubular cell line along with profibrotic changes
TGFB1 is induced in proximal tubules following renal injury and plays a central role in mediating renal interstitial fibrosis.44 In the current study, TGFB1 was activated and increased in mouse kidneys following UUO (Fig. S1). To complement the in vivo study, we first examined autophagy in a cultured mouse proximal tubular cell line (BUMPT) treated with 5 ng/ml TGFB1 for up to 3 d. As shown in Figure 8A, confluent BUMPT cells in control conditions formed cobblestone monolayers typical of epithelium with intact cell junctions. Three d after TGFB1 incubation, the cells changed to a spindle-shaped, fibroblast-like morphology. No obvious apoptosis was observed in BUMPT cells upon TGFB1 treatment. The cells were then transfected with a tandem fluorescent-tagged LC3 (mRFP-GFP-LC3) to monitor autophagy dynamics in the in vitro model. As shown in Fig. 8B, while only a minimal amount of punctate staining was detected under control condition, numerous GFP-LC3 and mRFP-LC3 puncta appeared in TGFB1-treated cells. Colocalization of all GFP signals with mRFP displayed a yellow staining that represented autophagosomes. Once fused with lysosomes, the acid-sensitive GFP fluorescence faded or disappeared, whereas the acid-insensitive RFP signals were maintained. Therefore, the mRFP-LC3 puncta that showed orange-red color in overlapping images were indicative of autolysosomes. Moreover, the presence of chloroquine, a weak base that can neutralize the pH of autolysosomes, inhibited the quenching of GFP fluorescence, thus leading to an increased colocalization of GFP and mRFP signals (Fig. 8B, TGFB1 + CQ). Quantitative analysis in Fig. 8C confirmed that the number of autophagosomes per cell was increased from 6 in control cells to 115 in TGFB1-treated cells. In addition, the control group had an average of 1 autolysosome per cell, which was dramatically increased to 54 after TGFB1 treatment. Furthermore, the rate of autophagic flux was increased from 18% in control to 32% after TGFB1 treatment, which was almost completely blocked by chloroquine (Figure 8D). These results indicate a dynamic activation of autophagy in renal tubular cells by TGFB1, showing induction of both autophagosome formation and maturation to autolysosome. The morphological observations were further confirmed by immunoblot analyses of LC3B and SQSTM1 in BUMPT cells. TGFB1 led to a time-dependent LC3B-II accumulation in the cells, which was accompanied by degradation of SQSTM1 in a similar time-dependent fashion (Fig. 8E and 8F). Along with autophagy induction, FN1 was accumulated in the cells. Consistently, these cultured tubular epithelial cells underwent a phenotypic transition after incubation with TGFB1, characterized by an increased expression of VIM and loss of CDH1, an epithelial cell adhesion molecule (Fig. 8E and 8F).
Figure 8.
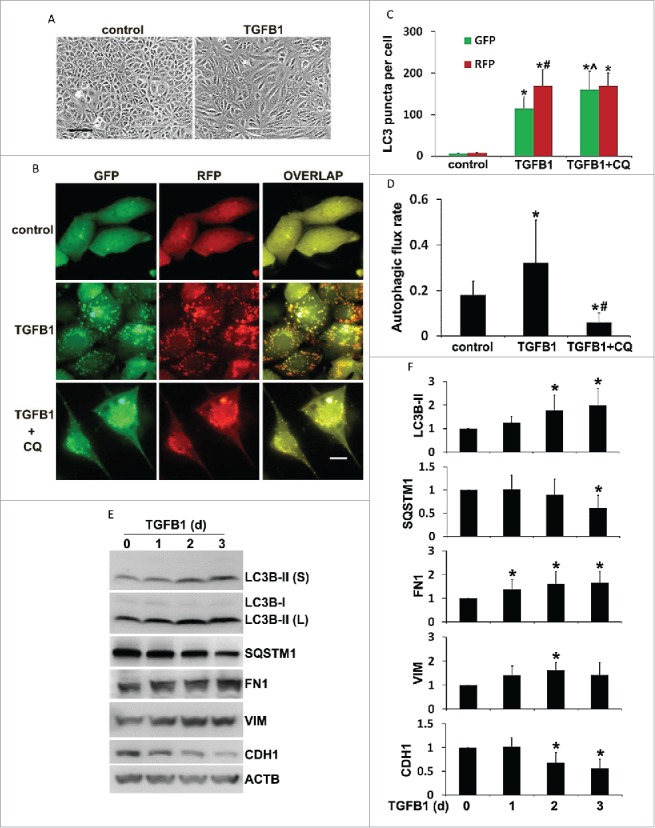
Autophagy is induced by TGFB1 in BUMPT mouse proximal tubular cell line along with profibrotic changes. BUMPT cells were untreated (d 0) or treated with 5 ng/ml TGFB1 for 1 to 3 d. In some experiments BUMPT cells were transiently transfected with mRFP-GFP-LC3 and then untreated (control) or treated with 5 ng/ml TGFB1 in the absence or presence of 20 μM chloroquine (CQ). After treatment the cells were collected for morphological and immunoblot analyses. (A) Representative images of phase contrast showing cell morphology. Scale bar: 50 µm. (B) Representative images of fluorescence microscopy showing GFP-LC3 and mRFP-LC3 puncta in cells. Scale bar: 15 µm. (C) Quantitative analysis of GFP-LC3 and mRFP-LC3 puncta. Data are expressed as mean ± SD. *, P < 0.05, significantly different from the relevant control group; ˆ, P < 0.05, significantly different from the TGFB1 group. #, P < 0.05, significantly different from GFP-LC3 puncta counting. (D) Analysis of autophagic flux rate. Data are expressed as mean ± SD. *, P < 0.05, significantly different from the control group; #, P < 0.05, significantly different from the TGFB1 group. (E) Representative images of immunoblot analysis of LC3B, SQSTM1, FN1, VIM, and CDH1. ACTB was used as a loading control. (F) Densitometric analysis of LC3B, SQSTM1, FN1, VIM, and CDH1 signals. After normalization with ACTB, the protein signal of control (day 0) was arbitrarily set as 1, and the signals of other conditions were normalized with control to calculate fold changes. Data are expressed as mean ± SD. *, P < 0.05, significantly different from control group.
Inhibition of autophagy suppresses FN1 accumulation in TGFB1-treated BUMPT cells without affecting phenotypic transition
We next examined the effect of autophagy inhibition on fibrotic changes in vitro. To this end, BUMPT cells were incubated with TGFB1 in the absence or presence of chloroquine. As before, TGFB1 induced LC3B-II accumulation and SQSTM1 degradation. With blockage of autophagic flux by chloroquine, LC3B-II was further increased and the degradation of SQSTM1 was prohibited. Of interest, TGFB1-induced accumulation of FN1 in BUMPT cells was significantly abolished by chloroquine (Fig. 9A). Quantitatively, 2 d of TGFB1 treatment induced a 1.6-fold increase of FN1, which was reduced by chloroquine to 0.6-fold and further down to 0.2-fold by d 3 (Fig. 9B). To verify the chloroquine results, we generated stable Atg7 floxed control and knockout proximal tubular cell lines using primary culture of proximal tubules isolated from Atg7-loxP mice. Morphologically, these cells formed cobblestone monolayers at confluence (Fig. S2A). CDH1 was present on the surface of these cells (Fig. S2A). When seeded subconfluently, the cells showed a culture time-dependent increase of density, contact inhibition, and differentiation and, within 3 or 4 d, there was an induction of CDH1 and MEP1B (meprin 1 β subunit), a protein marker on the brush border of kidney proximal tubules (Fig. S2B). Importantly, compared to floxed control cells, ATG7 was barely detected in the knockout cells that were infected with retroviral Cre (Fig. S2C, lane 1 vs lane 2, lane 3 vs lane 4). Functionally, ATG7-mediated conjugation events were largely inhibited in the knockout cells, as indicated by scanty LC3B-II and ATG12–ATG5. In contrast, SQSTM1 was accumulated, further verifying autophagy defects in these cells (Fig. S2C). We then treated these cells with TGFB1 for up to 3 d and examined the effect of Atg7 ablation on FN1 expression. As shown in Fig. 9C, TGFB1 activated autophagy in floxed control tubular cells, which was completely inhibited in Atg7 KO cells. In floxed control cells, TGFB1 induced a 1.5- to 1.7-fold increase of FN1, which was also attenuated in Atg7 KO tubular cells (Fig. 9D). It is worthy to point out that neither chloroquine nor Atg7 deletion showed effects on TGFB1-induced upregulation of VIM or loss of CDH1 in cultured proximal tubular cell lines (Fig. 9A and 9C, VIM, CDH1). Together, these results suggest that activation of autophagy by TGFB1 may contribute to FN1 production and accumulation from proximal tubular cells in renal fibrosis.
Figure 9.
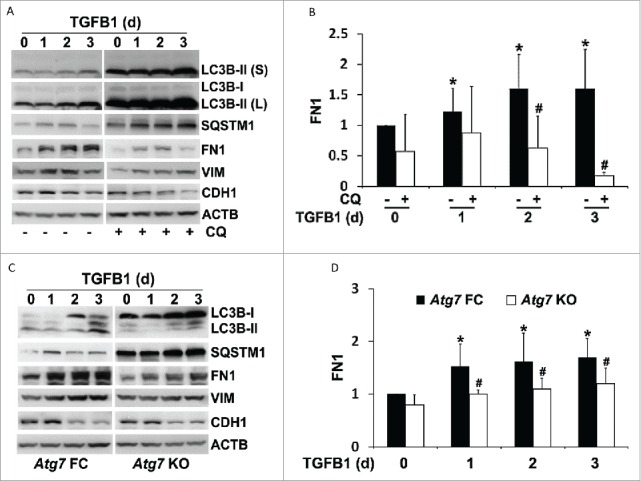
Inhibition of autophagy suppresses FN1 accumulation in TGFB1-treated proximal tubular cells without affecting phenotypic transition. (A) BUMPT cell were untreated (day 0) or treated with 5 ng/ml TGFB1 for 1 to 3 d in the absence (−) or presence (+) of 20 μM chloroquine (CQ). After treatment the cells were collected for immunoblot analysis of LC3B, SQSTM1, FN1, VIM, and CDH1. ACTB was used as a loading control. (B) Densitometric analysis of FN1 signals. After being normalized with ACTB, the protein signal of control (day 0, CQ -) was arbitrarily set as 1, and the signals of other conditions were normalized with control to calculate fold changes. Data are expressed as mean ± SD. *, P < 0.05, significantly different from control (day 0, CQ -) group; #, P < 0.05, significantly different from TGFB1 (CQ -) group. (C) Atg7 floxed control (FC) and KO proximal tubular cells were untreated (day 0) or treated with 5 ng/ml TGFB1 for 1 to 3 d. After treatment the cells were collected for immunoblot analysis of LC3B, SQSTM1, FN1, VIM, and CDH1. ACTB was used as a loading control. (D) Densitometric analysis of FN1 signals. After normalization with ACTB, the protein signal of Atg7 FC control (d 0) was arbitrarily set as 1, and the signals of other conditions were normalized with Atg7 FC control to calculate fold changes. Data are expressed as mean ± SD. *, P < 0.05, significantly different from Atg7 FC control group; #, P < 0.05, significantly different from the relevant Atg7 FC group.
Inhibition of autophagy attenuates cell apoptosis and fibrotic changes in TGFB1-treated primary culture of proximal tubular cells
The results from our in vivo studies suggest a role for autophagy in promoting tubular cell apoptosis during UUO (Figs. 3, 6A and 6B). To further determine the relationship between autophagy, cell apoptosis, and fibrotic changes, we established a primary cell culture model where all 3 events could be induced by TGFB1 simultaneously. We first examined the effects of autophagy inhibitors on tubular cell apoptosis. TGFB1 led to autophagy induction in primary proximal tubular cells, which was suppressed by both chloroquine and 3-methyladenine, as indicated by the changes of LC3B-II and SQSTM1 (Fig. 10A). While only a minimal amount of apoptosis occurred in control cells, TGFB1 induced ˜20% apoptosis after 24 h of treatment. The apoptotic cells showed a shrunken morphology with the formation of apoptotic bodies and nuclear condensation and fragmentation. Importantly, addition of either chloroquine or 3-methyladenine suppressed apoptosis during TGFB1 treatment (Fig. 10B). The morphological findings were confirmed by biochemical analysis of caspase activation. Twenty-four h of TGFB1 incubation increased caspase activity to 2.6 nmol AFC (7-amino-4-trifluoromethyl coumarin)/mg/h, which was reduced to 1.8 by chloroquine and 0.9 by 3-methyladenine, respectively (Fig. 10C). We then isolated primary proximal tubular cells from floxed control and PT-Atg7 KO mice and examined the effects of genetic inhibition of autophagy on tubular cell apoptosis. Again, TGFB1 activated autophagy in floxed control cells, which was largely impaired in Atg7 KO cells (Fig. 10D). Consistent with the pharmacological findings, the autophagy defect due to Atg7 deletion significantly prevented primary tubular cells from TGFB1-induced cell death. Tubular cell apoptosis was reduced from ˜20% in floxed control cells to 5% to 10% in Atg7 KO cells (Fig. 10E). Caspase activity was also decreased from 2.1 in floxed control cells to 1.3 in Atg7 KO cells (Fig. 10F). Together, these in vitro results support our in vivo findings and provide further evidence for the role of autophagy in promoting tubular cell apoptosis in our experimental settings. We next determined TGFB1-induced fibrotic changes in this primary culture model. TGFB1 led to an increased expression of FN1 and VIM, which was partially but significantly abrogated by both chloroquine (Fig. 11A and 11B) and 3-methyladenine (Fig. 11C and 11D). Consistently, compared to floxed control primary cells, upregulation of FN1 and VIM during TGFB1 treatment was suppressed in Atg7 KO primary cells (Fig. 11E and 11F). These results further suggest the involvement of autophagy in regulating TGFB1-induced fibrotic changes.
Figure 10.
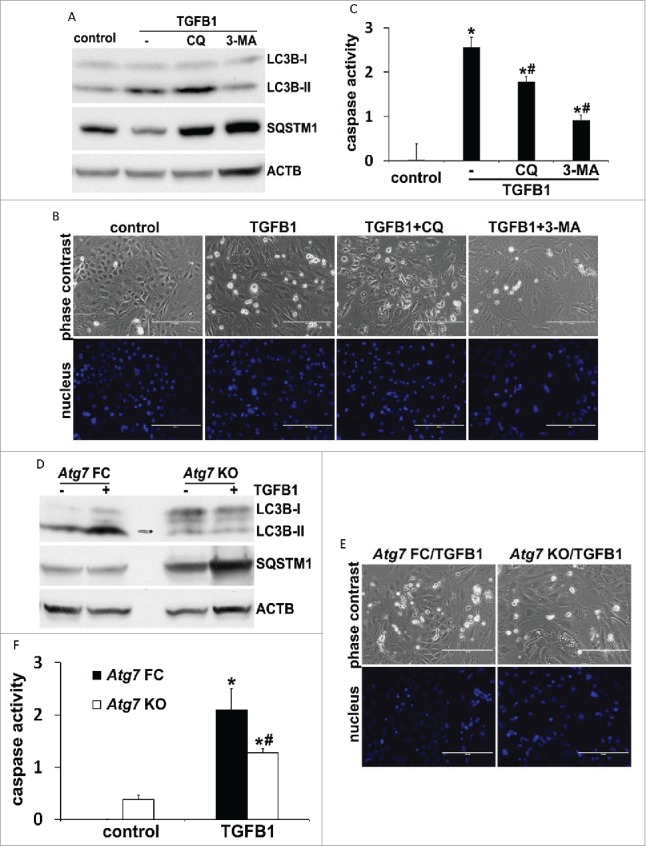
TGFB1-induced apoptosis in primary culture of proximal tubular cells is suppressed by inhibition of autophagy. Primary cells were untreated (control) or treated with 5 ng/ml TGFB1 for 24 h in the absence or presence of 20 μM chloroquine (CQ) or 10 mM 3-methyladenine (3-MA). After treatment the cells were collected for morphological, biochemical and immunoblot analyses. (A, D) Representative images of immunoblot analysis of LC3B and SQSTM1. ACTB was used as a loading control. (B, E) Representative images of phase contrast and fluorescence microscopy showing cellular and nuclear morphology of apoptosis. Scale bar: 200 µm. (C, F) Caspase activity. Data are expressed as mean ± SD. *, P < 0.05, significantly different from control group; #, P < 0.05, significantly different from TGFB1 or Atg7 FC TGFB1 group.
Figure 11.
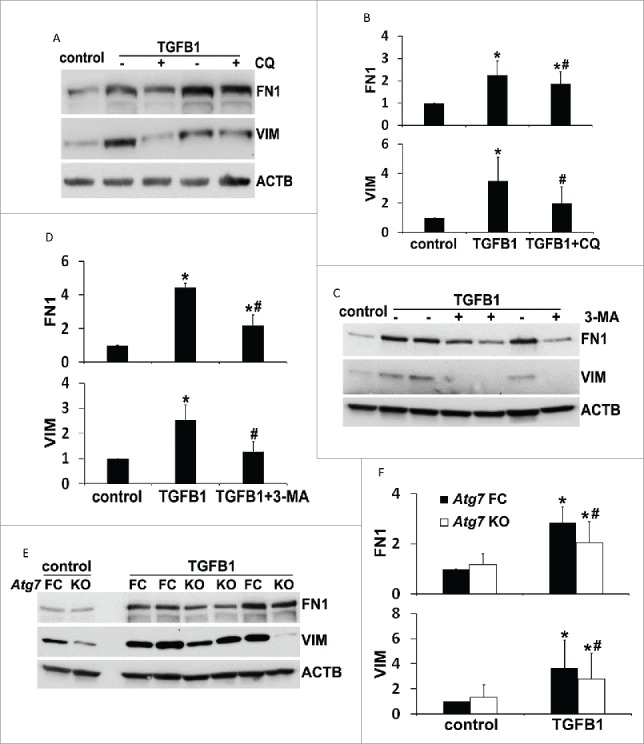
Inhibition of autophagy attenuates fibrotic changes in TGFB1-treated primary proximal tubular cells. Primary cells were treated the same as described in Figure 10. (A, C, E) Representative images of immunoblot analysis of FN1 and VIM. ACTB was used as a loading control. (B, D, F) Densitometric analysis of FN1 and VIM signals. After being normalized with ACTB, the protein signal of control or Atg7 FC control was arbitrarily set as 1, and the signals of other conditions were normalized with controls to calculate fold changes. Data are expressed as mean ± SD. *, P < 0.05, significantly different from control or Atg7 FC control group; #, P < 0.05, significantly different from TGFB1 or Atg7 FC TGFB1 group.
To further determine the relationship between autophagy, cell apoptosis and fibrosis, we examined the effects of Z-VAD (carbobenzoxy-Val-Ala-Asp-fluoromethyl ketone), a pancaspase inhibitor, in TGFB1-treated primary proximal tubular cells. As shown in Fig. 12A, TGFB1 induced cell apoptosis, which was largely inhibited by Z-VAD. Z-VAD did not affect autophagy induction within 24 h of TGFB1 treatment as shown by LC3B-II accumulation and SQSTM1 degradation (Fig. 12B and 12C, LC3B-II and SQSTM1). Notably, Z-VAD did not significantly change the fibrotic responses either. Induction of both FN1 and VIM by TGFB1 remained almost the same in the presence of Z-VAD (Fig. 12B and 12C, FN1 and VIM). These results support a critical role of autophagy, but not apoptosis, in regulating fibrosis in the in vitro experimental model.
Figure 12.
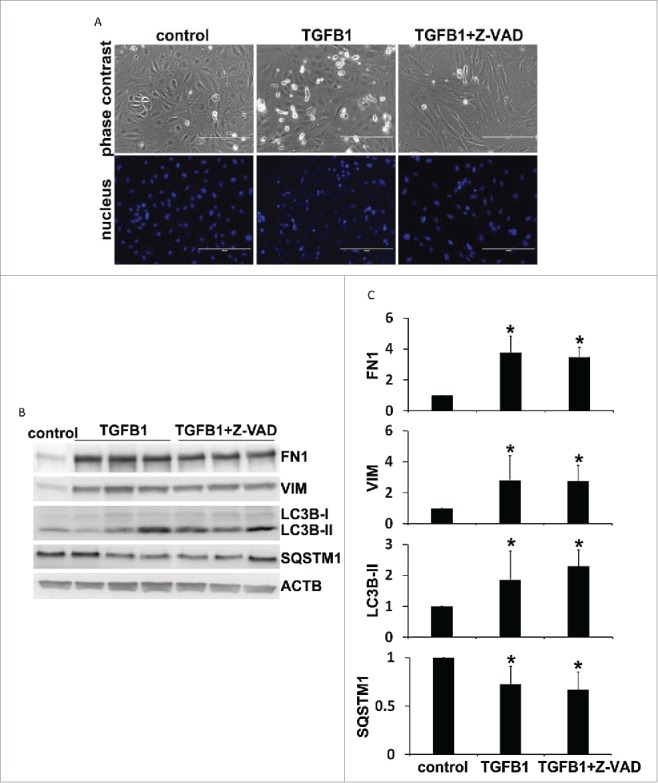
Inhibition of apoptosis by Z-VAD does not affect autophagy induction and fibrotic changes in TGFB1-treated primary proximal tubular cells. Primary cells were untreated (control) or treated with 5 ng/ml TGFB1 for 24 h in the absence or presence of 100 μM Z-VAD. After treatment the cells were collected for morphological and immunoblot analyses. (A) Representative images of phase contrast and fluorescence microscopy showing cellular and nuclear morphology of apoptosis. Scale bar: 200 µm. (B) Representative images of immunoblot analysis of LC3B, SQSTM1, FN1, and VIM. ACTB was used as a loading control. (C) Densitometric analysis of LC3B, SQSTM1, FN1, and VIM signals. After normalization with ACTB, the protein signal of control was arbitrarily set as 1, and the signals of other conditions were normalized with control to calculate fold changes. Data are expressed as mean ± SD. *, P < 0.05, significantly different from control group.
The autophagy-inducing BECN1/Beclin 1 peptide does not impose additive profibrotic effects during UUO but it sensitizes primary proximal tubular cells to TGFB1-induced cell death
In addition to autophagy inhibition, we further determined the effects of a recently identified autophagy-inducing BECN1 peptide on kidney fibrosis during UUO. The BECN1 peptide, called Tat-BECN1, consists of human immunodeficiency virus-1 Tat protein transduction domain (11 amino acids) at the N terminus, a di-glycine linker to increase flexibility, and at the C terminus, 18 amino acids derived from BECN1 amino acids 267 to 284 in the evolutionarily conserved domain. While the Tat domain makes the peptide cell-permeable, the BECN1 267 to 284 fragment is essential for autophagy induction. The BECN1 peptide has been shown to induce autophagy in multiple tissues and organs, and in various cell lines via interaction with a newly identified negative regulator of autophagy, GLIPR2/GAPR-1 (GL1 pathogenesis-related 2).45 To determine the autophagy-inducing activity of this peptide in our experimental models, C57Bl/6 mice were subjected to UUO for 2 wk in the presence of daily administration of either Tat-BECN1 (T-B) or Tat-Scrambled (T-S). We then examined autophagy by immunoblot analyses of LC3B and SQSTM1. Compared to mice treated with UUO + T-S, there were significantly more LC3B-II accumulation and SQSTM1 degradation in mice subjected to UUO + T-B, suggesting an additional autophagy activation by the BECN1 peptide in obstructed kidneys (Fig. S3A and S3B). Nevertheless, UUO-induced kidney fibrosis was not affected under this condition. Morphological measurement by Masson trichrome staining showed similar extent of collagen deposition between T-S and T-B groups at both 1 wk and 2 wk of obstruction (Fig. S3C and S3D). Furthermore, expressions of several fibrotic markers during UUO, including ACTA2, VIM, FN1, COL1A1 (collagen, type I, α 1), COL4A1 (collagen, type IV, α 1), and FGF2, were not altered when comparing T-B with T-S (Fig. S3E). TUNEL staining of apoptotic cells showed that the BECN1 peptide had a slight yet significant effect on tubular cell apoptosis and increased the number of TUNEL-positive cells from 113 in UUO + T-S group to 145 at one wk of obstruction. However, this apoptosis-promoting effect was transient and not seen by 2 wk (Fig. S3F). Together, these results suggest that additional increase of autophagy by the autophagy-inducing peptide may not accelerate tubular cell apoptosis and kidney fibrosis during UUO. We speculate that these negative results might be attributable to the effects of Tat-BECN1 on various populations of kidney cells. We further examined the effects of Tat-BECN1 in in vitro models. Without TGFB1 treatment (control), incubation with T-B led to an accumulation of LC3B-II and degradation of SQSTM1 in primary proximal tubular cells (Fig. S4A). During TGFB1 incubation, T-B remarkably increased autophagic flux. Without chloroquine, the conversion of LC3B-I to LC3B-II and lysosomal degradation of LC3B-II were extremely rapid in the cells treated with TGFB1 + T-B, resulting in a decreased expression of both (unlipidated and lipidated) types of LC3B as compared to TGFB1 + T-S (Fig. S4B, lanes 3 and 4 vs lanes 1 and 2, lane 8 vs lane 6). By blocking lysosomal turnover, chloroquine prevented LC3B-II degradation and under this condition, more LC3B-II accumulated in the cells treated with TGFB1 + T-B as compared to TGFB1 + T-S (Fig. S4B, lane 7 vs lane 5), suggesting an actually increased autophagy induction by the BECN1 peptide in TGFB1-treated primary proximal tubular cells. We then examined the effect of this Tat-BECN1 on apoptosis. Consistent with the in vivo observations, Tat-BECN1 did not sensitize primary cells to TGFB1-induced apoptosis (Fig. S4C and S4D). Nevertheless, trypan blue exclusion assay showed that the percentage of trypan blue-positive cells was significantly induced by Tat-BECN1, from ˜24% in TGFB1 + T-S group to 35% in TGFB1 + T-B group (Fig. S4E). These results suggest that by activating excessive autophagy, the BECN1 peptide may induce other type(s) of cell death rather than apoptosis in TGFB1-treated primary proximal tubular cells. Indeed, a recent study has identified a unique form of autophagy-dependent cell death, termed autosis, both in vivo and in vitro when high levels of autophagy are induced by the BECN1 peptide.46 Whether or not autosis was induced in our experimental settings is unclear; however, the observations that the BECN1 peptide sensitized primary proximal tubular cells to TGFB1-induced cell death further support a role for tubular autophagy in promoting cell injury under this stress condition.
Discussion
The role of autophagy in renal fibrosis remains largely unclear and the findings from a few recent studies are inconsistent and very controversial.28-32,35 Using pharmacological and genetic inhibitory approaches, our study has determined the regulation of renal interstitial fibrosis by autophagy in the in vivo model of UUO and in vitro model of TGFB1-treated proximal tubular cells. The results show that blockade of autophagy by pharmacological inhibitors (choloroquine and 3-methyladenine) or conditional Atg7 deletion from proximal tubules suppressed renal interstitial fibrosis during UUO. Autophagy suppression also led to the attenuation of UUO-induced tubular cell apoptosis, interstitial macrophage infiltration and production of FGF2. In primary culture of proximal tubular cells, FN1 accumulation and cell death induced by TGFB1 were also dependent on autophagy. Together, these results support a critical role of autophagy in proximal tubular cells in promoting renal interstitial fibrosis. Mechanistically, autophagy may contribute to fibrosis by coordinately activating tubular cell death, interstitial inflammation, and particularly, the production of profibrotic secretory proteins such as FGF2 and FN1.
Induction of autophagy in obstructed tubules has been suggested recently.28-32 The techniques for analyzing autophagy in vivo in those studies mainly include electron microscopy profile of autophagic vesicles, immunohistochemical staining of LC3, GFP-LC3 fluorescent puncta, and conversion of LC3-I to LC3-II. These methods can monitor autophagy at steady-state levels, but they do not reveal the dynamic nature of autophagy. In the current study, in addition to these conventional approaches, we utilized a newly developed autophagy reporter mouse model to monitor the dynamics of autophagy (autophagosome formation vs. maturation) in kidneys during UUO. We found that autophagy was initiated mainly in renal tubules early after 2 d of UUO. At this time point, autophagosome formation was predominant, with a relatively low turnover rate (Fig. 1D and 1E, UUO 2 d [2-d]). Notably, from 4 d (4-d) through 2 wk (2-w) of obstruction, autophagy was significantly and persistently induced, as indicated by constantly increased autophagosome formation and maturation to autolysosomes. More importantly, autophagic flux was also induced and maintained at a high level (Fig. 1D and 1E, UUO 4-d, 1-w and 2-w). These observations demonstrate, unequivocally, the induction and dynamic regulation of autophagy in proximal tubules upon UUO.
Despite the emerging evidence showing autophagy induction during renal interstitial fibrosis, the upstream signaling leading to autophagy activation remains unknown. In this regard, Koesters et al. show that overexpression of TGFB1 in renal tubules induces autophagy and peritubular fibrosis, providing the first direct in vivo evidence linking autophagy to TGFB1 signaling during renal fibrosis.35 Later studies further demonstrate autophagy induction by TGFB1 in primary mouse proximal tubular cells and cultured human renal proximal tubular cells.32,47 Consistently in the current study, autophagy activation by TGFB1 was also shown in both primary culture and cell line of proximal tubular cells (Figs. 8, 10). In primary mouse mesangial cells, recent work has suggested that TGFB1 induction of autophagy involves activation of the TAB1/TAK1 (TGFB-activated kinase 1/MAP3K7 binding protein 1)-MAP2K3/MKK3 (mitogen-activated protein kinase kinase 3)-MAPK11/p38β-MAPK12/p38γ-MAPK13/p38δ-MAPK14/p38α signaling.34 In addition, TGFB1 induces the upregulation of several autophagy-related genes, such as ATG5, ATG7, and BECN1, in cultured human renal proximal tubular cells.47 Under this condition, induction of autophagy is associated with an increased generation of reactive oxygen species and enhanced expression of NADPH (reduced NAD phosphate) oxidases.47 In addition to TGFB1, regulation of autophagy by HIF1A (hypoxia inducible factor 1, α subunit) to activate hepatic stellate cells during liver fibrosis has been suggested recently.48 In the kidney, a role of HIF1A in renal fibrosis has been demonstrated in a mouse model of UUO.49,50 Given the evidence that HIF1A signaling through BNIP3 (BCL2/adenovirus E1B interacting protein 3)-BNIP3L (BCL2/adenovirus E1B interacting protein 3-like) regulates autophagy in MEF cells as well as multiple cancer cell lines,51,52 it would be interesting to investigate the role of HIF1A in autophagy during renal fibrosis.
In a rat model of UUO, Kim et al. show that inhibition of autophagy with 3-methyladenine increases tubular cell apoptosis and interstitial fibrosis, suggesting that autophagy may limit fibrosis by reducing apoptosis.30 This is in sharp contrast with our current observations, which indicate that inhibition of autophagy pharmacologically or genetically decreased tubular cell apoptosis and diminished interstitial fibrosis in the mouse model of UUO (Figs. 3, 6A and 6B). The discrepancy between these 2 studies may be attributable to the differences of the models used. Kim et al.30 have used 30 mg/kg 3-methyladenine daily in rats, which is twice as much as the dosage used in our mouse model. It should be noted that 3-methyladenine is not a specific autophagy inhibitor and can inhibit both class I phosphoinositide 3-kinase and class III phosphatidylinositol 3-kinase, which regulate diverse cell signaling and important cellular processes such as membrane trafficking and activation of MTORC1. When used at a high concentration, 3-methyladenine can target other kinases and affect many other cellular processes including glycogen metabolism, lysosomal acidification, endocytosis, and the mitochondrial permeability transition.53 Given these considerations, it is possible that a higher dosage of 3-methyladenine may afford autophagy-independent adverse effects that can compromise the viability of renal tubular cells. In addition, there is an obvious difference in the duration of autophagy in these 2 studies. While Kim et al.30 show an earlier but transient (within one wk) autophagy induction in proximal tubules of rat during UUO, autophagy induction in our experimental model was persistent and sustained throughout the 2-wk duration of obstruction (Figs. 1, 4). Although it is uncertain whether or not this persistent autophagy can directly cause tubular cell death, recent studies have consistently demonstrated that UUO-induced autophagy in proximal tubules (14 d of duration) may act in concert with apoptosis to induce tubular atrophy and nephron loss that is associated with the progression of interstitial fibrosis.28,29,31 In this study, when autophagy was impaired in PT-Atg7 KO mice, UUO-induced tubular atrophy and nephron loss was significantly reversed (Fig. 5E to G), further suggesting a role for persistent induction of autophagy in tubular degeneration during renal fibrosis. Furthermore, Koesters et al. have demonstrated that autophagy activation by prolonged overexpression of TGFB1 in renal tubules may represent a programmed cell death mechanism that contributes to tubular decomposition or collapse and consequent peritubular fibrosis.35 In a model of renal ischemia-reperfusion injury, Li et al. have recently suggested that persistent autophagy in proximal tubules during the recovery phase may inhibit tubular proliferation and repair.38 Together with these studies, our work suggests that if persistently activated, a primarily prosurvival mechanism of autophagy in proximal tubules may become detrimental and harmful, leading to incomplete tubular repair and the development of renal interstitial fibrosis. This is an important point when considering the roles played by tubular cell autophagy in different renal pathologies. We and others have demonstrated a renoprotective role for autophagy in proximal tubular cells against AKI.19-21 In contrast, our current study suggests that persistent activation of autophagy following UUO may contribute to tubular cell injury and renal interstitial fibrosis. Although it is acknowledged that induction of autophagy in proximal tubular cells can be beneficial or detrimental depending on pathological settings, how autophagy makes the life and death decision in a stressed cell, remains unclear. In response to acute injury, autophagy can be rapidly activated as an adaptive response to generate intracellular nutrients and energy. Induction of autophagy can also clear misfolded proteins and damaged organelles to maintain cellular homeostasis.14,54,55 These functions of autophagy may set a higher threshold against cell death or block the stress signaling that would trigger cell death.56 In contrast, under prolonged stress conditions such as UUO and other chronic kidney diseases, sustained autophagy in proximal tubules may destroy large proportions of cytoplasm or organelles, leading to an irreversible collapse of cell viability and loss of cytoprotection.55 Studies have also shown that sustained hypoxia as well as excessive production of TGFB1 and other cytokines during UUO may stimulate oxidative stress to cause DNA damage and mitochondrial injury, which may direct autophagy from a survival to a death pathway.29,31,35
During renal interstitial fibrosis, the profibrotic cytokines can be produced from multiple sources, such as injured tubular epithelial cells, infiltrated macrophages, and interstitial fibroblasts or myofibroblasts.1 The complex feedback interactions between tubular cells and interstitial cells make the separation of individual sources of cytokine production difficult; however, emerging evidence has suggested that the synthesis and secretion of these cytokines is initiated in persistently injured tubular cells and reinforced by themselves and other interstitial cells including macrophages and fibroblasts or myofibroblasts.3,4 Regulation of FGF2 production by autophagy in proximal tubules during UUO is a very interesting finding in our study. Four well-documented profibrotic cytokines, including TGFB1, CTGF, PDGFB, and FGF2, were examined. Following UUO, the expression of these cytokines was increased (Figs. 5A and 5B, S1). Notably, autophagy deficiency in PT-Atg7 KO mice only significantly reduced the expression of FGF2 and did not show consistent effects on the activation of TGFB1 or the expression of CTGF and PDGFB, suggesting a specific regulation of FGF2 by autophagy in proximal tubules under these pathological conditions (Figs. 5A and 5B, S1). In addition to FGF2, this study also revealed that production of FN1, an ECM protein, was dependent on autophagy in proximal tubular cells both during UUO in vivo and TGFB1 treatment in vitro (Figs. 5A and 5B, 9, 11). Consistent with our findings in tubular cells, autophagy regulation of the production of profibrotic secretory proteins has also been demonstrated in fibroblasts. In a model of prolonged serum starvation of fibroblasts, Bernard et al. show that sustained autophagy activates MTORC2 signaling, leading to enhanced expression and secretion of CTGF and the transformation of fibroblasts to myofibroblasts to favor the development of fibrosis.57 Furthermore, in TGFB1-treated primary human atrial myofibroblasts, autophagy was required for the induction of fibrotic signaling and the synthesis of both COL1A2 and FN1.22 These interesting findings not only suggest a connection between autophagy and the synthesis of secretory proteins under certain stress conditions, but also raise 3 important questions that need to be addressed by further studies: 1. How possibly can the catabolic machinery of autophagy participate in an anabolic process of protein synthesis? 2. What determines the specificity of cytokines regulated by autophagy? 3. What pathway(s) participates in the signaling relay from autophagy induction to cytokine production and secretion? In cells undergoing senescence, the formation of a distinct cellular compartment TASCC allows a spatial coupling of MTOR and autophagy to augment senescence-associated secretory phenotype, leading to massive production of secretory proteins.43 Interestingly in this study, we also found a coordinated activation of MTORC1 and autophagy in obstructed kidneys during UUO. MTORC1 was activated in proximal tubules concurrently with autophagy induction and importantly, MTORC1 activation in proximal tubular cells was largely dependent on intact autophagy machinery (Fig. 7). With these observations, we speculate that the coordinated activation of MTORC1 and autophagy occurs in proximal tubules during UUO to assist the production of FGF2 and FN1. In the present study, we also found that compared to floxed control mice, the expression of 2 myofibroblast markers, ACTA2 and VIM, was reduced in PT-Atg7 KO mice (Fig. 5A and 5B). Taking into account the role of autophagy in regulating tubular production of FGF2, it is suggested that autophagy induced in proximal tubular cells may participate in the activation of renal interstitial fibroblasts via a paracrine mechanism.
In contrast to our current study, Ding et al. have recently suggested an antifibrotic role of autophagy in kidneys by regulating the degradation of mature TGFB1.32 The exact cause of the discrepancy between these 2 studies is unclear, but it is noteworthy that the autophagy-deficient models used by Ding et al. are a global homozygous-recessive gene knockout (lc3b−/−) and a global heterozygous knockout of Becn1 (Becn1+/−),32 whereas our study used a conditional knockout model in which autophagy is specifically ablated from kidney proximal tubules. These results suggest that autophagy may play divergent roles in different cell types in renal fibrosis.
By immunohistochemical staining of macrophages, the current study has suggested a proinflammation role of tubular autophagy during UUO (Fig. 6C and 6D). It is not entirely clear how autophagy in proximal tubular cells promotes renal interstitial inflammation. But it is known that renal tubular injury and immune system have a complex, bidirectional relationship.58 On the one hand, tubular injury can stimulate a robust immune response; on the other hand, inflammation may exacerbate tubular injury and tissue damage. Autophagy plays an important modulatory role in kidney injury and repair.36 In the current study, blockade of autophagy reduced tubular cell death (Figs. 3, 6), suggesting that autophagy may promote inflammation by mediating kidney tissue injury. In addition, autophagy in tubular cells may process antigen from autophagosomes and then present in the context of MHC II to activate T lymphocytes and subsequent effector immune responses.58 It may also facilitate the delivery of cytosolic proinflammatory cytokines to the outside of the cell via autosecretion, i.e., autophagy-based unconventional secretion to stimulate inflammation.59
In summary, using both pharmacological and genetic approaches, we have demonstrated that persistently activated autophagy in proximal tubules promotes renal interstitial fibrosis in UUO. The profibrotic function of autophagy is related to its coordinate regulation on tubular cell death, interstitial inflammation, and particularly, the production of profibrotic secretory proteins. Targeting autophagy may therefore offer a new strategy for reducing renal fibrosis to prevent the progression of related kidney diseases including CKD.
Materials and methods
Cells, antibodies, and reagents
Boston University mouse proximal tubular cell line (BUMPT) was originally from Dr. Wilfred Lieberthal (Boston University School of Medicine). The cells were cultured in DMEM medium with 10% fetal bovine serum (FBS) as described previously.60 The retrovirus packaging cell line (293-Phoenix) was a gift from Drs. Xiongjie Jin and Nahid F. Mivechi (Georgia Regents University). The cells were cultured in DMEM medium with 10% FBS. Primary antibodies were from the following sources: anti-LC3B (NB100–2220), anti-CTGF (NBP2–16025), and anti-COL1A1 (NBP1-30054) were from Novus Biologicals; anti-ATG5 (ab108327), anti-SQSTM1 (ab56416), anti-MEP1B (ab42743), anti-ACTA2 (ab5694), anti-FN1 (ab2413), anti-COL4A1 (ab6586), anti-FGF2 (ab106245), anti-TGFB1 (ab92486), anti-PPIB (ab16045), and anti-macrophage (ab56297) were from Abcam; anti-VIM (3932), anti-ATG7 (2631), anti-RPS6KB1 (2708), and anti-phospho-RPS6KB1 (9234) were from Cell Signaling Technology; anti-ACTB (A5316) and anti-ATG7 (A2856) were from Sigma-Aldrich; anti-CDH1 (BD Biosciences, 610181); anti-PDGFB (Santa Cruz Biotechnology, sc-7878). Secondary antibodies for immunoblot analysis were from Jackson ImmunoResearch Laboratories. The BECN1 peptide (Tat-BECN1, sequence: YGRKKRRQRRRGGTNVFNATFEIWHDGEFGT) and its control peptide (Tat-scrambled, sequence: YGRKKRRQR RRGGVGNDFFINHETTGFATEW) were synthesized by GenScript. The sources of other reagents included: recombinant human TGFB1 (EMD Millipore, GF111); chloroquine (Sigma-Aldrich, C6628) and 3-methyladenine (Sigma-Aldrich, M9281); Z-VAD-FMK (R&D systems, FMK001); lipofectamine 2000 transfection reagent (Life Technologies, 11668); puromycin (Clontech, 631305); polybrene (Santa Cruz Biotechnology, sc-134220).
Generation of stable floxed control and Atg7 KO mouse proximal tubular cell lines by Cre recombination
Primary proximal tubular cells were isolated from 5-wk-old Atg7-loxP mice. Briefly, kidney tissues of cortex and outer medulla were minced and digested with collagenase type IV (Life Technologies, 17104). Proximal tubular cells were then purified by centrifugation at 2,000 g in isolation medium containing 32% Percoll (Amersham, 17-0891-02) and cultured in medium supplemented with 10% FBS and growth factors. After 9 or 10 d of growth, the first passage of primary cells were reseeded and transfected with SV40 large T-antigen for 36 h. The cells were maintained in culture for about a week and then passaged every 3 or 4 d. Following 6 passages, the primary cells were immortalized and single cell colonies were identified and expanded. The cells were further characterized by their morphology and expression of CDH1, an epithelial marker, and MEP1B, a brush border marker. To establish stable floxed control and Atg7 KO cell lines, the immortalized proximal tubular cells were infected with retroviruses expressing Cre-PURO-IRES-GFP (pMSCV-Cre-PIG, Addgene plasmid 50935, deposited by Dr. Pier Pandolfi) or control viruses.61 Briefly, 293-Phoenix cells were transfected with pMSCV-Cre-PIG or a control vector using Lipofectamine 2000; 48 h after transfection, the culture media containing a high titer of viruses were collected and filtered. The proximal tubular cells seeded a night before were then infected with the virus-containing media supplemented with 2 μg/ml polybrene for 48 h. After selection in the presence of 2.5 μg/ml puromycin for 7 to 10 d, the cells were collected and the efficiency of Cre recombination was determined by immunoblot analysis of ATG7, LC3B, ATG5 and SQSTM1. These 2 stable cell lines were grown in DMEM medium supplemented with 10% FBS, insulin (10 μg/ml), transferrin (5 μg/ml), epidermal growth factor (10 ng/ml), and dexamethasone (4 μg/ml).
TGFB1 treatment of renal tubular cell lines
Briefly, cells were plated in 35-mm dishes at a density of 0.3 × 10⁶ cells/dish for BUMPT or 0.4 × 10⁶ cells/dish for floxed control and Atg7 KO mouse proximal tubular cells to reach ∼40% confluence by the next day. The cells were then starved overnight in serum-free DMEM medium supplemented with growth factors as described above. Subconfluent cells were treated with 5 ng/ml TGFB1 in serum-free DMEM medium for indicated time. Control cells were kept in serum-free medium without TGFB1. In some experiments BUMPT cells were also incubated with TGFB1 in the presence of 20 μM chloroquine in serum-free medium. After treatment, cells were monitored morphologically or collected for biochemical analyses.
TGFB1 treatment of primary proximal tubular cells and cell death assays
Isolation of primary proximal tubular cells was performed as described above. After 7 to 9 d of growth, primary cells were seeded in 35-mm dishes at a density of 0.2 × 10⁶ cells/dish and reached approximately 60% to 70% confluence by the next day. Following overnight starvation in serum-free DMEM/F12 medium, subconfluent cells were incubated with 5 ng/ml TGFB1 for 24 h. Control cells were kept in serum-free medium without TGFB1. In experiments that included inhibitors, chloroquine, 3-methyladenine, and Z-VAD were used at the concentrations of 20 μM, 10 mM, and 100 μM, respectively. Both the Tat-BECN1 peptide and its control peptide (Tat-scrambled) were used at 10 μM. After treatment, apoptosis was determined by morphology and caspase activity as described before.21 Morphologically, cells were stained with Hoechst 33342 (Molecular Probes, H1399), and cellular and nuclear morphology was examined by phase contrast and fluorescence microscopy, respectively. Cells with typically apoptotic characterizations were counted to estimate apoptosis percentage. To measure caspase activity, cells were extracted with 1% Triton X-100 and incubated with enzymatic reactions containing 50 μM Ac-DEVD-AFC (N-Acetyl-Asp-Glu-Val-Asp-7-amino-4-trifluoromethyl coumarin, Cayman Chemical, 14459), a fluorogenic peptide substrate of caspases, for 1 h at 37°C. Fluorescence was then measured at excitation 360 nm/emission 530 nm using a TECAN GENios microplate reader (TECAN US Inc., Research Triangle Park, NC ). Based on a standard curve constructed with free AFC, the fluorescence reading was converted into the nanomolar amount of liberated AFC per mg protein to indicate caspase activity. In addition, in the experiments using the Tat-BECN1 peptide, cells were also stained with trypan blue (Bio-Rad Laboratories, 145–0013) and the percentage of trypan blue-positive cells was counted by a TC20™ automated cell counter (Bio-Rad Laboratories, 1450102, Hercules, CA).
Study approval
All animal experiments were conducted in accordance with a protocol approved by the Institutional Animal Care and Use Committee of Charlie Norwood VA Medical Center.
Animals
C57BL/6 mice were originally purchased from Jackson Laboratory. Using Cre-loxP technology, a conditional knockout mouse model with Atg7 specifically deleted from renal proximal tubules (PT-Atg7 KO) was recently generated and characterized in our lab.21 The autophagy reporter mouse model, which is transgenic of a tandem RFP-GFP-LC3 fusion gene under the control of a CAG promoter (CAG-RFP-GFP-LC3 mice), was established recently.38 Mice were housed in a pathogen-free animal facility of Charlie Norwood VA Medical Center under a 12/12-h light/dark pattern with free access to food and water. Male mice were used for the experiments.
Mouse model of UUO
UUO surgery was conducted in male mice 8 to 10 wk old. Both littermates and age-matched nonlittermates were used. Briefly, anesthetized with pentobarbital (50 mg/kg, i.p.), mice were kept on a Homeothermic Blanket Control Unit (Harvard Apparatus, 507220F, Holliston, MA) with a rectal probe to monitor and maintain body temperature at ˜36.5°C. The left ureter was exposed and isolated following left flank incision. The mid-ureter was obstructed by 2 point ligations with 4–0 silk sutures. Control mice underwent sham operation without obstruction of the left ureter. To test the effects of 2 pharmacological autophagy inhibitors, C57BL/6 mice were treated with either chloroquine (60 mg/kg, i.p.) or 3-methyladenine (30 mg/kg, i.p.) one h before UUO surgery and continuously subjected to chloroquine daily or 3-methyladenine every other day throughout UUO duration. To determine the effects of the BECN1 peptide, C57BL/6 mice were given Tat-BECN1 or Tat-scrambled (20 mg/kg, i.p.) 4 h before surgery and then daily injection after surgery. Mice were sacrificed at different time points (4 d, 1 wk and 2 wk) after UUO for histological and biochemical analyses.
Analysis of autophagy in cells and in kidneys
Three methods were used to examine autophagy in vitro and in vivo:
Autophagosome formation and maturation to autolysosome, termed autophagic flux, was analyzed in cultured proximal tubular cells expressing mRFP-GFP-LC3 or in CAG-RFP-GFP-LC3 transgenic mice. For in vitro experiments, the cells were transiently transfected with mRFP-GFP-LC3 (ptfLC3, Addgene plasmid 21074, deposited by Dr. Tamotsu Yoshimori).39 After TGFB1 treatment, the cells were fixed with 4% paraformaldehyde in phosphate-buffered saline (PBS, composition in g/L: 8.0 NaCl, 0.2 KCl, 1.44 Na2HPO4, and 0.24 KH2PO4, pH 7.4) for 15 min and mounted with ProLong Diamond antifade reagent (Molecular Probes, P36962). Approximately 100 fluorescence-labeled cells from 10 to 20 random fields (×630 magnification) were analyzed in each condition by Zeiss LSM 780 upright confocal microscope (Carl Zeiss USA, Thornwood, NY. In mRFP-GFP-LC3 transfected cells autophagosomes have both RFP and GFP signals, whereas autolysosomes emit only RFP signals due to quenching of the GFP fluorescence in the acidic lysosomal environment. The numbers of GFP-LC3 puncta per cell and RFP-LC3 puncta per cell were separately counted using ImageJ (National Institute of Health). The number of autophagosomes was indicated by GFP dots and the number of autolysosomes was obtained by subtracting GFP dots from RFP dots. The number of autolysosomes was further divided by the total number of RFP dots to indicate the autophagic flux rate. In vivo following UUO surgery, CAG-RFP-GFP-LC3 mice were perfused with 4% paraformaldehyde in PBS. Kidneys were further fixed in the same fixative overnight, balanced with 30% sucrose (Fisher Scientific, S5–500) in PBS, and embedded in OCT (Sakura Finetek USA, 4583) compound for cryo-section. Tissue cryo-sections of 5 μm were washed briefly in PBS and mounted with ProLong Diamond antifade reagent. For each section, 8 to 10 random fields (×630 magnification) were selected and quantitative analysis was performed by the method described above in cultured cells.
Autophagy in tubular cell cultures and in kidney tissues was also examined by immunoblot analysis of LC3B and SQSTM1 as described previously.19-21 In addition, autophagic flux was determined by LC3B-II turnover assay in which the amount of LC3B-II was compared in the presence versus absence of 20 μM chloroquine.
A polymer-based immunohistochemical staining of LC3B was used to determine autophagy induction in kidney tissues. Briefly, mice were fixed by cardiac perfusion with 4% paraformaldehyde in PBS immediately after anesthesia. Kidneys were harvested and further fixed in the same fixative overnight at 4°C, followed by balanced with 30% sucrose in PBS at 4°C and routinely embedded in paraffin. Tissue sections of 4 μm were deparaffinized and incubated with 1 mM EDTA, 0.05% Tween 20 (Fisher Scientific, BP337–500), pH 8.0 at 95 to 100°C for antigen retrieval. After subsequently being incubated with 3% H2O2 in PBS to block endogenous peroxidase activity and with a blocking buffer containing 2% bovine serum albumin (Sigma-Aldrich, A9647), 0.2% milk, 2% normal goat serum (Jackson ImmunoResearch Laboratories, 005-000-121) and 0.8% Triton X-100 (Sigma-Aldrich, T9284) to reduce nonspecific binding, the slides were exposed to 1:500 to 1000 anti-LC3B at 4°C overnight. Negative controls were done by replacing the primary antibody with antibody diluent. After washing, the slides were incubated with Dako EnVision+ System horse radish peroxidase labeled polymer goat anti-rabbit secondary antibody (Dako North America, K4002) for 30 min at room temperature. Signals of the antigen-antibody complexes were visualized with a DAB Kit (Vector Laboratories, SK-4100) following the manufacturer's instruction. The slides were then counterstained with hematoxylin and routinely mounted. For quantification, 10 to 20 (×400 magnification) fields were randomly selected from each slide and the amount of LC3B dots per proximal tubule was evaluated using ImageJ.
Immunoblot analysis
Whole cell or tissue lysates were extracted in 2% SDS buffer (62.5 mM Tris-HCl, pH 6.8, 2% SDS, 10% glycerol) with protease inhibitor cocktail (Sigma-Aldrich, P8340) and Benzonase nuclease (EMD Millipore, 70746). Protein concentration was determined with a Pierce BCA protein assay kit (Thermo Scientific, 23225). Equal amounts of protein were loaded in each lane and separated by SDS-polyacrylamide gel electrophoresis under reducing conditions. After transferred onto polyvinylidene difluoride membranes, the blots were subsequently incubated with blocking buffer, primary antibodies and secondary antibodies. Antigens on the blots were revealed with an enhanced chemiluminescence kit (Thermo Scientific, 34080).
Histological analysis
Kidney tissues were fixed with 4% paraformaldehyde in PBS, embedded in paraffin, and sectioned at 4 μm. Masson trichrome staining was performed according to a standard procedure provided by the manufacturer (Sigma-Aldrich, HT15). COL1, COL3 and COL4/type I, III, and IV collagen fibrils were stained with aniline blue. To quantitatively estimate fibrotic area, 10 to 20 positive collage-stained fields (×200 magnification) were randomly selected from each section and analyzed by ImageJ. A ratio of blue stained area to the area of entire field (glomeruli, tubule lumina, and blood vessels, if any, excluded) was assessed and expressed as percentage of fibrotic area. Apoptotic cells in kidney tissue were identified by TUNEL assay using an in situ cell death detection kit (Roche Applied Science, 12156792910) as described previously.20,21 Briefly, tissue sections were deparaffinized and permeabilized with 0.1 M sodium citrate, pH 6.0 at 65°C for 30 min. The sections were then incubated with a TUNEL reaction mixture for 1 h at 37°C in a humidified/dark chamber. Positive nuclear staining was detected by fluorescence microscopy (Zeiss Axio Imager.A2, Carl Zeiss USA, Thornwood, NY). For quantification, 10 to 20 fields (×200 magnification) were randomly selected from each tissue section and the amount of TUNEL-positive cells per 100 mm2 was evaluated. Immunohistochemical staining for macrophage was performed using a protocol described previously.21 Briefly, after antigen retrieval in 0.1 M sodium citrate, pH 6.0 at 95 to 100°C for 1 h, deparaffinized sections were sequentially incubated with 3% H2O2, blocking buffer (2% bovine serum albumin, 0.2% milk, 2% normal goat serum and 0.8% Triton X-100), and avidin-biotin blocking reagent (Vector Laboratories, SP-2001). The slides were then exposed to 1:100 anti-macrophage [RM0029-11H3] at 4°C overnight and 1:500 biotinylated goat anti-rat secondary antibody (Millipore, AP183B) for 1 h at room temperature. Negative controls were done by replacing the primary antibody with antibody diluent. Following signal amplification with Tyramide Signal Amplification Biotin System (Perkin Elmer, NEL700A001KT), the sections were incubated with a VECTASTAIN® ABC kit (Vector Laboratories, PK-6100) and color was developed with a DAB kit. 10 to 20 fields (×200 magnification) were randomly selected from each section and the percentage of macrophage-positive stained area was quantitated using ImageJ. PAS staining was performed based on a standard procedure from Sigma-Aldrich (395) and glycogen-containing components such as brush borders and basement membranes were stained red-purple. Proximal tubules were also stained with fluorescein-labeled LTL (Vector Laboratories, FL-1321). For quantitative analysis, around 10 fields (×200 magnification) were randomly selected from each section and the percentage of LTL-positive stained area was measured with ImageJ.
Statistics
Qualitative data including immunoblots and cell images are representatives of at least 3 experiments. Quantitative Data were expressed as means ± SD (standard deviation). Statistical analysis was conducted using the GraphPad Prism software. Statistical differences in multiple groups were determined by multiple comparisons with ANOVA followed by Tukey post hoc tests. Statistical differences between 2 groups were determined by the 2-tailed unpaired or paired Student t test. P < 0.05 was considered significantly different.
Supplementary Material
Abbreviations
- ACTA2
actin, α 2, smooth muscle, aorta
- ACTB
actin, β
- AFC
7-amino-4-trifluoromethyl coumarin
- AKI
acute kidney injury
- ATG/Atg
autophagy-related
- BECN1
Beclin 1, autophagy related
- BUMPT
Boston University mouse proximal tubular cell line
- CDH1
cadherin 1
- CKD
chronic kidney disease
- COL1A1
collagen, type I, α 1
- COL4A1
collagen, type IV, α 1
- CTGF
connective tissue growth factor
- DAPI
4′,6-diamidino-2-phenylindole
- ECM
extracellular matrix
- FBS
fetal bovine serum
- FC
floxed control
- FGF2
fibroblast growth factor 2
- FN1
fibronectin 1
- GFP
green fluorescent protein
- HIF1A
hypoxia inducible factor 1, α subunit
- KO
knockout
- LTL
lotus tetragonolobus lectin
- MAP1LC3B/LC3B
microtubule-associated protein 1 light chain 3 isoform B
- MAPK
mitogen-activated protein kinase
- MEP1B
meprin 1, β subunit
- mRFP
monomeric red fluorescent protein
- MTORC1
mechanistic target of rapamycin (serine/threonine kinase) complex 1
- PAS
periodic acid-Schiff
- PBS
phosphate-buffered saline
- PDGFB
platelet derived growth factor subunit B
- PPIB/cyclophilin B
peptidylprolyl isomerase B
- RPS6KB1
ribosomal protein S6 kinase, polypeptide 1
- SD
standard deviation
- SQSTM1/p62
sequestosome 1
- TASCC
TOR-autophagy spatial coupling compartment
- TGFB1
transforming growth factor, β 1
- TUNEL
terminal deoxynucleotidyl transferase-mediated dUTP nick end labeling
- UUO
unilateral ureteral obstruction
- VIM
vimentin
- Z-VAD-FMK/Z-VAD
carbobenzoxy-Val-Ala-Asp-fluoromethyl ketone
Disclosure of potential conflicts of interest
No potential conflicts of interest were disclosed.
Acknowledgments
We thank Dr. Masaaki Komatsu at Tokyo Metropolitan Institute of Medical Science (Tokyo, Japan) for providing Atg7-floxed mice for establishing the PT-Atg7-KO mouse model.
Funding
This study was supported by grants from National Natural Science Foundation of China (81430017), National Basic Research Program of China 973 Program No. 2012CB517600 (No. 2012CB517601), the National Institutes of Health and Department of Veterans Administration of USA.
References
- [1].Liu Y. Cellular and molecular mechanisms of renal fibrosis. Nat Rev 2011; 7:684-96; PMID:22009250 [DOI] [PMC free article] [PubMed] [Google Scholar]
- [2].Yang L, Humphreys BD, Bonventre JV. Pathophysiology of acute kidney injury to chronic kidney disease: maladaptive repair. Contrib Nephrol 2011; 174:149-55; PMID:21921619; http://dx.doi.org/ 10.1159/000329385 [DOI] [PubMed] [Google Scholar]
- [3].Venkatachalam MA, Griffin KA, Lan R, Geng H, Saikumar P, Bidani AK. Acute kidney injury: a springboard for progression in chronic kidney disease. Am J Physiol Renal Physiol 2010; 298:F1078-94; PMID:20200097; http://dx.doi.org/ 10.1152/ajprenal.00017.2010 [DOI] [PMC free article] [PubMed] [Google Scholar]
- [4].Venkatachalam MA, Weinberg JM, Kriz W, Bidani AK. Failed Tubule Recovery, AKI-CKD Transition, and Kidney Disease Progression. J Am Soc Nephrol 2015; 26:1765-76; PMID:25810494; http://dx.doi.org/ 10.1681/ASN.2015010006 [DOI] [PMC free article] [PubMed] [Google Scholar]
- [5].Fujigaki Y, Muranaka Y, Sun D, Goto T, Zhou H, Sakakima M, Fukasawa H, Yonemura K, Yamamoto T, Hishida A. Transient myofibroblast differentiation of interstitial fibroblastic cells relevant to tubular dilatation in uranyl acetate-induced acute renal failure in rats. Virchows Arch 2005; 446:164-76; PMID:15609048; http://dx.doi.org/ 10.1007/s00428-004-1155-5 [DOI] [PubMed] [Google Scholar]
- [6].Kimura M, Asano M, Abe K, Miyazaki M, Suzuki T, Hishida A. Role of atrophic changes in proximal tubular cells in the peritubular deposition of type IV collagen in a rat renal ablation model. Nephrol Dial transplant 2005; 20:1559-65; PMID:15870225; http://dx.doi.org/ 10.1093/ndt/gfh872 [DOI] [PubMed] [Google Scholar]
- [7].Geng H, Lan R, Singha PK, Gilchrist A, Weinreb PH, Violette SM, Weinberg JM, Saikumar P, Venkatachalam MA. Lysophosphatidic acid increases proximal tubule cell secretion of profibrotic cytokines PDGF-B and CTGF through LPA2- and Galphaq-mediated Rho and alphavbeta6 integrin-dependent activation of TGF-beta. Am J Pathol 2012; 181:1236-49; PMID:22885106; http://dx.doi.org/ 10.1016/j.ajpath.2012.06.035 [DOI] [PMC free article] [PubMed] [Google Scholar]
- [8].Geng H, Lan R, Wang G, Siddiqi AR, Naski MC, Brooks AI, Barnes JL, Saikumar P, Weinberg JM, Venkatachalam MA. Inhibition of autoregulated TGFbeta signaling simultaneously enhances proliferation and differentiation of kidney epithelium and promotes repair following renal ischemia. Am J Pathol 2009; 174:1291-308; PMID:19342372; http://dx.doi.org/ 10.2353/ajpath.2009.080295 [DOI] [PMC free article] [PubMed] [Google Scholar]
- [9].Lan R, Geng H, Polichnowski AJ, Singha PK, Saikumar P, McEwen DG, Griffin KA, Koesters R, Weinberg JM, Bidani AK, et al.. PTEN loss defines a TGF-beta-induced tubule phenotype of failed differentiation and JNK signaling during renal fibrosis. Am J Physiol Renal Physiol 2012; 302:F1210-23; PMID:22301622; http://dx.doi.org/ 10.1152/ajprenal.00660.2011 [DOI] [PMC free article] [PubMed] [Google Scholar]
- [10].Yang L, Besschetnova TY, Brooks CR, Shah JV, Bonventre JV. Epithelial cell cycle arrest in G2/M mediates kidney fibrosis after injury. Nat Med 2010; 16:535-43, 1p following 143; PMID:20436483; http://dx.doi.org/ 10.1038/nm.2144 [DOI] [PMC free article] [PubMed] [Google Scholar]
- [11].Bechtel W, McGoohan S, Zeisberg EM, Muller GA, Kalbacher H, Salant DJ, Müller CA, Kalluri R, Zeisberg M. Methylation determines fibroblast activation and fibrogenesis in the kidney. Nat Med 2010; 16:544-50; PMID:20418885; http://dx.doi.org/ 10.1038/nm.2135 [DOI] [PMC free article] [PubMed] [Google Scholar]
- [12].Grgic I, Campanholle G, Bijol V, Wang C, Sabbisetti VS, Ichimura T, Humphreys BD, Bonventre JV. Targeted proximal tubule injury triggers interstitial fibrosis and glomerulosclerosis. Kidney Int 2012; 82:172-83; PMID:22437410; http://dx.doi.org/ 10.1038/ki.2012.20 [DOI] [PMC free article] [PubMed] [Google Scholar]
- [13].Yang Z, Klionsky DJ. Eaten alive: a history of macroautophagy. Nat Cell Biol 2010; 12:814-22; PMID:20811353; http://dx.doi.org/ 10.1038/ncb0910-814 [DOI] [PMC free article] [PubMed] [Google Scholar]
- [14].Levine B, Kroemer G. Autophagy in the pathogenesis of disease. Cell 2008; 132:27-42; PMID:18191218; http://dx.doi.org/ 10.1016/j.cell.2007.12.018 [DOI] [PMC free article] [PubMed] [Google Scholar]
- [15].Mizushima N, Komatsu M. Autophagy: renovation of cells and tissues. Cell 2011; 147:728-41; PMID:22078875; http://dx.doi.org/ 10.1016/j.cell.2011.10.026 [DOI] [PubMed] [Google Scholar]
- [16].Choi AM, Ryter SW, Levine B. Autophagy in human health and disease. N Engl J Med 2013; 368:651-62; PMID:23406030; http://dx.doi.org/ 10.1056/NEJMra1205406 [DOI] [PubMed] [Google Scholar]
- [17].Huber TB, Edelstein CL, Hartleben B, Inoki K, Jiang M, Koya D, Kume S, Lieberthal W, Pallet N, Quiroga A, et al.. Emerging role of autophagy in kidney function, diseases and aging. Autophagy 2012; 8:1009-31; PMID:22692002; http://dx.doi.org/ 10.4161/auto.19821 [DOI] [PMC free article] [PubMed] [Google Scholar]
- [18].Livingston MJ, Dong Z. Autophagy in Acute Kidney Injury. Semin Nephrol 2014; 34:17-26; PMID:24485026; http://dx.doi.org/ 10.1016/j.semnephrol.2013.11.004 [DOI] [PMC free article] [PubMed] [Google Scholar]
- [19].Periyasamy-Thandavan S, Jiang M, Wei Q, Smith R, Yin XM, Dong Z. Autophagy is cytoprotective during cisplatin injury of renal proximal tubular cells. Kidney Int 2008; 74:631-40; PMID:18509315; http://dx.doi.org/ 10.1038/ki.2008.214 [DOI] [PubMed] [Google Scholar]
- [20].Jiang M, Liu K, Luo J, Dong Z. Autophagy is a renoprotective mechanism during in vitro hypoxia and in vivo ischemia-reperfusion injury. Am J Pathol 2010; 176:1181-92; PMID:20075199; http://dx.doi.org/ 10.2353/ajpath.2010.090594 [DOI] [PMC free article] [PubMed] [Google Scholar]
- [21].Jiang M, Wei Q, Dong G, Komatsu M, Su Y, Dong Z. Autophagy in proximal tubules protects against acute kidney injury. Kidney Int 2012; 82:1271-83; PMID:22854643; http://dx.doi.org/ 10.1038/ki.2012.261 [DOI] [PMC free article] [PubMed] [Google Scholar]
- [22].Ghavami S, Cunnington RH, Gupta S, Yeganeh B, Filomeno KL, Freed DH, Chen S, Klonisch T, Halayko AJ, Ambrose E, et al.. Autophagy is a regulator of TGF-beta1-induced fibrogenesis in primary human atrial myofibroblasts. Cell Death Dis 2015; 6:e1696; PMID:25789971 [DOI] [PMC free article] [PubMed] [Google Scholar]
- [23].Mallat A, Lodder J, Teixeira-Clerc F, Moreau R, Codogno P, Lotersztajn S. Autophagy: a multifaceted partner in liver fibrosis. BioMed Res Int 2014; 2014:869390; PMID:25254217; http://dx.doi.org/ 10.1155/2014/869390 [DOI] [PMC free article] [PubMed] [Google Scholar]
- [24].Araya J, Kojima J, Takasaka N, Ito S, Fujii S, Hara H, Yanagisawa H, Kobayashi K, Tsurushige C, Kawaishi M, et al.. Insufficient autophagy in idiopathic pulmonary fibrosis. Am J Physiol Lung Cell Mol Physiol 2013; 304:L56-69; PMID:23087019; http://dx.doi.org/ 10.1152/ajplung.00213.2012 [DOI] [PubMed] [Google Scholar]
- [25].Del Principe D, Lista P, Malorni W, Giammarioli AM. Fibroblast autophagy in fibrotic disorders. J Pathol 2013; 229:208-20; PMID:23018629; http://dx.doi.org/ 10.1002/path.4115 [DOI] [PubMed] [Google Scholar]
- [26].Hernandez-Gea V, Ghiassi-Nejad Z, Rozenfeld R, Gordon R, Fiel MI, Yue Z, Czaja MJ, Friedman SL. Autophagy releases lipid that promotes fibrogenesis by activated hepatic stellate cells in mice and in human tissues. Gastroenterology 2012; 142:938-46; PMID:22240484; http://dx.doi.org/ 10.1053/j.gastro.2011.12.044 [DOI] [PMC free article] [PubMed] [Google Scholar]
- [27].Thoen LF, Guimaraes EL, Dolle L, Mannaerts I, Najimi M, Sokal E, van Grunsven LA. A role for autophagy during hepatic stellate cell activation. J Hepatol 2011; 55:1353-60; PMID:21803012; http://dx.doi.org/ 10.1016/j.jhep.2011.07.010 [DOI] [PubMed] [Google Scholar]
- [28].Li L, Zepeda-Orozco D, Black R, Lin F. Autophagy is a component of epithelial cell fate in obstructive uropathy. Am J Pathol 2010; 176:1767-78; PMID:20150430; http://dx.doi.org/ 10.2353/ajpath.2010.090345 [DOI] [PMC free article] [PubMed] [Google Scholar]
- [29].Forbes MS, Thornhill BA, Chevalier RL. Proximal tubular injury and rapid formation of atubular glomeruli in mice with unilateral ureteral obstruction: a new look at an old model. Am J Physiol Renal Physiol 2011; 301:F110-7; PMID:21429968; http://dx.doi.org/ 10.1152/ajprenal.00022.2011 [DOI] [PMC free article] [PubMed] [Google Scholar]
- [30].Kim WY, Nam SA, Song HC, Ko JS, Park SH, Kim HL, Choi EJ, Kim YS, Kim J, Kim YK. The role of autophagy in unilateral ureteral obstruction rat model. Nephrology (Carlton, Vic) 2012; 17:148-59; PMID:22085202 [DOI] [PubMed] [Google Scholar]
- [31].Xu Y, Ruan S, Wu X, Chen H, Zheng K, Fu B. Autophagy and apoptosis in tubular cells following unilateral ureteral obstruction are associated with mitochondrial oxidative stress. Int J Mol Med 2013; 31:628-36; PMID:23314838 [DOI] [PubMed] [Google Scholar]
- [32].Ding Y, Kim SL, Lee SY, Koo JK, Wang Z, Choi ME. Autophagy regulates TGF-beta expression and suppresses kidney fibrosis induced by unilateral ureteral obstruction. J Am Soc Nephrol 2014; 25:2835-46; PMID:24854279; http://dx.doi.org/ 10.1681/ASN.2013101068 [DOI] [PMC free article] [PubMed] [Google Scholar]
- [33].Ding Y, Kim JK, Kim SI, Na HJ, Jun SY, Lee SJ, Choi ME. TGF-{beta}1 protects against mesangial cell apoptosis via induction of autophagy. J Biol Chem 2010; 285:37909-19; PMID:20876581; http://dx.doi.org/ 10.1074/jbc.M109.093724 [DOI] [PMC free article] [PubMed] [Google Scholar]
- [34].Kim SI, Na HJ, Ding Y, Wang Z, Lee SJ, Choi ME. Autophagy promotes intracellular degradation of type I collagen induced by transforming growth factor (TGF)-beta1. J Biol Chem 2012; 287:11677-88; PMID:22351764; http://dx.doi.org/ 10.1074/jbc.M111.308460 [DOI] [PMC free article] [PubMed] [Google Scholar]
- [35].Koesters R, Kaissling B, Lehir M, Picard N, Theilig F, Gebhardt R, Glick AB, Hähnel B, Hosser H, Gröne HJ, et al.. Tubular overexpression of transforming growth factor-beta1 induces autophagy and fibrosis but not mesenchymal transition of renal epithelial cells. Am J Pathol 2010; 177:632-43; PMID:20616344; http://dx.doi.org/ 10.2353/ajpath.2010.091012 [DOI] [PMC free article] [PubMed] [Google Scholar]
- [36].He L, Livingston MJ, Dong Z. Autophagy in acute kidney injury and repair. Nephron Clin Pract 2014; 127:56-60; PMID:25343822; http://dx.doi.org/ 10.1159/000363677 [DOI] [PMC free article] [PubMed] [Google Scholar]
- [37].Rosenfeldt MT, Nixon C, Liu E, Mah LY, Ryan KM. Analysis of macroautophagy by immunohistochemistry. Autophagy 2012; 8:963-9; PMID:22562096; http://dx.doi.org/ 10.4161/auto.20186 [DOI] [PMC free article] [PubMed] [Google Scholar]
- [38].Li L, Wang ZV, Hill JA, Lin F. New autophagy reporter mice reveal dynamics of proximal tubular autophagy. J Am Soc Nephrol 2014; 25:305-15; PMID:24179166; http://dx.doi.org/ 10.1681/ASN.2013040374 [DOI] [PMC free article] [PubMed] [Google Scholar]
- [39].Kimura S, Noda T, Yoshimori T. Dissection of the autophagosome maturation process by a novel reporter protein, tandem fluorescent-tagged LC3. Autophagy 2007; 3:452-60; PMID:17534139; http://dx.doi.org/ 10.4161/auto.4451 [DOI] [PubMed] [Google Scholar]
- [40].Chevalier RL, Forbes MS, Thornhill BA. Ureteral obstruction as a model of renal interstitial fibrosis and obstructive nephropathy. Kidney Int 2009; 75:1145-52; PMID:19340094; http://dx.doi.org/ 10.1038/ki.2009.86 [DOI] [PubMed] [Google Scholar]
- [41].Cachat F, Lange-Sperandio B, Chang AY, Kiley SC, Thornhill BA, Forbes MS, Chevalier RL. Ureteral obstruction in neonatal mice elicits segment-specific tubular cell responses leading to nephron loss. Kidney Int 2003; 63:564-75; PMID:12631121; http://dx.doi.org/ 10.1046/j.1523-1755.2003.00775.x [DOI] [PubMed] [Google Scholar]
- [42].Docherty NG, O'Sullivan OE, Healy DA, Fitzpatrick JM, Watson RW. Evidence that inhibition of tubular cell apoptosis protects against renal damage and development of fibrosis following ureteric obstruction. Am J Physiol Renal Physiol 2006; 290:F4-13; PMID:16339963; http://dx.doi.org/ 10.1152/ajprenal.00045.2005 [DOI] [PubMed] [Google Scholar]
- [43].Narita M, Young AR, Arakawa S, Samarajiwa SA, Nakashima T, Yoshida S, Hong S, Berry LS, Reichelt S, Ferreira M, et al.. Spatial coupling of mTOR and autophagy augments secretory phenotypes. Science (New York, NY) 2011; 332:966-70; PMID:21512002; http://dx.doi.org/ 10.1126/science.1205407 [DOI] [PMC free article] [PubMed] [Google Scholar]
- [44].Garcia-Sanchez O, Lopez-Hernandez FJ, Lopez-Novoa JM. An integrative view on the role of TGF-beta in the progressive tubular deletion associated with chronic kidney disease. Kidney Int 2010; 77:950-5; PMID:20336053; http://dx.doi.org/ 10.1038/ki.2010.88 [DOI] [PubMed] [Google Scholar]
- [45].Shoji-Kawata S, Sumpter R, Leveno M, Campbell GR, Zou Z, Kinch L, Wilkins AD, Sun Q, Pallauf K, MacDuff D, et al.. Identification of a candidate therapeutic autophagy-inducing peptide. Nature 2013; 494:201-6; PMID:23364696; http://dx.doi.org/ 10.1038/nature11866 [DOI] [PMC free article] [PubMed] [Google Scholar]
- [46].Liu Y, Shoji-Kawata S, Sumpter RM Jr., Wei Y, Ginet V, Zhang L, Posner B, Tran KA, Green DR, Xavier RJ, et al.. Autosis is a Na+,K+-ATPase-regulated form of cell death triggered by autophagy-inducing peptides, starvation, and hypoxia-ischemia. Proc Natl Acad Sci U S A 2013; 110:20364-71; PMID:24277826; http://dx.doi.org/ 10.1073/pnas.1319661110 [DOI] [PMC free article] [PubMed] [Google Scholar]
- [47].Xu Y, Yang S, Huang J, Ruan S, Zheng Z, Lin J. Tgf-beta1 induces autophagy and promotes apoptosis in renal tubular epithelial cells. Int J Mol Med 2012; 29:781-90; PMID:22322529 [DOI] [PubMed] [Google Scholar]
- [48].Deng J, Huang Q, Wang Y, Shen P, Guan F, Li J, Huang H, Shi C. Hypoxia-inducible factor-1alpha regulates autophagy to activate hepatic stellate cells. Biochem Biophys Res Commun 2014; 454:328-34; PMID:25450397; http://dx.doi.org/ 10.1016/j.bbrc.2014.10.076 [DOI] [PubMed] [Google Scholar]
- [49].Higgins DF, Kimura K, Bernhardt WM, Shrimanker N, Akai Y, Hohenstein B, Saito Y, Johnson RS, Kretzler M, Cohen CD, et al.. Hypoxia promotes fibrogenesis in vivo via HIF-1 stimulation of epithelial-to-mesenchymal transition. J Clin Invest 2007; 117:3810-20; PMID:18037992 [DOI] [PMC free article] [PubMed] [Google Scholar]
- [50].Kimura K, Iwano M, Higgins DF, Yamaguchi Y, Nakatani K, Harada K, Kubo A, Akai Y, Rankin EB, Neilson EG, et al.. Stable expression of HIF-1alpha in tubular epithelial cells promotes interstitial fibrosis. Am J Physiol Renal Physiol 2008; 295:F1023-9; PMID:18667485; http://dx.doi.org/ 10.1152/ajprenal.90209.2008 [DOI] [PMC free article] [PubMed] [Google Scholar]
- [51].Zhang H, Bosch-Marce M, Shimoda LA, Tan YS, Baek JH, Wesley JB, Gonzalez FJ, Semenza GL. Mitochondrial autophagy is an HIF-1-dependent adaptive metabolic response to hypoxia. J Biol Chem 2008; 283:10892-903; PMID:18281291; http://dx.doi.org/ 10.1074/jbc.M800102200 [DOI] [PMC free article] [PubMed] [Google Scholar] [Retracted]
- [52].Bellot G, Garcia-Medina R, Gounon P, Chiche J, Roux D, Pouyssegur J, Mazure NM. Hypoxia-induced autophagy is mediated through hypoxia-inducible factor induction of BNIP3 and BNIP3L via their BH3 domains. Mol Cell Biol 2009; 29:2570-81; PMID:19273585; http://dx.doi.org/ 10.1128/MCB.00166-09 [DOI] [PMC free article] [PubMed] [Google Scholar]
- [53].Mizushima N, Yoshimori T, Levine B. Methods in mammalian autophagy research. Cell 2010; 140:313-26; PMID:20144757; http://dx.doi.org/ 10.1016/j.cell.2010.01.028 [DOI] [PMC free article] [PubMed] [Google Scholar]
- [54].Mizushima N, Levine B, Cuervo AM, Klionsky DJ. Autophagy fights disease through cellular self-digestion. Nature 2008; 451:1069-75; PMID:18305538; http://dx.doi.org/ 10.1038/nature06639 [DOI] [PMC free article] [PubMed] [Google Scholar]
- [55].Maiuri MC, Zalckvar E, Kimchi A, Kroemer G. Self-eating and self-killing: crosstalk between autophagy and apoptosis. Nat Rev 2007; 8:741-52; PMID:17717517; http://dx.doi.org/ 10.1038/nrm2239 [DOI] [PubMed] [Google Scholar]
- [56].Eisenberg-Lerner A, Bialik S, Simon HU, Kimchi A. Life and death partners: apoptosis, autophagy and the cross-talk between them. Cell Death Differ 2009; 16:966-75; PMID:19325568; http://dx.doi.org/ 10.1038/cdd.2009.33 [DOI] [PubMed] [Google Scholar]
- [57].Bernard M, Dieude M, Yang B, Hamelin K, Underwood K, Hebert MJ. Autophagy fosters myofibroblast differentiation through MTORC2 activation and downstream upregulation of CTGF. Autophagy 2014; 10:2193-207; PMID:25495560; http://dx.doi.org/ 10.4161/15548627.2014.981786 [DOI] [PMC free article] [PubMed] [Google Scholar]
- [58].Leventhal JS, He JC, Ross MJ. Autophagy and immune response in kidneys. Semin Nephrol 2014; 34:53-61; PMID:24485030; http://dx.doi.org/ 10.1016/j.semnephrol.2013.11.008 [DOI] [PubMed] [Google Scholar]
- [59].Deretic V, Jiang S, Dupont N. Autophagy intersections with conventional and unconventional secretion in tissue development, remodeling and inflammation. Trends Cell Biol 2012; 22:397-406; PMID:22677446; http://dx.doi.org/ 10.1016/j.tcb.2012.04.008 [DOI] [PMC free article] [PubMed] [Google Scholar]
- [60].Sinha D, Wang Z, Price VR, Schwartz JH, Lieberthal W. Chemical anoxia of tubular cells induces activation of c-Src and its translocation to the zonula adherens. Am J Physiol Renal Physiol 2003; 284:F488-97; PMID:12419774; http://dx.doi.org/ 10.1152/ajprenal.00172.2002 [DOI] [PubMed] [Google Scholar]
- [61].Chen Z, Trotman LC, Shaffer D, Lin HK, Dotan ZA, Niki M, Koutcher JA, Scher HI, Ludwig T, Gerald W, et al.. Crucial role of p53-dependent cellular senescence in suppression of Pten-deficient tumorigenesis. Nature 2005; 436:725-30; PMID:16079851; http://dx.doi.org/ 10.1038/nature03918 [DOI] [PMC free article] [PubMed] [Google Scholar]
Associated Data
This section collects any data citations, data availability statements, or supplementary materials included in this article.