Abstract
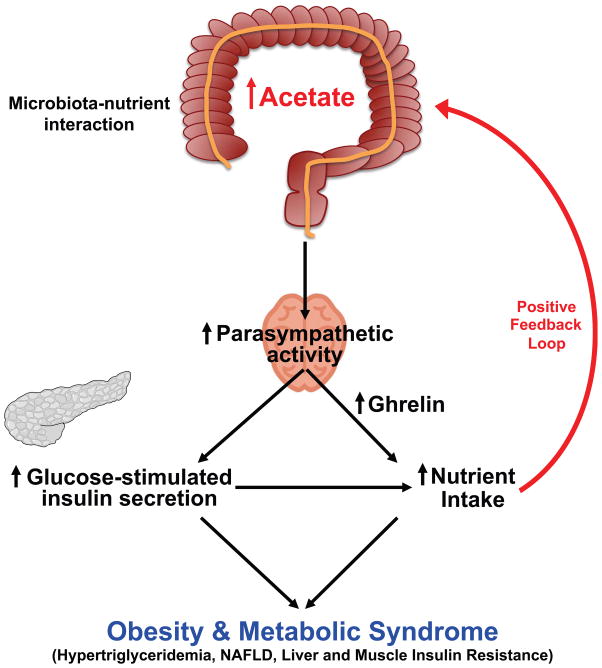
Obesity, insulin resistance and the metabolic syndrome are associated with changes to the gut microbiota; however, the mechanism by which modifications to the gut microbiota might lead to these conditions is unknown. Here we show that increased production of acetate by an altered gut microbiota leads to activation of the parasympathetic nervous system which in turn promotes increased glucose-stimulated insulin secretion (GSIS), increased ghrelin secretion, hyperphagia, obesity and its related sequelae (Extended Data Fig. 1). Taken together, these data identify increased acetate production by a nutrient-gut microbiota interaction and subsequent parasympathetic activation as possible therapeutic targets for obesity.
Gut microbial fatty acid turnover
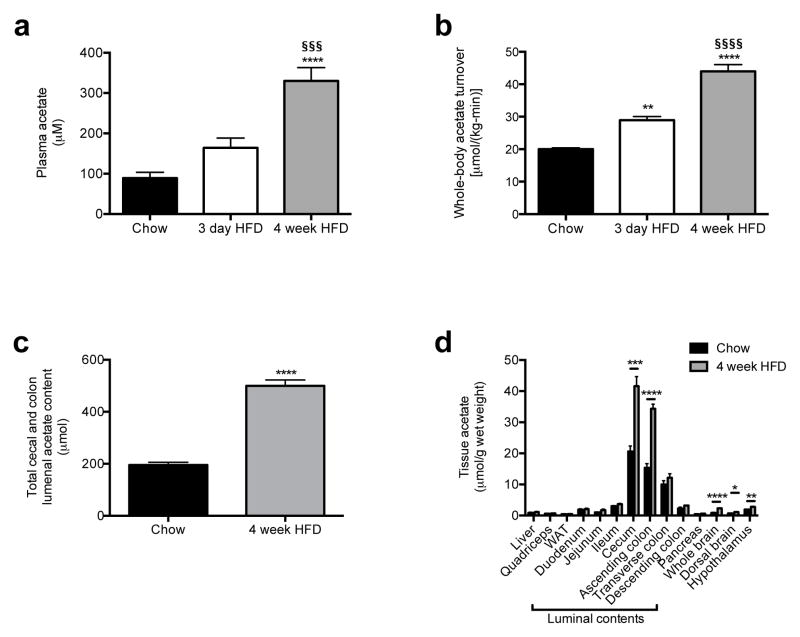
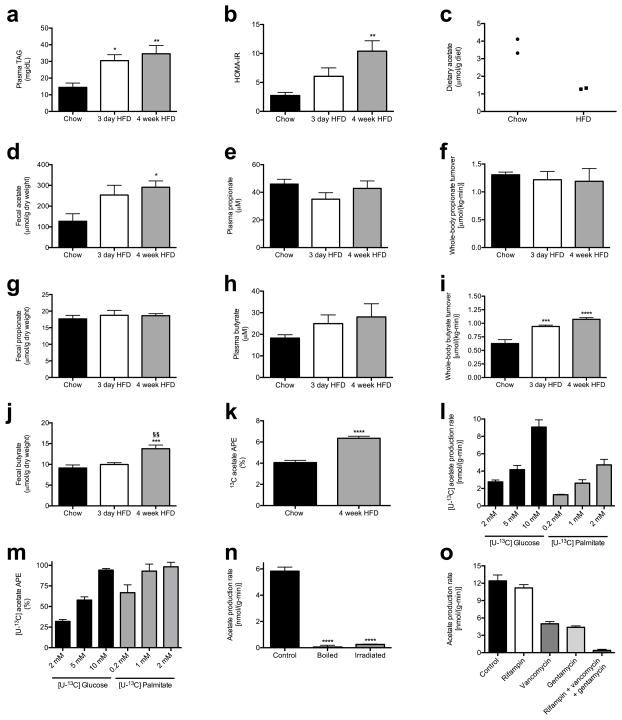
Prior studies have observed both increases1–5 and decreases6,7 in plasma and fecal short-chain fatty acid (SCFA) concentrations associated with overfeeding, obesity and the metabolic syndrome. However, whether and how alterations in SCFA play a causal role in the development of obesity is unknown. Because plasma SCFA concentrations may not fully represent the SCFA load presented to the body, we developed a method to measure whole-body turnover rates of acetate, propionate, and butyrate by gas chromatography/mass spectrometry (GC/MS) and found that, in contrast to propionate and butyrate, whole-body acetate turnover as well as plasma and fecal acetate concentrations were markedly increased in insulin resistant three day and four week high fat fed (HFD) rats (Fig. 1a–b, Extended Data Fig. 2a–j).
Fig. 1.
High fat fed rats exhibit increased whole-body acetate turnover. (a), (b) Plasma acetate concentrations and whole-body acetate turnover in chow, 3 day, and 4 week HFD rats. (c) Acetate content in the entire cecum and colon lumen. (d) Tissue acetate concentrations. In all panels, *P<0.05, **P<0.01, ***P<0.001, ****P<0.0001 vs. chow fed rats; §§§P<0.001, §§§§P<0.0001 vs. 3 day HFD rats. Data are the mean ± S.E.M. of n=6 animals per group.
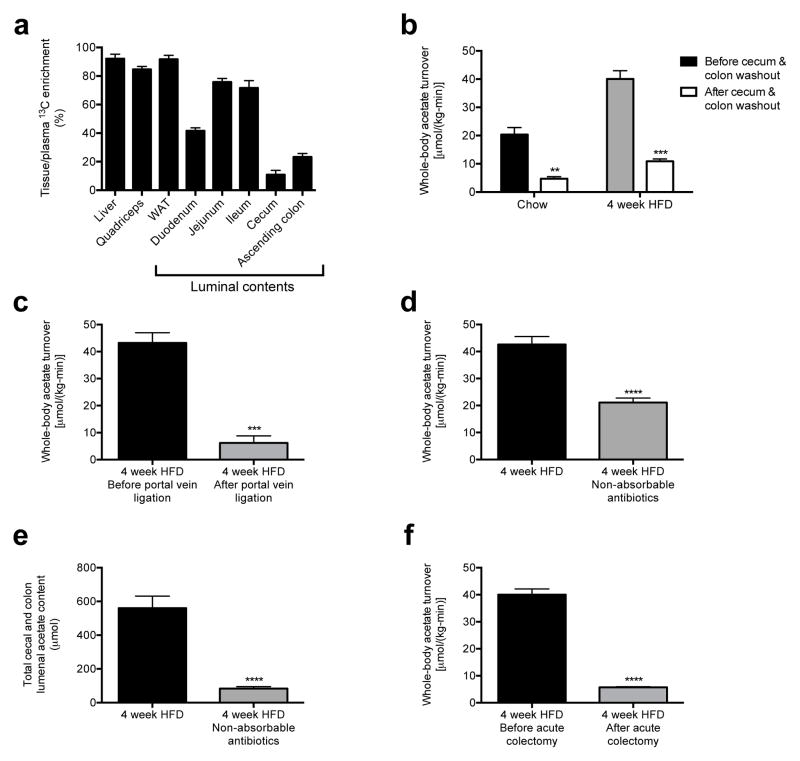
Next we sought to determine the source of the increased acetate turnover in HFD rats. We measured tissue acetate concentrations and dilution of 13C acetate label during an infusion of 13C acetate, and found each to be increased in the luminal contents of the cecum and ascending colon, with HFD rats exhibiting more than a two-fold increase in total acetate in the cecum and colon as well as in 13C bicarbonate incorporation into 13C acetate compared to chow fed rats (Fig. 1c–d, Fig. 2a, Extended Data Fig. 2k). In order to conclusively determine the source of the increased acetate production in HFD rats, we conducted four independent in vivo experiments to distinguish colon lumen acetate production from production by the rest of the body: we 1) washed out the contents of the cecum and colon with a saline flush, 2) ligated the portal vein below the splenic juncture, 3) treated rats with poorly absorbed broad-spectrum oral antibiotics and 4) performed an acute colectomy and found that each intervention reduced whole-body acetate turnover by 75–90% (Fig. 2b–f). Taken together these data strongly suggest that the gut microbiota is the source of most of the increased endogenous acetate production in HFD rats. We next showed that fecal material can generate acetate in vitro from 13C glucose or 13C fatty acids, and that boiling or irradiating the feces prevents the production of acetate, suggesting a role for fecal microbes in generating acetate (Extended Data Fig. 2l–n). Consistent with this hypothesis, treatment of the fecal material with broad-spectrum antibiotics vancomycin and/or gentamycin markedly reduced acetate production (Extended Data Fig. 2o).
Fig. 2.
The contents of the colonic lumen are the primary source of acetate in high fat fed rats. (a) Tissue/plasma 13C acetate enrichment in rats infused with 13C acetate. (b) Whole-body acetate turnover before and after washout of the gut. **P<0.01, ***P<0.001 vs. before washout. (c) Whole-body acetate turnover in HFD rats before and after portal vein ligation. (d), (e) Whole-body acetate turnover, and acetate in the entire cecum and colon lumen. (f) Whole-body acetate turnover in HFD rats before and after acute colectomy. In all panels, ***P<0.001, ****P<0.0001. Data are the mean ± S.E.M. of n=6 replicates per group.
Acetate drives insulin secretion
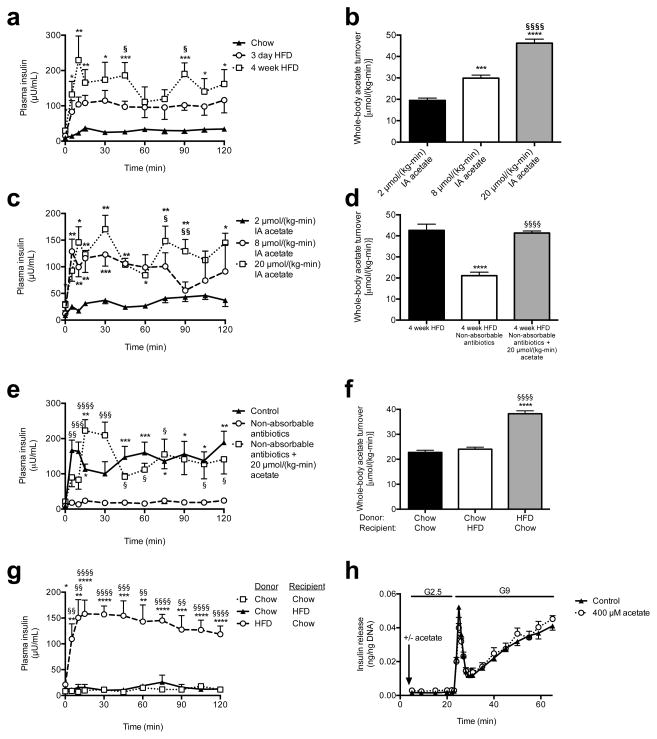
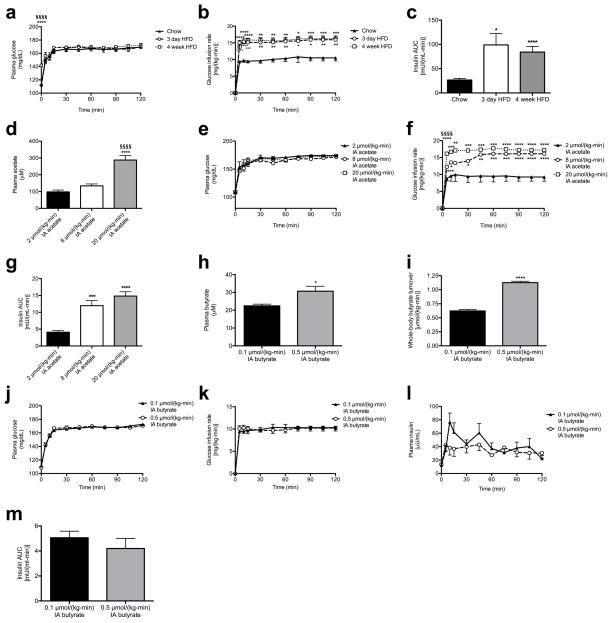
Next we examined glucose-stimulated insulin secretion (GSIS) during a hyperglycemic clamp and measured marked increases in GSIS in 3 day and 4 week HFD rats (Fig. 3a, Extended Data Fig. 3a–c). To determine whether the associated increases in acetate turnover drove this increased GSIS, we performed hyperglycemic clamps in chow fed rats given intra-arterial infusions of acetate to match whole-body acetate turnover to that measured in HFD rats. Acetate infusion in chow fed rats replicated the increases in GSIS measured in HFD rats (Fig. 3b–c, Extended Data Fig. 3d–g), strongly implicating increased acetate turnover in driving acute increases in GSIS in HFD rodents. In contrast, replacing butyrate turnover to levels observed in high fat fed rats had no effect on GSIS (Extended Data Fig. 3h–m).
Fig. 3.
Acetate turnover drives GSIS. (a) Plasma insulin in a hyperglycemic clamp. *P<0.05, **P<0.01, ***P<0.001 vs. chow; §P<0.05 vs. 3 day HFD. (b), (c) Acetate turnover and GSIS in rats given acute acetate. *P<0.05, **P<0.01, ****P<0.0001 vs. 2 μmol/(kg-min); §P<0.05, §§P<0.01, §§§§P<0.0001 vs. 8 μmol/(kg-min). (d), (e) Acetate turnover, GSIS. *P<0.05, **P<0.01, ****P<0.0001 vs. controls; §P<0.05, §§P<0.01, §§§P<0.001, §§§§P<0.0001 vs. antibiotics. (f), (g) Whole-body acetate turnover, GSIS. *P<0.05, **P<0.01, ***P<0.001, ****P<0.0001 vs. chow donor/chow recipient; §§P<0.01, §§§P<0.001, §§§§P<0.0001 vs. chow donor/HFD recipient. (h) GSIS in isolated islets (KRB buffer; n=4 replicates per group). Unless otherwise specified, n=6 replicates per group.
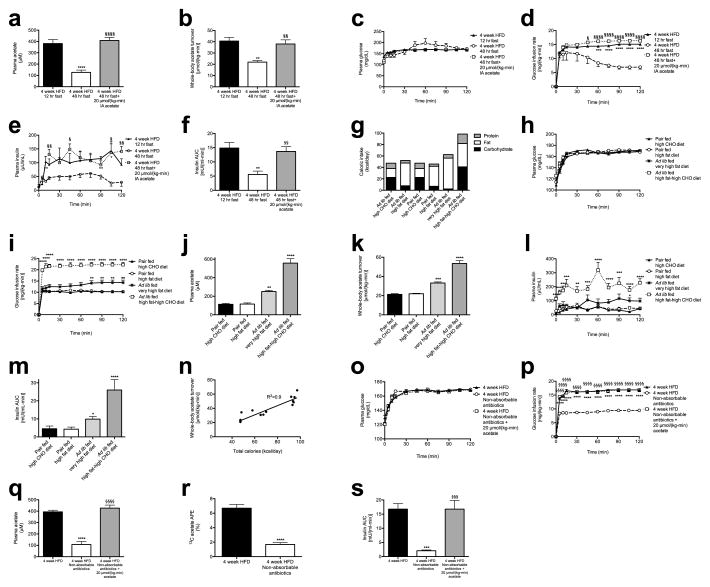
In order to further evaluate the effects of alterations in food intake on gut acetate production, we fasted 4 week HFD rats for 48 hours and found that this intervention resulted in ~50% reductions in whole-body acetate turnover and in GSIS; however, replacing acetate by arterial infusion of 20 μmol/(kg-min) acetate resulted in restoration of GSIS in 48 hour fasted rats (Extended Data Fig. 4a–f). Next we performed a series of dietary interventions to assess whether simple caloric excess or variations in nutrient composition8–10 were responsible for the increased acetate turnover measured in HFD rats (Extended Data Fig. 4g). Pair feeding isocaloric portions of chow or HFD resulted in no change in acetate turnover or GSIS, whereas dietary interventions resulting in increased caloric intake increased acetate turnover and GSIS proportionally to the total calories consumed (Extended Data Fig. 4h–n, R2=0.90). To examine the role of the gut microbiota in acetate-induced hyperinsulinemia, we treated HFD rats with broad-spectrum, poorly absorbable oral antibiotics and measured a 70% reduction in glucose-stimulated insulin secretion during a hyperglycemic clamp, which was acutely reversed by infusion of acetate to match plasma acetate turnover in HFD rats (Fig. 3d–e, Extended Data Fig. 4o–s).
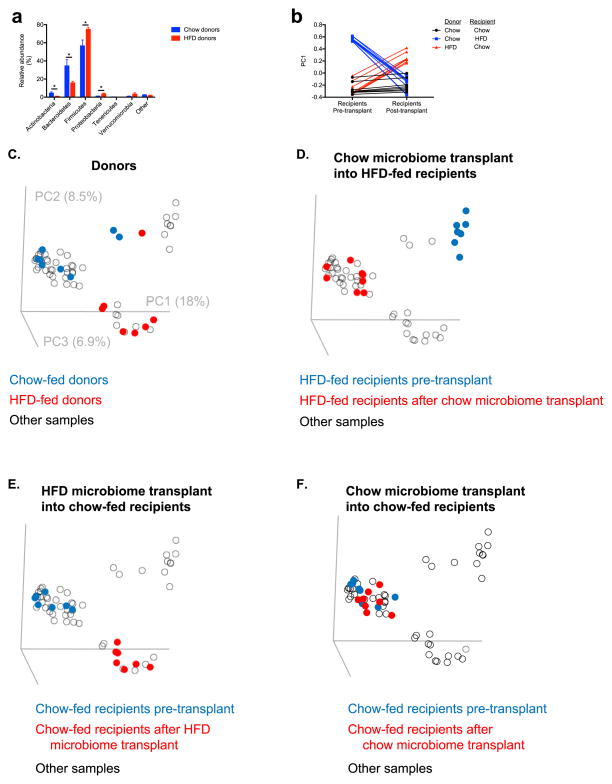
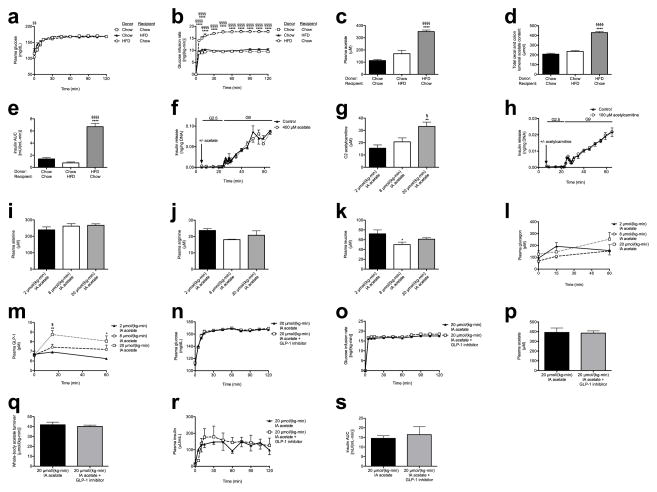
To establish a causal relationship between the microbiota and GSIS, we next transferred fecal material from chow- or HFD-fed donors to chow- or HFD-fed recipients under anaerobic conditions. Consistent with previous reports,4,12–15 culture-independent 16S rRNA sequencing of donor and recipient fecal microbiomes revealed an increase in the relative abundance of Firmicutes and a decrease in the relative abundance of Bacteroidetes in fresh fecal pellets from high fat fed donors relative to chow fed donors, and fecal transplantation altered the recipient animal microbiome to resemble that of the donor (Extended Data Fig. 5a–f). Notably, these fecal transplantations also transferred the corresponding acetate turnover, fecal acetate, and GSIS from the donor group to the recipient group (Fig. 3f–g, Extended Data Fig. 6a–e). However, transplantation of chow-fed donor microbiota into chow-fed recipients by an identical procedure did not produce microbiota alterations or metabolic phenotypes (Fig. 3f–g, Extended Data Fig. 5a–f, 6a–e).
Having found a strong causal relationship between acetate turnover and GSIS, we next examined the mechanism by which increased acetate turnover caused increased GSIS. We first examined whether acetate may stimulate GSIS through a direct effect on β-cells, perhaps through increasing acetylcarnitine concentrations.11,12 However, we found that neither acetate nor acetylcarnitine stimulated GSIS in isolated islet perifusions, ruling out a direct effect on the β-cell (Fig. 3h, Extended Data Fig. 6f–h). In addition, β-cell stimulatory amino acid concentrations and plasma glucagon concentrations were unchanged or reduced in the acetate-infused rats (Extended Data Fig. 6i–k). A small (~2 pM) but significant increase in plasma glucagon-like peptide-1 (GLP-1) concentrations was measured in rats infused with acetate ( Extended Data Fig. 6l). Because GLP-1 can stimulate GSIS,13,14 we treated acetate-infused rats with a GLP-1 inhibitor and found no difference in GSIS in these animals (Extended Data Fig. 6m–s), demonstrating that these small changes in GLP-1 were not responsible for the increased GSIS in acetate-infused rats.
Acetate drives GSIS via the parasympathetics
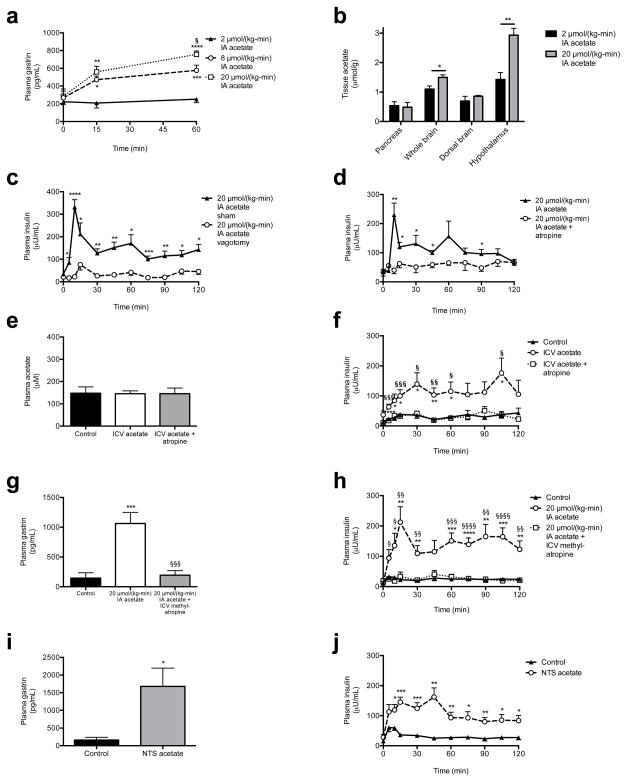
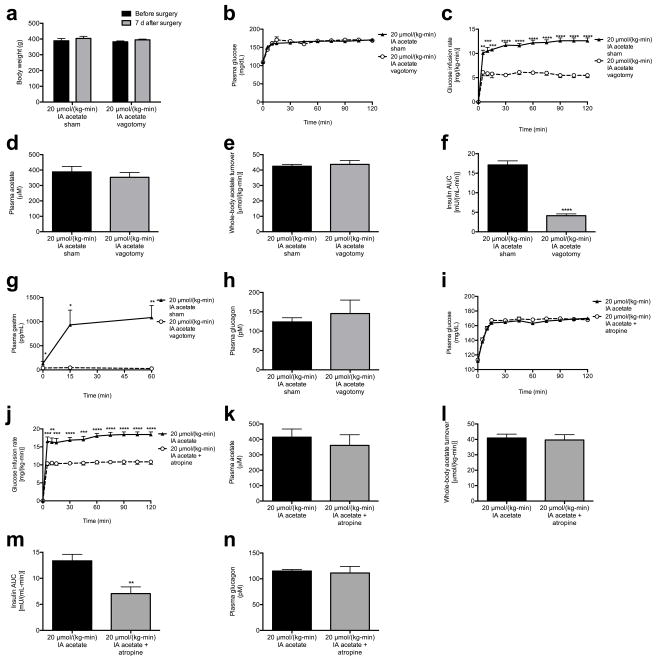
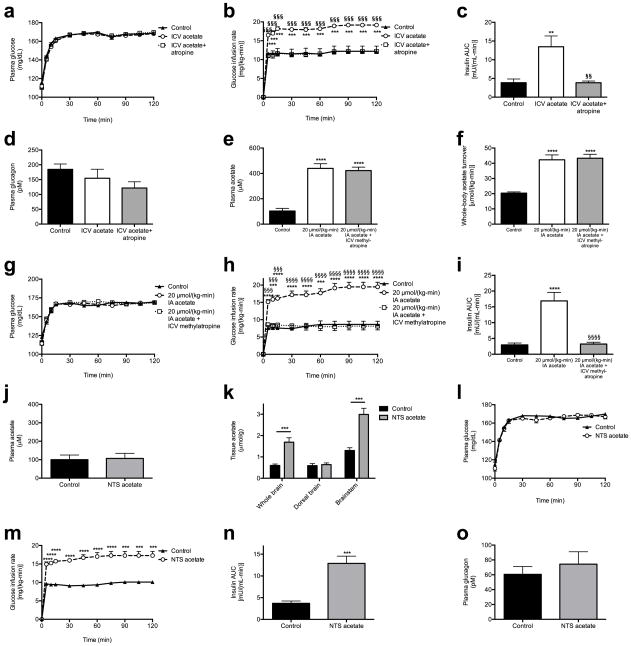
As parasympathetic input is a well-known stimulator of β-cell insulin secretion,15 we next measured plasma gastrin concentrations as a marker of parasympathetic activity in rats acutely infused with acetate, and observed a three-fold increase in plasma gastrin after 60 min of infusion with 20 μmol/(kg-min) acetate (Fig. 4a). Increases in brain acetate concentrations in the 20 μmol/(kg-min) acetate infused animals confirmed the ability of acetate infused systemically to enter the brain circulation (Fig. 4b). Because vagal stimulation has been shown to drive and vagotomy has been shown to suppress basal and glucose-stimulated insulin secretion,16–20 we hypothesized that vagotomy would reduce GSIS in acetate-infused rats. Consistent with this hypothesis, vagotomized rats exhibited ~4-fold lower plasma insulin concentrations throughout a hyperglycemic clamp without any effect on plasma glucagon concentrations (Fig. 4c, Extended Data Fig. 7a–h). In addition, treatment with the parasympathetic blocker atropine prior to the acetate infusion abolished acetate’s ability to stimulate GSIS, without any effect on plasma glucagon concentrations (Fig. 4d, Extended Data Fig. 7i–n), replicating prior studies demonstrating atropine’s ability to suppress basal and glucose-stimulated insulin secretion indirectly in vitro and in vivo.19,21–23 In order to further evaluate whether the effect of parasympathetic stimulation of GSIS is centrally mediated, we administered acetate intracerebroventricularly (ICV) at a dose chosen to increase cerebrospinal fluid acetate concentrations by 200 μM, mimicking the increases in plasma acetate concentrations measured with a 20 μmol/(kg-min) intra-arterial acetate infusion. ICV acetate tripled GSIS during a hyperglycemic clamp without any difference in systemic acetate concentrations; however, this effect was blocked by treatment with atropine, and was independent of changes in plasma glucagon concentrations (Fig. 4e–f, Extended Data Fig. 8a–d), suggesting a central effect of acetate to increase GSIS. Because atropine has also been shown to act directly on the β-cell to suppress insulin secretion, we infused rats with intra-arterial acetate and examined the effect of ICV methylatropine, an atropine analog that does not cross the blood-brain barrier. Consistent with an effect of acetate to drive GSIS via the parasympathetic nervous system, methylatropine fully abrogated the effect of acetate to drive GSIS (Fig. 4g–h, Extended Data Fig. 8e–i). To further implicate activation of the parasympathetic nervous system in driving this effect, we injected the same dose of acetate into the nucleus tractus solitarius (NTS), and found that this intervention replicated the effects of systemic and ICV acetate on GSIS by driving parasympathetic outflow as indicated by a ten-fold increase in plasma gastrin concentrations without any change in systemic plasma acetate or glucagon (Fig. 4i–j, Extended Data Fig. 8j–o). Taken together, these data conclusively demonstrate that the effect of acetate to increase GSIS occurs through parasympathetic activation.
Fig. 4.
Acetate drives increased GSIS via parasympathetic activation. (a) Plasma gastrin. *P<0.05, **P<0.01, ***P<0.001, ****P<0.0001 vs. 2 μmol/(kg-min); §P<0.05 vs. 8 μmol/(kg-min) acetate. (b) Tissue acetate. In (b)–(d), (i), and (j), *P<0.05, **P<0.01, ***P<0.001, and ****P<0.0001. (c), (d) GSIS. (e), (f) Plasma acetate and GSIS. *P<0.05, **P<0.01, ***P<0.001 vs. controls; §P<0.05, §§P<0.01, §§§P<0.001 vs. ICV acetate. (g), (h) Plasma gastrin (120 min) and GSIS. *P<0.05, **P<0.01, ***P<0.001, ****P<0.0001 vs. controls; §P<0.05, §§P<0.01, §§§P<0.001, §§§§P<0.0001 vs. acetate. (i), (j) Plasma gastrin (120 min) and GSIS following NTS acetate injection. Data are the mean ± S.E.M. of n=6 animals per group.
Chronic increases in acetate drive obesity
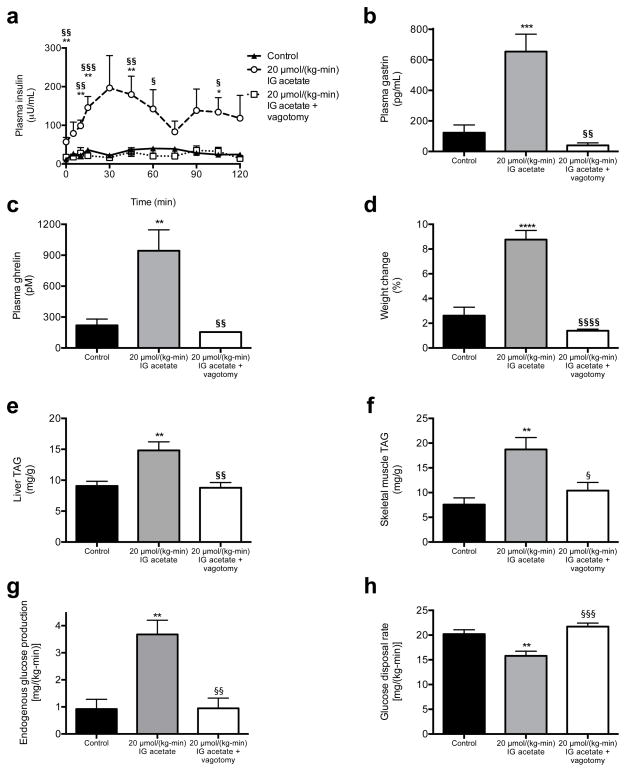
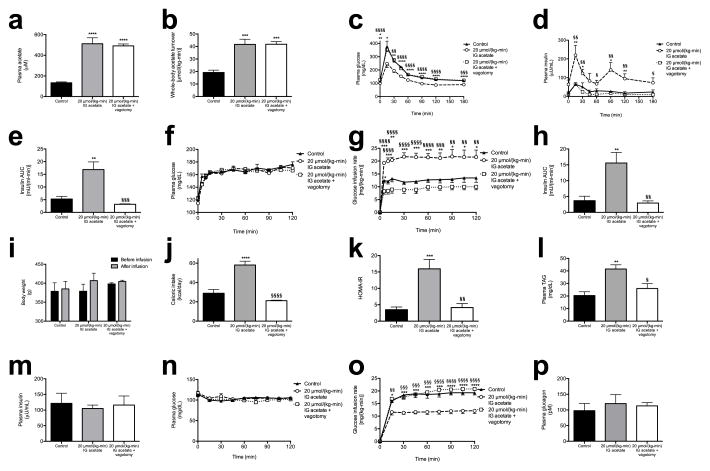
We next examined whether a chronic increase in acetate turnover would promote chronic hyperinsulinemia, hyperphagia, and weight gain and the associated sequelae of obesity. To test this hypothesis, we performed ten-day continuous intragastric acetate infusions, treating chow fed rats with 20 μmol/(kg-min) acetate to mimic the increase in gut microbial acetate production measured in HFD rats (Extended Data Fig. 9a–b). Chronic intragastric acetate-infused rats exhibited increased insulin secretion during both a hyperglycemic clamp and an intraperitoneal glucose tolerance test, which was associated with a five-fold increase in plasma gastrin concentrations (Fig. 5a–b, Extended Data Fig. 9c–h). All of these effects were prevented in vagotomized rats. Consistent with the hypothesis that chronic postprandial hyperinsulinemia leads to increased weight gain, chronic intragastric acetate-infused rats exhibited more than a doubling in daily caloric intake and in weight gain over the ten-day infusion, which may be attributable, at least in part, to a three-fold increase in plasma ghrelin concentrations (Fig. 5c–d, Extended Data Fig. 9i–j). These effects were also prevented in vagotomized rats, demonstrating that parasympathetic activation is necessary to mediate acetate’s chronic effects on GSIS in awake, unrestrained rodents. Finally, acetate-infused rats exhibited insulin resistance, as indicated by impaired glucose disposal and impaired insulin suppression of hepatic glucose production during a hyperinsulinemic-euglycemic clamp; and increases in plasma, liver, and skeletal muscle triglyceride content without any differences in plasma glucagon concentrations (Fig. 5e–h, Extended Data Fig. 9k–p). Vagotomized rats exhibited none of these consequences of the acetate infusion.
Fig. 5.
Chronic increases in whole-body acetate turnover promote hyperphagia, obesity, and metabolic syndrome. (a) Plasma insulin during a hyperglycemic clamp. In all panels, *P<0.05, **P<0.01, ***P<0.001, ****P<0.0001 vs. controls; §P<0.05, §§P<0.01, §§§P<0.001, §§§§P<0.0001 vs. acetate treated. n=6 replicates unless otherwise stated. (b), (c) Plasma gastrin and ghrelin at time 0 of the hyperglycemic clamp. (d) Weight change during the ten-day infusion (n=16 controls, 16 acetate, and 12 acetate + vagotomy). (e), (f) Liver and skeletal muscle triglyceride content. (g) Endogenous glucose production during a hyperinsulinemic-euglycemic clamp. (h) Glucose disposal rate during the clamp. All data are the mean ± S.E.M.
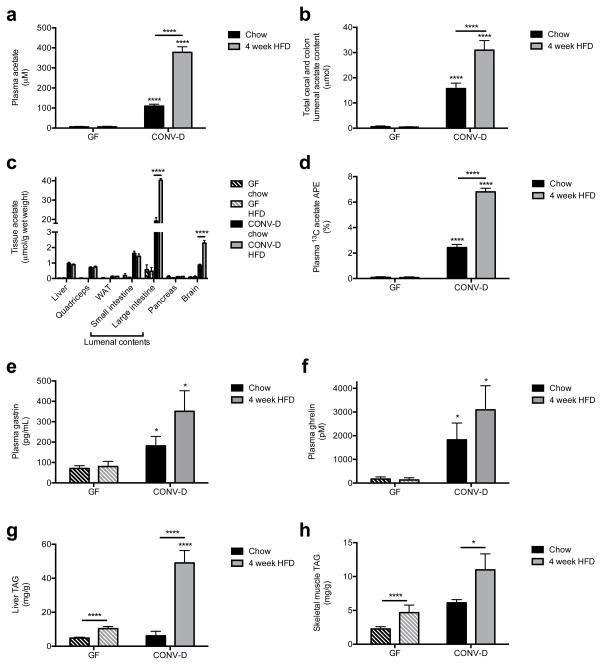
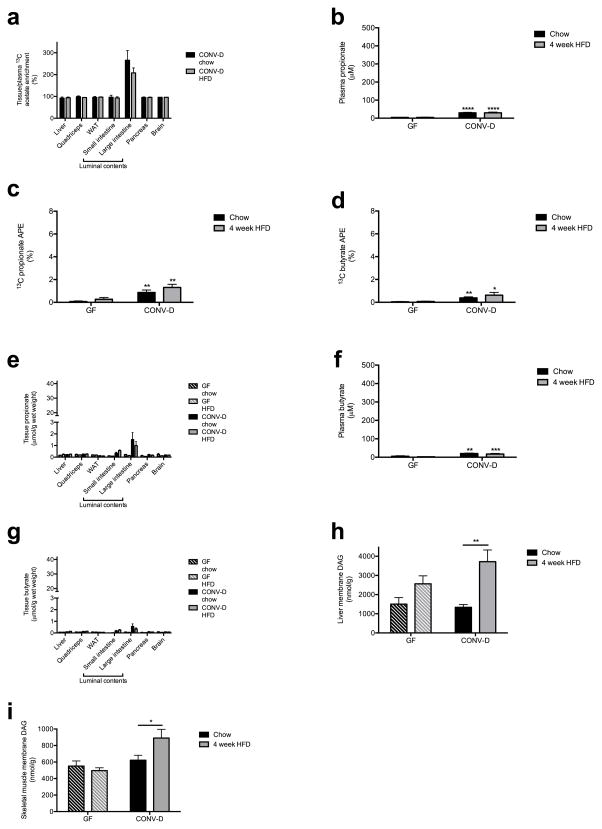
Taken together, each of these experiments strongly suggests that the gut microbiota are responsible for generating the increased acetate turnover and driving obesity in HFD rats, although we cannot rule out an additional contribution of the microbiota modulating acetate absorption.24 To conclusively test this hypothesis, we measured plasma and colonic acetate content in germ-free (GF) mice lacking gut microbes and ex-GF mice 4 weeks after colonization with normal mouse feces (conventionalized; CONV-D) fed either a regular chow or high fat diet. Demonstrating the role of the gut microbiota as the main producer of acetate in vivo, GF mice had negligible plasma, colonic lumen, and tissue acetate concentrations as compared to CONV-D mice; only conventionalized mice exhibited an increase in acetate concentrations on high fat diet (Fig. 6a–c). GF mice fed 13C bicarbonate also exhibited strikingly lower plasma and tissue 13C enrichment than CONV-D mice, and only in CONV-D mice, 13C acetate was doubled in HFD relative to chow fed animals (Fig. 6d). As rodents do not possess the enzymes necessary to convert bicarbonate to acetate, these results demonstrate that the gut microbiota are responsible for the increased acetate turnover in HFD animals, a conclusion corroborated by the fact that colonic 13C acetate enrichment in CONV-D mice was more than double the enrichment in plasma or in any other tissue (Extended Data Fig. 10a). In contrast propionate and butyrate concentration and enrichment were minimal in plasma and tissues in all mice (Extended Data Fig. 10b–g). Finally, because of the role of increased acetate in promoting parasympathetic activation, we measured plasma gastrin and ghrelin concentrations in the GF and CONV-D mice, and found that ex-GF conventionalized mice exhibited 2- and 10-fold increases in gastrin and ghrelin, respectively, which were associated with 2- and 5-fold increases in liver and skeletal muscle triglyceride content (Fig. 6e–h). Taken together, these data clearly implicate the gut microbiota as responsible for the majority of the whole-body plasma acetate turnover in vivo and for the increase in acetate turnover observed in high fat fed rodents.
Fig. 6.
Gut bacteria are responsible for the majority of acetate production in vivo, and for the increase in HFD rodents. (a), (b) Plasma and cecal/colon lumen acetate concentrations in germ-free (GF) and ex-GF conventionalized (CONV-D) mice. In all panels, *P<0.05 and ****P<0.0001. (c) Tissue acetate concentrations. (d) Plasma 13C acetate enrichment in mice fed water containing 13C bicarbonate for 3 days. (e), (f) Plasma gastrin and ghrelin concentrations. (g), (h) Liver and skeletal muscle triglyceride content. In all panels, data are the mean ± S.E.M. of n=9 GF mice and 10 CONV-D mice per diet.
Conclusions
In summary, we show here that increased acetate production due to a gut microbiota-nutrient interaction in high fat fed rodents leads to activation of the parasympathetic nervous system resulting in increased ghrelin secretion and GSIS. This generates a positive feedback loop resulting in hyperphagia, hypertriglyceridemia, ectopic lipid deposition in liver and skeletal muscle, and liver and muscle insulin resistance. Evolutionarily, the increased acetate production that occurs when the gut microbiota are exposed to calorically dense nutrients may mediate an important positive feedback loop between the gut microbiota and the CNS that promotes hyperphagia (due to increased ghrelin secretion) and increased energy storage as fat (due to increased glucose-stimulated insulin secretion) in foraging animals when they stumble across calorically dense foodstuffs in the wilderness. However, in the setting of chronic exposure to calorically dense, abundant food, this gut microbiota-brain-β cell axis promotes obesity and its related sequelae of hyperlipidemia, fatty liver disease and insulin resistance.
Extended Data
Extended Data Fig. 1.
Mechanism by which a diet-microbiota interaction drives obesity and the metabolic syndrome.
Extended Data Fig. 2.
HFD rats exhibit increased gut acetate production. (a) Plasma triglycerides. In all panels, *P<0.05, **P<0.01, ***P<0.001, ****P<0.0001 vs. chow fed rats; §§P<0.01 vs. 3 day HFD rats. (b) HOMA-IR. (c) Dietary acetate concentrations. n=2 replicates per diet. In panels (c) and (k), data were compared by the 2-tailed unpaired Student’s t-test. (d) Fecal acetate normalized to dry weight. (e)–(g) Plasma propionate, whole-body propionate turnover, and fecal propionate concentrations. (h)–(j) Plasma butyrate, whole-body butyrate turnover, and fecal butyrate concentrations. (k) 13C acetate enrichment in plasma of rats fed 13C bicarbonate labeled food and water. (l) [U-13C] acetate from feces incubated in [U-13C] glucose or fatty acids. In panels (l)–(o), data are the mean ± S.E.M. of n=4 per group, with comparisons to controls (n) via the 2-tailed unpaired Student’s t-test. (m) In vitro acetate production rate from feces incubated in [U-13C] glucose or fatty acids. (n) In vitro acetate production rate in control, boiled, and UV irradiated fecal samples. ****P<0.0001 vs. control. (o) In vitro fecal acetate production following treatment with antibiotics. Unless otherwise specified, n=6 replicates per group.
Extended Data Fig. 3.
HFD rats exhibit increased GSIS driven by increased acetate turnover. (a), (b) Plasma glucose and glucose infusion rate during a hyperglycemic clamp. In all panels, *P<0.05, **P<0.01, ***P<0.001, ****P<0.0001 vs. chow fed rats. (c) Plasma insulin area under the curve (AUC) during the hyperglycemic clamp. (d) Plasma acetate. In all panels, *P<0.05, **P<0.01, ***P<0.001, ****P<0.0001 vs. 2 μmol/(kg-min) acetate; §§§§P<0.0001 vs. 8 μmol/(kg-min) acetate. (e), (f) Plasma glucose and glucose infusion rate during a hyperglycemic clamp. (g) Plasma insulin AUC during the clamp. (a), (b) Plasma butyrate and whole-body butyrate turnover. *P<0.05, ****P<0.0001. (c), (d) Plasma glucose and glucose infusion rate during a hyperglycemic clamp. (e), (f) Plasma insulin concentrations during the hyperglycemic clamp, and plasma insulin AUC. In all panels, data are the mean ± S.E.M. of n=6 animals per group, with comparisons by one-way ANOVA with Bonferroni’s multiple comparisons test [panels (a)–(g)] or by the 2-tailed unpaired Student’s t-test [panels (h)–(m)].
Extended Data Fig. 4.
Increasing total caloric intake leads to increased acetate turnover and GSIS via the microbiota in rats. (a), (b) Plasma acetate and whole-body acetate turnover. In panels (a)–(f), *P<0.05, **P<0.01, ***P<0.001, ****P<0.0001 vs. 12 hour fasted rats; §P<0.05, §§P<0.01, §§§P<0.001, §§§§P<0.0001 vs. 48 hour fasted rats. (c), (d) Plasma glucose and glucose infusion rate during a hyperglycemic clamp. (e), (f) Plasma insulin and insulin AUC during the clamp. (g) Caloric intake from protein, fat, and carbohydrate. In panels (g)–(m), each group was compared to pair fed, high carbohydrate fed rats. (h), (i) Plasma glucose and glucose infusion rate in the hyperglycemic clamp. In all panels, *P<0.05, **P<0.01, ***P<0.001, ****P<0.0001 vs. pair fed rats given the high CHO diet. (j), (k) Plasma acetate and whole-body acetate turnover. (l), (m) Plasma insulin and insulin AUC during the hyperglycemic clamp. (n) Linear regression: whole-body acetate turnover vs. total caloric intake in each diet group. (o), (p) Plasma glucose and glucose infusion rate during a hyperglycemic clamp in 4 week HFD rats treated with broad-spectrum non-absorbable antibiotics. In panels (o)–(r), ***P<0.001, ****P<0.0001 vs. HFD rats; §§§P<0.001, §§§§P<0.0001 vs. antibiotics-treated rats. (q) Plasma acetate. (r) Plasma 13C acetate enrichment following three days of feeding 13C bicarbonate food and water. Data were compared using the 2-tailed unpaired Student’s t-test. (s) Insulin AUC during a hyperglycemic clamp. Data are mean ± S.E.M. of n=6 per group. In all panels, data are the mean ± S.E.M. of n=6 rats per group, with groups compared by one-way ANOVA with Bonferroni’s multiple comparisons test, unless otherwise stated.
Extended Data Fig. 5.
Fecal transplantation alters recipient microbiomes to resemble their donors as revealed by culture-independent 16S rRNA sequencing of fecal microbiomes from donors and recipients. (a) Relative abundance at the phylum level. Only phyla with relative abundance ≥0.1% in at least one group are shown. Data are the mean ± S.E.M. of n=7–8 replicates per group; *P<0.05 by the 2-tailed unpaired Student’s t-test. (b)–(f) Comparison of fecal microbiomes before and after transplantation (beta diversity analysis) as measured by PC1 (b) or in a three-dimensional representation (c)–(f). Rats from independent litters were randomized prior to diet administration or fecal transplantation. Beta diversity reflects principal coordinates analysis based on Hellinger distances; the results from unweighted, non-phylogenetic distance metrics and from phylogenetic metrics (weighted and unweighted UniFrac) are similar.
Extended Data Fig. 6.
The gut microbiota drive increased acetate turnover and GSIS. (a), (b) Plasma glucose and glucose infusion rate during a hyperglycemic clamp in rats following fecal transplant replicates acetate turnover and GSIS in the donor group. In panels (a)–(c) and (e), ****P<0.0001 vs. chow (donor) to chow (recipient) transplants; §§§§P<0.0001 vs. chow (donor) to HFD (recipient) transplants. Data are the mean ± S.E.M. of n=6 (HFD to chow) or 7 (chow to chow, chow to HFD) per group. (c) Plasma acetate. (d) Fecal acetate concentration. n=7 (HFD to chow) or 8 (chow to chow, chow to HFD) per group. (e) Plasma insulin AUC. (f) Glucose-stimulated insulin release in isolated islets incubated with 400 μM acetate in a physiologic buffer. n=4 per group. (g) Plasma C2 acetylcarnitine content. In panels (g)–(m), *P<0.05, **P<0.01 vs. 2 μmol/(kg-min) acetate; §P<0.05 vs. 8 μmol/(kg-min) acetate by one-way ANOVA with Bonferroni’s multiple comparisons test. In panels (g)–(s), data are the mean ± S.E.M. of n=6 (unless otherwise specified) per group. (h) Glucose-stimulated insulin release in isolated islets incubated with 100 μM acetylcarnitine. (i)–(m) Plasma alanine, leucine, arginine, glucagon, and GLP-1 concentrations. (n), (o) Plasma glucose and glucose infusion rate during a hyperglycemic clamp in acetate-infused rats treated with a GLP-1 inhibitor. In panels (n)–(s), no significant differences were measured by the two-tailed unpaired Student’s t-test. (p), (q) Plasma acetate and whole-body acetate turnover. (r), (s) Plasma insulin and insulin AUC during the clamp. In all panels, data are mean ± S.E.M. of n=6 per group.
Extended Data Fig. 7.
Acetate drives GSIS via parasympathetic activation. (a) Body weight before and after vagotomy. (b), (c) Plasma glucose and glucose infusion rate during a hyperglycemic clamp. In all panels, *P<0.05, **P<0.01, ***P<0.001, ****P<0.0001 by the 2-tailed unpaired Student’s t-test. (d), (e) Plasma acetate and whole-body acetate turnover. (f) Insulin AUC during the clamp. (g) Plasma gastrin during the clamp. (h) Plasma glucagon at 120 min of the clamp. (h), (i) Plasma glucose and glucose infusion rate during a hyperglycemic clamp in acetate-infused, atropine-treated rats. (k), (l) Plasma acetate and whole-body acetate turnover. (m) Plasma insulin area under the curve during the clamp. (n) Plasma glucagon. In all panels, data represent the mean ± S.E.M. of n=6 replicates per group, with comparisons by the two-tailed unpaired Student’s t-test.
Extended Data Fig. 8.
Acetate drives GSIS via parasympathetic activation. (a), (b) Plasma glucose and glucose infusion rate during a hyperglycemic clamp in rats treated with ICV acetate. In panels (b)–(d), **P<0.01, ***P<0.001 vs. controls; §§P<0.01, §§§P<0.001 vs. ICV acetate treated rats by one-way ANOVA with Bonferroni’s multiple comparisons test. (c) Plasma insulin AUC. (d) Plasma glucagon. (e), (f) Plasma acetate and whole-body acetate turnover in rats treated with systemic intra-arterial acetate and ICV methylatropine. In panels (e)–(i), ***P<0.001, ****P<0.0001 vs. controls; §§§P<0.001, §§§§P<0.0001 vs. acetate-infused rats. (g), (h) Plasma glucose and glucose infusion rate during a hyperglycemic clamp. (i) Plasma insulin AUC during the clamp. (j), (k) Plasma and brain tissue acetate in rats given an injection of acetate into the NTS. (l), (m) Plasma glucose and glucose infusion rate during a hyperglycemic clamp. (n) Plasma insulin area under the curve during the clamp. (o) Plasma glucagon. In all panels, data are the mean ± S.E.M. of n=6 animals per group, with comparisons by one-way ANOVA with Bonferroni’s multiple comparisons test [panels (a)–(i)], or by the 2-tailed unpaired Student’s t-test [panels (j)–(o)].
Extended Data Fig. 9.
Chronic intragastric acetate infusion causes hyperphagia and metabolic syndrome through parasympathetic activation. (a), (b) Plasma acetate and whole-body acetate turnover. In all panels, *P<0.05, **P<0.01, ***P<0.001, ****P<0.0001 vs. controls; §P<0.05, §§P<0.01, §§§P<0.001, §§§§P<0.0001 vs. intragastric acetate infused rats. (c), (d) Plasma glucose and insulin concentrations during an intraperitoneal glucose tolerance test. (e) Insulin area under the curve during the glucose tolerance test. (f), (g) Plasma glucose and glucose infusion rate during a hyperglycemic clamp. (h) Insulin area under the curve during the hyperglycemic clamp. (i) Body weight before and after the infusion study (n=16 controls, 16 acetate infused, and 12 acetate infused + vagotomy). (j) Caloric intake during the 10-day acetate infusion study. (k) HOMA-IR. (l) Plasma triglyceride concentrations. (m) Plasma insulin at the 120 min time point of a hyperinsulinemic-euglycemic clamp. (n), (o) Plasma glucose and glucose infusion rate during the hyperinsulinemic-euglycemic clamp. (p) Plasma glucagon. Unless otherwise specified, data are presented as the mean ± S.E.M. of n=6 rats per group, with comparisons by one-way ANOVA with Bonferroni’s multiple comparisons test.
Extended Data Fig. 10.
Germ-free mice have negligible endogenous short-chain fatty acid production. (a) Ratio of tissue/plasma 13C acetate in mice fed 13C bicarbonate. (b), (c) Plasma and tissue propionate concentrations. In all panels, *P<0.05, **P<0.01, ***P<0.001, ****P<0.0001 vs. CONV-D mice on the same diet. (d) Plasma 13C propionate enrichment. (e), (f) Plasma and tissue butyrate. (g) Plasma 13C butyrate enrichment. (h), (i) Liver and muscle diacylglycerol concentrations. In all panels, data are the mean ± S.E.M. of n=9 (GF) or n=10 (CONV-D) mice per group, with comparisons by the two-tailed unpaired Student’s t-test.
Supplementary Material
Acknowledgments
The authors thank Jianying Dong, Yuichi Nozaki, Wanling Zhu, Xiaojian Zhao, John Stack, Mario Kahn, Bentley Lim, and Yanna Kosover for their expert technical assistance. This study was funded by grants from the National Institutes of Health (R01 DK-40936, R01 AG-23686, P30 DK-45735, U24 DK-59635, T32 DK-101019, R01 DK-92606, R01 DK-089121, DP2 GM-103574) and the Novo Nordisk Foundation Center for Basic Metabolic Research, University of Copenhagen.
Footnotes
Supplementary Information (Extended Data) is linked to the online version of the paper at www.nature.com/nature.
Author Contributions
R.J.P., L.P., N.A.B., G.W.C., D.Z., and R.L.P. performed the in vivo and in vitro studies, and all authors analyzed data. G.W.C., K.F.P., R.G.K., A.L.G., and G.I.S. provided critical advice for the experiments. Studies were designed and the manuscript was written by R.J.P. and G.I.S. with input from all authors.
The authors declare no competing financial interests.
Sequence data are deposited with accession code PRJEB13505.
References
- 1.Rahat-Rozenbloom S, Fernandes J, Gloor GB, Wolever TM. Evidence for greater production of colonic short-chain fatty acids in overweight than lean humans. International journal of obesity. 2014;38:1525–1531. doi: 10.1038/ijo.2014.46. [DOI] [PMC free article] [PubMed] [Google Scholar]
- 2.Shepherd ML, Ponder MA, Burk AO, Milton SC, Swecker WS., Jr Fibre digestibility, abundance of faecal bacteria and plasma acetate concentrations in overweight adult mares. Journal of nutritional science. 2014;3:e10. doi: 10.1017/jns.2014.8. [DOI] [PMC free article] [PubMed] [Google Scholar]
- 3.Turnbaugh PJ, et al. An obesity-associated gut microbiome with increased capacity for energy harvest. Nature. 2006;444:1027–1031. doi: 10.1038/nature05414. [DOI] [PubMed] [Google Scholar]
- 4.Fernandes J, Su W, Rahat-Rozenbloom S, Wolever TM, Comelli EM. Adiposity, gut microbiota and faecal short chain fatty acids are linked in adult humans. Nutrition & diabetes. 2014;4:e121. doi: 10.1038/nutd.2014.23. [DOI] [PMC free article] [PubMed] [Google Scholar]
- 5.Li M, et al. Gut carbohydrate metabolism instead of fat metabolism regulated by gut microbes mediates high-fat diet-induced obesity. Beneficial microbes. 2014;5:335–344. doi: 10.3920/BM2013.0071. [DOI] [PubMed] [Google Scholar]
- 6.Murugesan S, et al. Study of the diversity and short-chain fatty acids production by the bacterial community in overweight and obese Mexican children. European journal of clinical microbiology & infectious diseases: official publication of the European Society of Clinical Microbiology. 2015 doi: 10.1007/s10096-015-2355-4. [DOI] [PubMed] [Google Scholar]
- 7.Murphy EF, et al. Composition and energy harvesting capacity of the gut microbiota: relationship to diet, obesity and time in mouse models. Gut. 2010;59:1635–1642. doi: 10.1136/gut.2010.215665. [DOI] [PubMed] [Google Scholar]
- 8.David LA, et al. Diet rapidly and reproducibly alters the human gut microbiome. Nature. 2014;505:559–563. doi: 10.1038/nature12820. [DOI] [PMC free article] [PubMed] [Google Scholar]
- 9.La-Ongkham O, Nakphaichit M, Leelavatcharamas V, Keawsompong S, Nitisinprasert S. Distinct gut microbiota of healthy children from two different geographic regions of Thailand. Archives of microbiology. 2015 doi: 10.1007/s00203-015-1089-0. [DOI] [PubMed] [Google Scholar]
- 10.Aguirre M, Jonkers DM, Troost FJ, Roeselers G, Venema K. In vitro characterization of the impact of different substrates on metabolite production, energy extraction and composition of gut microbiota from lean and obese subjects. PloS one. 2014;9:e113864. doi: 10.1371/journal.pone.0113864. [DOI] [PMC free article] [PubMed] [Google Scholar]
- 11.Ronnebaum SM, et al. Chronic suppression of acetyl-CoA carboxylase 1 in beta-cells impairs insulin secretion via inhibition of glucose rather than lipid metabolism. The Journal of biological chemistry. 2008;283:14248–14256. doi: 10.1074/jbc.M800119200. [DOI] [PMC free article] [PubMed] [Google Scholar]
- 12.Shen W, et al. Protective effects of R-alpha-lipoic acid and acetyl-L-carnitine in MIN6 and isolated rat islet cells chronically exposed to oleic acid. J Cell Biochem. 2008;104:1232–1243. doi: 10.1002/jcb.21701. [DOI] [PubMed] [Google Scholar]
- 13.Drucker DJ. Minireview: the glucagon-like peptides. Endocrinology. 2001;142:521–527. doi: 10.1210/endo.142.2.7983. [DOI] [PubMed] [Google Scholar]
- 14.MacDonald PE, et al. The multiple actions of GLP-1 on the process of glucose-stimulated insulin secretion. Diabetes. 2002;51(Suppl 3):S434–442. doi: 10.2337/diabetes.51.2007.s434. [DOI] [PubMed] [Google Scholar]
- 15.Ahren B. Autonomic regulation of islet hormone secretion--implications for health and disease. Diabetologia. 2000;43:393–410. doi: 10.1007/s001250051322. [DOI] [PubMed] [Google Scholar]
- 16.Ionescu E, Rohner-Jeanrenaud F, Berthoud HR, Jeanrenaud B. Increases in plasma insulin levels in response to electrical stimulation of the dorsal motor nucleus of the vagus nerve. Endocrinology. 1983;112:904–910. doi: 10.1210/endo-112-3-904. [DOI] [PubMed] [Google Scholar]
- 17.Sakaguchi T, Yamaguchi K. Effects of electrical stimulation of the hepatic vagus nerve on the plasma insulin concentration in the rat. Brain research. 1979;164:314–316. doi: 10.1016/0006-8993(79)90028-3. [DOI] [PubMed] [Google Scholar]
- 18.Lee KC, Miller RE. The hepatic vagus nerve and the neural regulation of insulin secretion. Endocrinology. 1985;117:307–314. doi: 10.1210/endo-117-1-307. [DOI] [PubMed] [Google Scholar]
- 19.Frohman LA, Ezdinli EZ, Javid R. Effect of vagotomy and vagal stimulation on insulin secretion. Diabetes. 1967;16:443–448. doi: 10.2337/diab.16.7.443. [DOI] [PubMed] [Google Scholar]
- 20.Bergman RN, Miller RE. Direct enhancement of insulin secretion by vagal stimulation of the isolated pancreas. The American journal of physiology. 1973;225:481–486. doi: 10.1152/ajplegacy.1973.225.2.481. [DOI] [PubMed] [Google Scholar]
- 21.Ahren B, Holst JJ. The cephalic insulin response to meal ingestion in humans is dependent on both cholinergic and noncholinergic mechanisms and is important for postprandial glycemia. Diabetes. 2001;50:1030–1038. doi: 10.2337/diabetes.50.5.1030. [DOI] [PubMed] [Google Scholar]
- 22.Yamazaki H, Philbrick W, Zawalich KC, Zawalich WS. Acute and chronic effects of glucose and carbachol on insulin secretion and phospholipase C activation: studies with diazoxide and atropine. American journal of physiology. Endocrinology and metabolism. 2006;290:E26–E33. doi: 10.1152/ajpendo.00149.2005. [DOI] [PubMed] [Google Scholar]
- 23.D’Alessio DA, Kieffer TJ, Taborsky GJ, Jr, Havel PJ. Activation of the parasympathetic nervous system is necessary for normal meal-induced insulin secretion in rhesus macaques. The Journal of clinical endocrinology and metabolism. 2001;86:1253–1259. doi: 10.1210/jcem.86.3.7367. [DOI] [PubMed] [Google Scholar]
- 24.Wichmann A, et al. Microbial modulation of energy availability in the colon regulates intestinal transit. Cell host & microbe. 2013;14:582–590. doi: 10.1016/j.chom.2013.09.012. [DOI] [PubMed] [Google Scholar]
Associated Data
This section collects any data citations, data availability statements, or supplementary materials included in this article.


