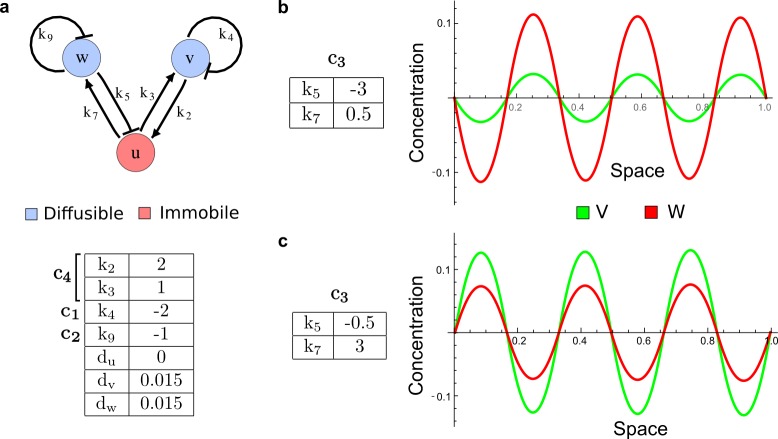
Appendix 3—figure 2. Different ranges of the pattern of v and w in the network of Figure 2c.
(a) The Type II network shown in Figure 2c (center) with reaction rates that implement the cycles c1, c2, c4 and diffusion rates. (b–c) Different reaction rates for the cycle c3 determine different ranges for the peaks of v and w despite their identical diffusion coefficients and half-lives.

