Abstract
Nanoparticles of gadolinium-incorporated Prussian blue show potential as a cellular T1-weighted oral MRI probe for imaging the gastrointestinal tract
Keywords: Prussian blue, nanoparticles, magnetic resonance imaging, contrast agents, relaxivity, coordination polymers
Graphical abstract
1. INTRODUCTION
For many years, magnetic resonance imaging (MRI) was not considered the method of choice for imaging the gastrointestinal (GI) tract due to the presence of respiratory, cardiac motion and intestinal peristaltic artifacts.1–2 Recent technical advances in the MRI data acquisition field, specifically the rapid imaging and artifact suppression techniques as well as the development of torso phased array coils, have made it possible to use MRI to image the abdomen.3–5 However, the lack of reliable oral MRI contrast agents (CAs) is still a limiting factor for the wide spread clinical applications of MRI in the diagnosis of the GI tract diseases and conditions.6 Although several oral CAs for MRI are commercially available, each one of them suffers certain problems, and thus none of them is used routinely in clinical practice.7–8 For example, ammonium ferric citrate (AFC) has been used as an oral T1-weighted (i.e. positive) MRI contrast agent in Japan since 1993.7,9–10 Because AFC slowly decomposes in the stomach juice, a large dosage of AFC (i.e. 600 to 1200 mg in 600 mL of solution) is required to show an effective contrast enhancement. Satisfactory contrast enhancement can be obtained only in the upper abdomen due to the lack of temporal stability of AFC in the GI tract. In addition to a reduction of signals in the lower abdomen, about 15% of patients experience some kind of GI discomfort or minor side effects caused by AFC. Manganese chloride (LumenHance®) has been used as an oral contrast agent. Because the Mn2+ ions can be absorbed by the linings of the GI tract, signal intensity (SI) on T1-weighted images is increased, while SI on T2-weighted images is suppressed.11–12 However, the adsorption of Mn2+ ions in the GI tract also makes adequate distension of the small intestine problematic. Furthermore, homogeneous and stable signals are difficult to obtain throughout the entire GI tract. Magnevist Enteral®, a dimeglumine salt of Gd-DTPA mixed with mannitol, was initially marketed by Schering AG in Berlin, Germany as an oral contrast agent for imaging the bowel. Due to various side effects and the safety concern of the Gd3+ adsorption, enteral and rectal administration is often used in the otherwise difficult diagnosis of pancreatic disease.13 There exist several negative oral MRI contrast agents such as perfluorooctylbromide (Imagent GI®)14 and various formulations of superparamagnetic iron oxide nanoparticles.15–17 These agents can enhance image contrast by shortening the T2 relaxation of water’s protons, and thus causing the image to darken. In general, negative contrast agents are of limited clinical value because the image produced from the T2-weighed mode are prone to the interference with internal bleeding, metal deposits, or other artifacts from the background.18
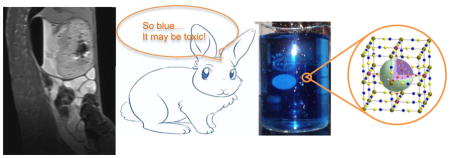
Previously, we have demonstrated that nanoparticles of Prussian blue can penetrate the cell membrane via endocytosis to act as an effective cellular T1-weighted MRI contrast agent.19–20 Prussian blue (PB) is iron(III) hexacyanoferrate(II) with a face-centered cubic structure in which two different iron centers Fe3+ and Fe2+ are bridged by the CN− groups. In the crystal structure of the most common form of PB, KFeIII[FeII(CN)6].nH2O (n=14–16), the interstitial positions occupied by K+ ions may be replaced with Gd3+ ions to create the Gd-incorporated Prussian blue nanoparticles (Gd@PBNPs) in which an active inner-sphere relaxation mechanism can be active due to the interactions between the zeolitic water molecules with the encaged Gd3+ ions. We have noted that nanoparticles of pure PB can function as an effective T1-weighed MR contrast agent, but the r1 relaxivity value of PBNPs is rather low (i.e. r1=0.2 mM−1×S−1 per Fe3+ ion), which renders these NPs insensitive as a cellular MR contrast agent for the GI tract imaging. On the other hand, partial replacement of Fe3+ ions in the pure PBNPs with Mn3+ ions causes the r2/r1 ratio to go beyond 10, making T1-weighted MR imaging acquisition using the Mn-doped PBNPs impossible. In light of the extremely high stability of PB in the acidic medium and the nontoxic nature of PB administered orally, we hypothesize that aqueous dispersions of Gd@PBNPs may be useful as an oral MRI contrast agent, thus fulfilling the unmet clinical need of contrast enhancement for the GI tract imaging. It should be noted that PB and its several analogues have recently attracted increasing research attention for their potential applications in MRI contrast enhancement, bio-molecular sensing and cancer research.21–27
2. EXPERIMETAL SECTION
2.1 Materials
HT-29 cells were purchased from the American Type Culture Collection (Rockville MD, USA) and preserved at −200 °C before use. Dulbecco’s Modified Eagle Medium (DMEM, M0643, Sigma-Aldrich, USA) supplemented with 10% fetal bovine serum, 2.2 g/L NaHCO3, 1 mM sodium pyruvate, 100 U/mL penicillin, 100 μg/mL streptomycin, 0.25 μg/mL amphotericin and 1% penicillin-streptomycin was used at 37 °C in an atmosphere of 5% CO2 was used for cell culture and all other cellular experiments.
Please note that experiments using live animals were performed in full compliance with the institutional guidelines and were approved by the institutional committee.
2.2 Synthesis of PEG-coated Gd@PBNPs and the bulk Gd@PB
We first synthesized the PVP-coated Gd@PBNPs and replaced the surface coating with PEG by a polymer displacement reaction. Specifically, an aqueous solution of FeCl3 and Gd(NO3)3 in the molar ratio of 0.98 to 0.02 (0.25 mM, 50 mL) was added to an aqueous solution of K4[Fe(CN)6] (0.25 mM and 50 mL) containing 2.5 grams of PVP. The as-synthesized PVP-coated NP solution was placed in a dialysis bag made of regenerated cellulose tubular membrane (MWCO=12000–14000) and soaked in distilled water overnight. During this time, the outside distilled water was changed several times. The dialysis bag was then transferred to a 250 mL beaker of distilled water containing 10 grams of polyethylene glycol (PEG, MW= 8000) and left in the solution for two days. The solid product was collected by lyophilization. The complete displacement of PVP by PEG was confirmed by IR spectroscopic measurements. The bulk Gd@PB was synthesized using the same procedure without the coating polymer PVP or PEG. The product was dialyzed for 8 hours and lyophilized to afford a crystalline powder with quantitative yield. Metal analysis on the bulk Gd@PB was performed as the following: a sample of 72 mg was calcined at 680 °C for 12 hours. The resultant metal oxides were dissolved in 10 mL concentered nitric acid. After diluted in a volumetric flask, the solution was analyzed by inductively coupled plasma optical emission spectroscopy (ICP-OES) using a Perkin-Elmer Optima 3200 system for potassium, gadolinium and iron. The elemental analysis results gave the empirical formula K0.94Gd0.02Fe[Fe(CN)6].
2.3 TEM imaging and EDX measurements
The PEG-coated Gd@PBNPs were characterized by TEM and EDX using a FEI Tecnai F20 transmission electron microscope (TEM) equipped with a field emission gun operating at 200 KV. Samples were first suspended in water, transferred as droplets onto a carbon-coated copper TEM grid (400-mesh), and dried in the air in a covered container. The energy dispersive X-ray (EDX) spectra were acquired with the integrated scanning TEM (STEM) unit attached with an EDAX spectrometer.
2.4 Surface conjugation of fluorescence dye to Gd@PBNPs
First, 45 μL of ethylenediamine solution (0.25 mM) was added to a 200-μL Gd@PBNP solution (250 μM) under vigorous stirring. The resulting reaction mixture was stirred for 24 hours. The product was dialyzed in distilled water overnight to remove the unbound ethylenediamine molecules. Scondly, 10 mL of carboxyfluorescene dye (0.5 mM) was allowed to react with 1.2 eq. of 1-ethyl-3-(3-dimethylaminopropyl)-carbodiimide (EDC) (1.15 mg) for 24 hours. Finally, the ethylenediamine-coated Gd@PBNPs were added to 100 μL of the above-mentioned dye solution and stirred for 24 hours. The resulting product was dialyzed again in distilled water for two days to remove the un-conjugated dye molecules. The final product was analyzed by fluorescence spectroscopy to confirm covalent attachment of the dye on the surface of nanoparticles.
2.5 Cell viability Assays
Cytotoxicity was evaluated using an MTT viability assay. Cells were first seeded in a 96-well plate at a density of 2 × 10⁴ cells/well with the DMEM low glucose medium and incubated for 5 hours at 37 °C in an incubator with an atmosphere consisting of 5% CO2 and 95% air. After cells were attached to the surface, they were treated with 100 μL of fresh medium supplemented with various amounts of NPs and incubated for another 12 hours or 24 hours. The cells were then incubated in media with 0.1 mg/mL of 3-[4,5-dimethylthialzol-2-yl]-2,5-diphenyltetrazolium bromide (i.e. the MTT dye) for 3 hours. After the MTT solution was removed, the precipitated violet dye crystals were dissolved in 200 μL of DMSO. The absorbance was measured using a microplate reader. The results were expressed as percent viable cells.
2.6 Cellular uptake of PEG-coated Gd@PBNPs
We used the confocal fluorescence microscopy technique to image cellular uptake of dye-labeled Gd@PBNPs. First, about 1.2× 10⁵ HT-29 cells/well were seeded in an 8-well chamber slide and incubated for 24 hours. Then, the culture medium was replaced with a medium containing dye-labeled nanoparticles at the concentration of ~150 uM. After 3 hours of incubation, cells were washed three times with PBS to remove free NPs. Fresh medium was finally added to the cells before imaging.
2.7 Stability of PEG-coated Gd@PBNPs against the leaching of Gd3+ and CN− ions
About 10 mL of PEG-coated Gd@PBNPs (10 mM) were sealed in a dialysis bag that as then submerged in 200 mL distilled water, or 200 mL 1% NaCl solution, or a HCl solution (pH=1). After incubated at 37 °C for two days, the dialysis bag was removed from the solution. The volume of the solution was then reduced to 10 mL. The CN− ions were measured semi-quantitatively using a Merk Co. cyanide test kit (EMD CO. 10044-1). In the meantime, the concentration of the released Gd3+ ions in each test solution were measured using the ICP technique.
2.8 T1 and T2 measurements
The longitudinal (T1) and transverse (T2) relaxation times of protons induced by PEG-coated Gd@PBNPs were measured using a Bruker minispec mq60 contrast agent analyzer at 1.4 T. Aqueous solutions containing PEG-coated Gd@PBNPs at different concentrations were prepared and transferred into NMR tubes. Both the T1 relaxation and T2 relaxation times of these solutions were measured at 37±0.1 °C. The r1 and r2 relaxivity values were then extracted from the slope of the linear plot of (1/Ti)obs (i=1,2) versus M3+ (M=Fe and Gd) concentration.
2.9. in vivo animal MRI imaging studies
The animal was anesthetized by intramuscular injection of midazolam. The anesthetized rabbit was placed on a heating pad all the time before the MRI study and then wrapped in a warm towel to maintain body temperature at 35 °C during MRI scanning. MRI contrast agents were administered by tubing at dose of 13.9 mL/kg or 138.9 mg NPs/kg body weight. The animal was then placed in a locally built small coil and scanned in a Siemens MAGNETOM® Avanto 1.5T MRI scanner at 0, 5, 15, 30, 60, and 90 minutes post-administration using a 3D FLASH sequence.
3. RESULTS AND DISCUSSION
3.1 Synthesis and characterization of both Gd@PBNPs and bulk Gd@PBN
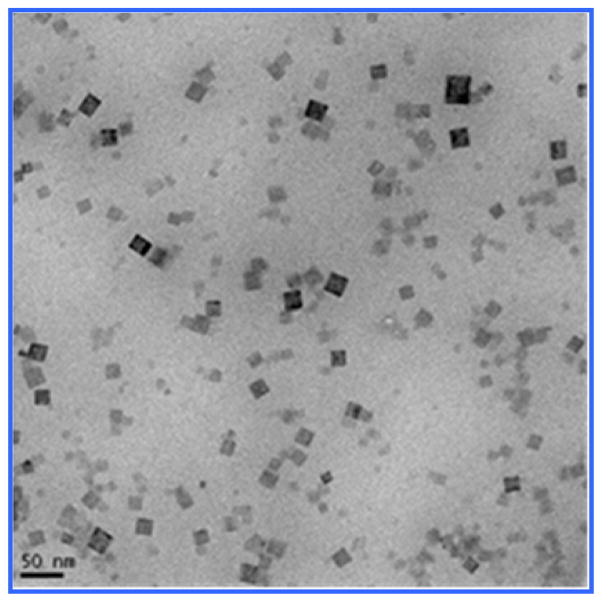
The synthesis of PEG-coated Gd@PBNPs was carried out with a simple two-step aqueous reaction that gave a quantitative yield based on the gadolinium nitrate used as described in the Experimental Section. For characterization purposes, the bulk sample of this material was also prepared using exactly the same procedure except that neither PVP nor PEG was used. In the absence of any surfce coating polymer, a precipitate was formed from the reaction. The solid obtained from this process was separated by centrifugation, washed with water three times and with acetone one time, and dried in vacuum. Transmission electron microscopic (TEM) studies revealed the Gd@PBNPs are cubic-shaped single crystallites with an average size of 24 ± 9 nm as shown in Figure 1. The particle size and size distribution for this specific batch of sample were obtained by measuring and averaging 85 NPs from the lower left quadrant of the frame. The energy-dispersive X-ray spectroscopy (EDS) analysis on individual NPs clearly showed the presence of Gd, Fe, K, C and N with the relative peak intensity for each of these elements showing hardly any change from different selected areas of the same particle or from different particles, suggesting that gadolinium is uniformly incorporated into the crystal lattice of the material rather than absorbed on the outer surfaces or inner pores of the material. The metal analysis on the bulk sample by inductively coupled plasma (ICP) spectroscopy showed that this material to have the formula K1-3xGdxFe[Fe(CN)6] with x 0.02, while its X-ray powder diffraction (XRD) patterns revealed a single phase that can be readily indexed to that of pure Prussian blue (see Figure 2). We therefore conclude that the Gd3+ ion (r=1.07 Å) occupies the same crystallographic positions with the K+ ion (r=1.33 Å) in the crystal lattice of this material.
Figure 1.
TEM image of as-prepared Gd@PBNPs
Figure 2.
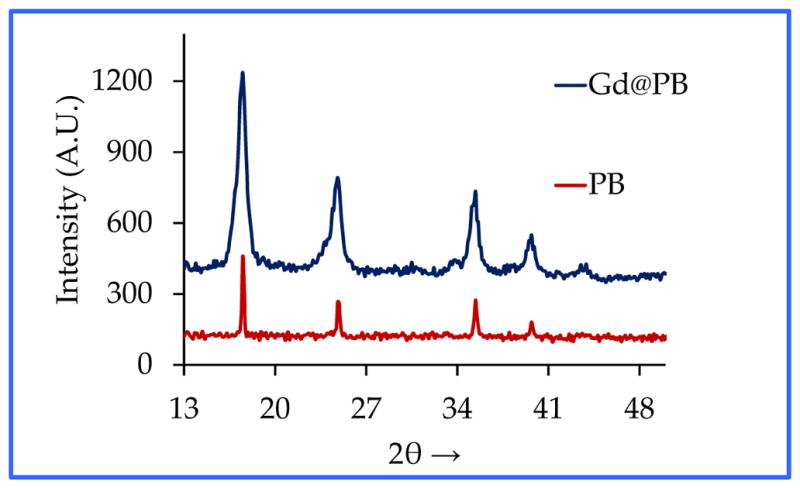
XRD patterns of the bulk Gd@PB in comparison with those of Prussian blue
Fourier transform infrared (FT-IR) spectra of both the bulk sample and PEG-coated Gd@PBNPs exhibited a strong characteristic CαN stretching vibration at 2075 cm−1, which is attributable to the Fe(II)-CαN-Fe(III) bonding mode in pure Prussian blue. Additionally, the IR spectra of Gd@PBNPs contain essentially the same spectroscopic features of PEG as shown in Figure 3. Since the sample was thoroughly dialyzed in distilled water before the IR spectroscopic studies, we conclude that such NPs are surface-coated with PEG layers, which is also consistent with the fact that these PEG-coated Gd@PBNPs are highly dispersible in water (i.e. ~0.23 mole per liter of water based on iron concentration) and stable against aggregation for more than six months.
Figure 3.
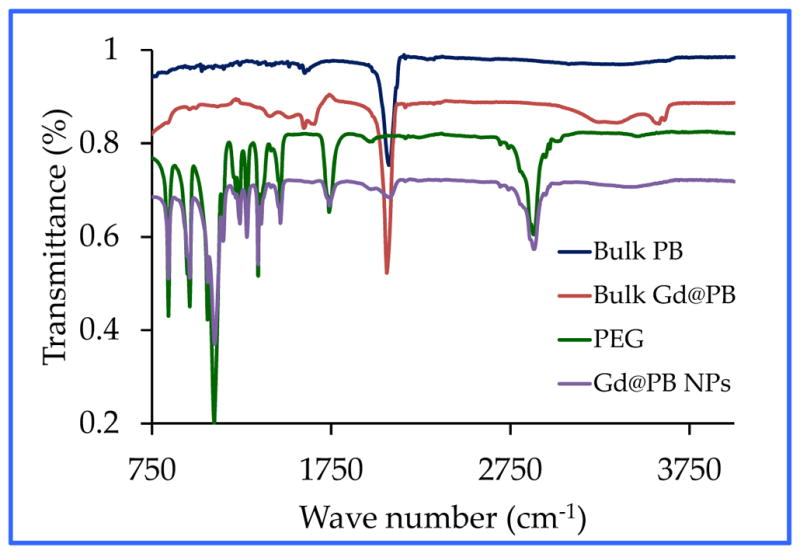
FT-IR spectra of PEG-coated Gd@PBNPs in comparison with those of the bulk PB, bulk Gd@PB and PEG
3.2 Proton relaxivity measurements of Gd@PBNPs
In order to evaluate the efficiency of the PEG-coated Gd@PBNPs as an MRI contrast agent we measured both longitudinal (i.e. T1) and transverse (i.e. T2) proton relaxivities in aqueous solution. The r1 and r2 values, expressed on a per M3+-ion basis (i.e. the total paramagnetic species M=Fe(III) + Gd(III) in the structure), extracted from the measurements carried out at the magnetic field of 1.4 Tesla using a Bruker MiniSpec relaxometer are r1= 16.4 mM−1×s−1 and r2=20.9 mM−1×s−1 (see Figure 4).28 In addition, the low ratio of r2/r1 = 1.27 ensures that the PEG-coated Gd@PBNPs can be used as an effective and reliable T1 contrast agent.29–30 The latter notion was further confirmed by our in vivo MRI imaging studies of the GI tract in a domestic rabbit (vid infra). These results would readily place the current Gd@PBNP system above all the known oral contrast agents such as LumenHance® and Magnevist Enteral® in terms of the r1 relaxivity. It should be noted that Magnevist Enteral®, the contrast agent with the highest r1 relaxivity among these three has an r1 value of 3.4 mM−1×s−1 at the magnetic field strength of 1.4 T.
Figure 4.
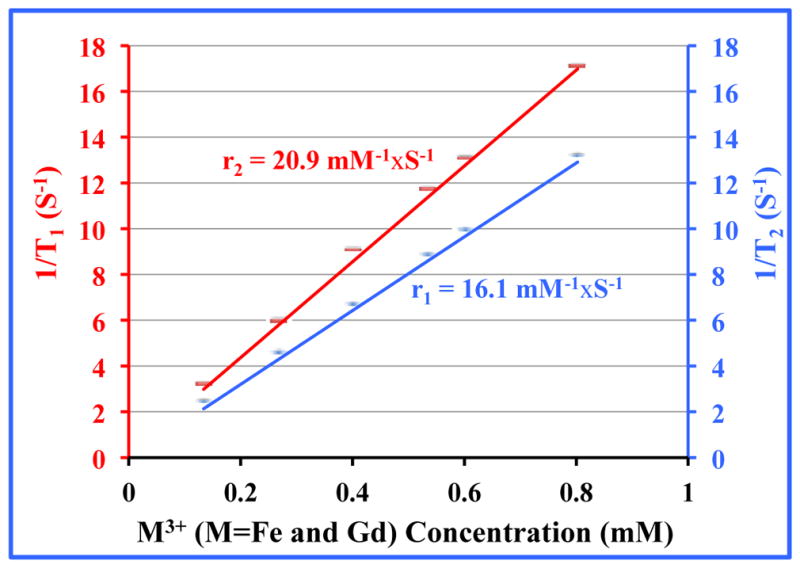
Plots of 1/Ti (i=1,2) versus M3+-concentration at 1.4 T for PEG-coated Gd@PBNPs
3.3 Stability of Gd@PBNPs against the leaching of Gd3+ and CN− ions
We studied the release of Gd3+ and CN− ions from PEG-coated Gd@PBNPs under various physiologically relevant conditions including distilled water, saline solution, and 0.1 M HCl as the simulated gastric juice (pH=1.0) under the pseudo-equilibrium conditions, i.e. the Gd@PBNPs sealed in a dialysis bag were equilibrated with these media for over 24 hours. As shown in Figure 5, the highest Gd3+ concentration released from the nanoparticles was found to be 9.0±8 ppm. The minute amount of Gd3+ ions released from the NPs to aqueous solution is the testimony that the metal ions (K+, Gd3+, Fe3+ and Fe2+) in this compound with the cubic structure are completely locked in their respective crystallographic positions and cannot be readily dissociated in solution due to the extremely low solubility-product constant. Given the fact that the oral LD50 in rats for gadolinium nitrate is 300 mg/kg, corresponding to 105 mg Gd/kg, the release of Gd3+ ions in gastric juice will not be a safety concern.31 On the other hand, the highest CN− concentration detected after 24-hour incubation in these media was below ~1±1 ppm. This level of cyanide is comparable to that allowed in the drinking water set by the US Environmental Protection Agency (EPA).32 Free cyanide ions occur naturally in water due to the release from certain plants and fruit seeds.33 Intake of cyanide at this level by humans or animals is not harmful because the mitochondrial enzyme, Rhodanese can rapidly convert it into thiocyanate. It is worth pointing out that the toxicity of Gd@PBNPs is so low that we have been unable to determine the oral lethal dosage (LD50) in lab mice.
Figure 5.
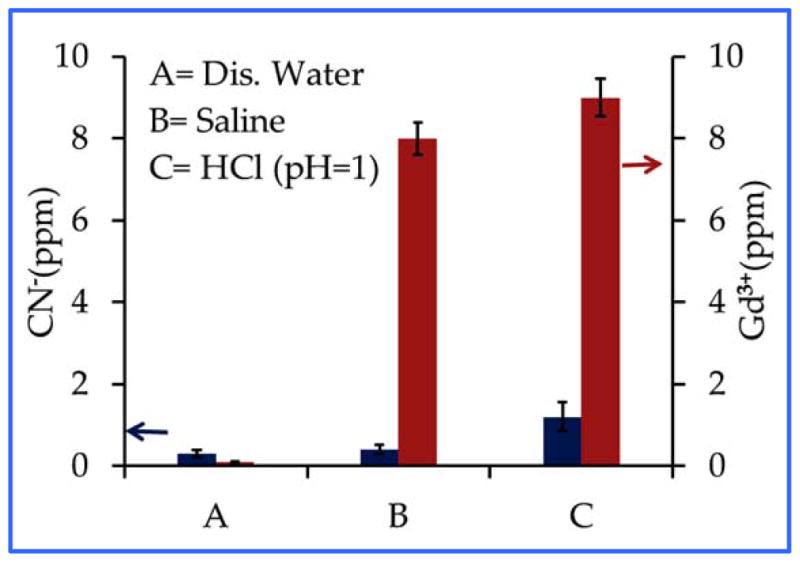
The release of Gd3+(red) and CN− (blue) ions from Gd@PBNPs into different media
3.4 Cellular uptake and cytotoxicity of Gd@PBNPs
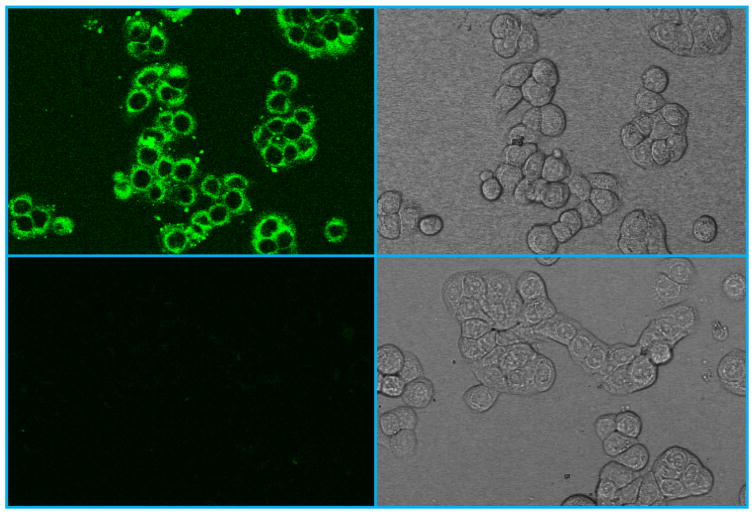
The ability to penetrate the cell membrane is a crucial pre-requisite for developing such NPs as a cellular MR probe for early cancer detection in the GI system. Therefore, we used the fluorescent confocal microscopic imaging technique to visualize the cellular uptake of the NPs in HT-29 cells. The latter are human colorectal adenocarcinoma cells commonly used as an in vitro model of intestinal cancers. Colorectal cancer is the most malignant disease in the GI tract. It is the second most common cause of cancer in women, and the third most common cause of cancer in men worldwide. For live cell imaging, HT-29 cells were first incubated with the carboxyfluorescein (CbF) dye-labeled Gd@PBNPs, washed with PBS and then directly imaged without fixation. Note that the CbF dye molecule itself is membrane impermeable due to its high anionic charge and poor water solubility.34 Figure 6 shows the typical confocal fluorescent images of HT-29 cells treated with the dye-labeled Gd@PBNPs in comparison with the fluorescent images of control cells. The uniform fluorescent emission in the perinuclear region of the cells treated with dye-labeled Gd@PBNPs suggests an untargeted cytoplasmic distribution of NPs inside the cell with no specific binding to any small organelle in the region, indicating that cellular uptake occurs through endocytosis. On the other hand, the fluorescent signals from the nuclei are very weak, suggesting that the nuclear uptake of the NPs is negligible.
Figure 6.
Confocal microscopic images of HT-29 cells: (upper left) fluorescence image of cells incubated with dye-conjugated NPs for 3 hours; (upper right) bright field image of cells incubated with dye-conjugated NPs for 3 hours; (lower left) florescence image of the untreated cells; (lower right) bright field image of the untreated cells
To assess the cytotoxicity, we performed cell viability assays in HT-29 cells using MTT method. The cells were incubated for 12 hours or 24 hours at 37 °C under 5% CO2 with varying concentrations of Gd@PBNPs suspended in PBS and Dulbecco’s Modified Eagle Medium (DMEM). Three independent trials were conducted, and the averages and standard deviations were reported. The reported percent cell survival values are relative to the control cells. Figure 7 shows the viability of HT-29 cells treated with Gd@PBNPs. The results clearly indicate that the NPs are nontoxic to cells. More than 96% of the cells were viable after incubation with the NPs at the concentration of 0.5 mM Fe3+ ion (or 0.01 mM Gd3+ ion) for 24 hours.
Figure 7.
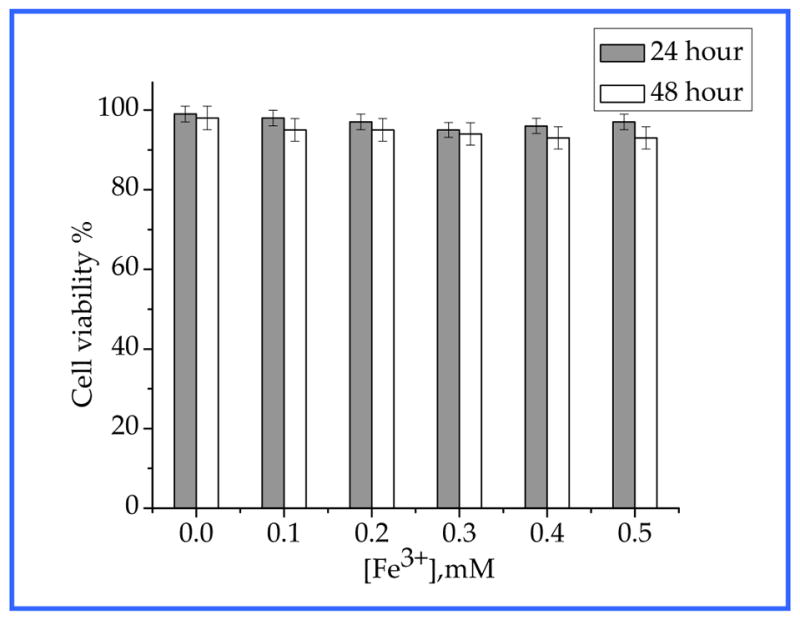
Effect of Gd@PBNPs on viability of HT-29 cells after 12-hour and 24-hour incubation.
3.6 in vivo MR imaging studies of the GI tract using Gd@PBNPs
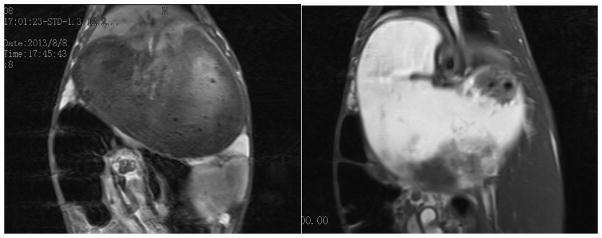
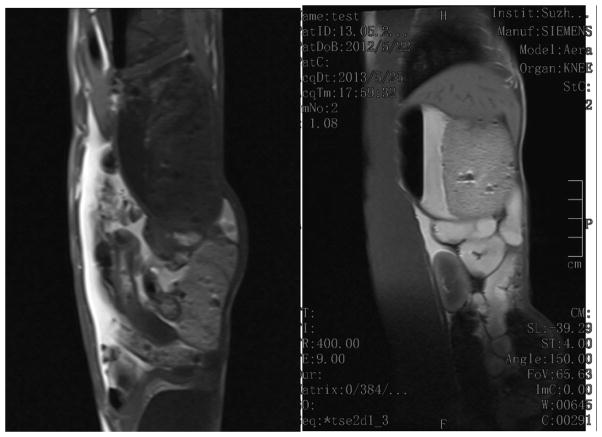
We carried out preliminary in vivo MRI imaging studies of the GI tract in a domestic rabbit. The imaging was performed on a Siemens MAGNETOM® Avanto 1.5T clinical whole-body system using a locally built small flexible receiver coil. A male rabbit weighing 2.6 kg was sedated by intramuscular injection of midazolam, followed by the introduction of 50 mL solution of PEG-coated Gd@PBNPs (10 mg/mL) into the stomach via tabulation. The animal was restrained and the receiver coil was fastened outside the restraining device. For the detection of Gd@PBNP enhancement a standard multislice T1-weighted spin echo (SE) sequence was used. Approximately 5 minutes after the oral administration of the PEG-coated Gd@PBNP suspension, a clear T1-weighted signal enhancement was detected in the stomach of the animal (see Figure 8). The increased positive MRI signal in the stomach remained stable for 60 minutes. before it began to gradually decline to the background level in ca. 90 minutes. The T1-weighted signal enhancement in the abdomen could be seen approximately 30 minutes after the oral administration, signifying the passing of Gd@PBNPs into the lower digestive tract (see Figure 9). The positive MRI signal in the abdomen remained visible even after 90 minutes, albeit the intensity was reduced.
Figure 8.
T1-weighted images of the stomach taken using saline solution as the negative control (left) and 5 minutes after the oral administration of the PEG-coated Gd@PBNP suspension (right), showing a significant enhancement of the positive contrast (i.e. T1-weighted) of MRI signals in the stomach
Figure 9.
T1-weighted images of the abdomen taken using saline solution as the negative control (left) and 30 minutes after the oral administration of the PEG-coated Gd@PBNP suspension (right), showing an unequivocal enhancement of the positive contrast (i.e. T1-weighted) of MRI signals in the abdomen
4. CONCLUSION
In summary, we have developed a novel nanoplatform to deliver gadolinium as an effective oral MRI contrast agent with extreme stability in acidic environment. The other two important features that are desirable for oral administration and the GI tract imaging using the Gd@PBNPs include high r1 relaxivity (i.e. high sensitivity) and excellent temporal stability with the characteristics of contrast enhancement remaining almost unchanged when passing throughout the GI tract. Up until now, the three commonly used oral contrast agents, i.e. AFC, LumenHance® and Magnevist Enteral®, all have modest relaxivity values, and poor temporal stability when administered to the GI tract, in addition to their lack of the ability to penetrate the cell membrane in order to function as a cellular MRI probe. Given our findings that the current MRI contrast agent based on the Gd@PBNPs has very high r1 relaxivity, and can readily enter the cell, it is temping to conjecture that gadolinium-incorporated Prussian blue offers a unique opportunity to develop a sensitive cellular MRI probe for early cancer detection in the GI tract. Research on the use of such nanoparticles in animal models with orthotropic xenograft tumors is currently under way at this lab.
Supplementary Material
Acknowledgments
This research is supported by the NIH-NCI grant 1R21CA143408-01A1. The TEM data reported in this work were obtained using the Cryo TEM Facility at Liquid Crystal Institute, KSU that is supported by the Ohio Research Scholars Program.
NOTES AND REFERENCES
- 1.Paley MR, Ros PR. Eur Radio. 1997;7:1387–1397. doi: 10.1007/s003300050306. [DOI] [PubMed] [Google Scholar]
- 2.Zhu J, Xu J-R, Gong H-X. World J Gastroenterol. 2008;14:3403–3409. doi: 10.3748/wjg.14.3403. [DOI] [PMC free article] [PubMed] [Google Scholar]
- 3.Debatin JF, Patak MA. Eur Radiol. 1999;9:1523–1534. doi: 10.1007/s003300050878. [DOI] [PubMed] [Google Scholar]
- 4.Patak MA, Weishaupt D, Frohlich JM. J Magn Reson Imaging. 1999;10:474–476. doi: 10.1002/(sici)1522-2586(199909)10:3<474::aid-jmri32>3.0.co;2-q. [DOI] [PubMed] [Google Scholar]
- 5.Bilincen D, Scheffler K, Seifritz E. Abdom Imaging. 2000;25:30–34. doi: 10.1007/s002619910005. [DOI] [PubMed] [Google Scholar]
- 6.Giovagnoni A, Fabbri A, Maccioni F. Abdom Imaging. 2002;27:367–375. doi: 10.1007/s00261-001-0117-5. [DOI] [PubMed] [Google Scholar]
- 7.Tammo H, Rijcken P, Davis MA. J Magn Reson Imaging. 1994;4:291–300. doi: 10.1002/jmri.1880040312. [DOI] [PubMed] [Google Scholar]
- 8.Wan X, Wedeking P, Tweedle MF. J Magn Reson Imaging. 1995;13:215–218. doi: 10.1016/0730-725x(94)00098-n. [DOI] [PubMed] [Google Scholar]
- 9.Kraus BH, Rappaport DC, Ros PR. J Magn Reson Imaging. 1994;12:847–858. doi: 10.1016/0730-725x(94)92025-7. [DOI] [PubMed] [Google Scholar]
- 10.Malcolm PN, Brown JJ, Hahn PF. J Magn Reson Imaging. 2000;12:702–707. doi: 10.1002/1522-2586(200011)12:5<702::aid-jmri6>3.0.co;2-p. [DOI] [PubMed] [Google Scholar]
- 11.Small WC, DeSimone-Macchi D, Parker JR. J Magn Reson Imaging. 1999;10:15–24. doi: 10.1002/(sici)1522-2586(199907)10:1<15::aid-jmri3>3.0.co;2-x. [DOI] [PubMed] [Google Scholar]
- 12.Bernardino ME, Weinreb JC, Mitchell DG. J Magn Reson Imaging. 1994;4:872–876. doi: 10.1002/jmri.1880040620. [DOI] [PubMed] [Google Scholar]
- 13.Kaminsky S, Laniado M, Gogoll M. Radiology. 1991;178:503–508. doi: 10.1148/radiology.178.2.1987615. [DOI] [PubMed] [Google Scholar]
- 14.Mattrey RF, Trambert MA, Brown JJ. Radiology. 1994;191:841–848. doi: 10.1148/radiology.191.3.8184076. [DOI] [PubMed] [Google Scholar]
- 15.Lonnemark M, Hemmingson A, Bach-Gansmo T. Acta Radiol. 1989;30:193–196. [PubMed] [Google Scholar]
- 16.Hahn DF, Stark DD, Lewis JM. Radiology. 1990;175:695–700. doi: 10.1148/radiology.175.3.2343116. [DOI] [PubMed] [Google Scholar]
- 17.Oksendal AN, Jacobsen TF, Gundersen HG. Invest Radiol. 1991;26:S67–S70. doi: 10.1097/00004424-199111001-00022. [DOI] [PubMed] [Google Scholar]
- 18.Na HB, Lee JH, An K, Park Y, Park M, Lee IS, Nam DH, Kim ST, Kim SH, Kim SW, Lim KH, Kim KS, Kim SO, Hyeon T. Angew Chem, Int Ed. 2007;46:5397–5401. doi: 10.1002/anie.200604775. [DOI] [PubMed] [Google Scholar]
- 19.Shokouhimehr M, Soehnlen ES, Khitrin A, Basu S, Huang SD. Inorg Chem Commun. 2010;13:58–61. [Google Scholar]
- 20.Shokouhimehr M, Soehnlen ES, Hao H, Griswold M, Flask C, Fan XD, Basilion JP, Basu S, Huang SD. J Mater Chem. 2010;20:5251–5259. [Google Scholar]
- 21.Chelebaeva E, Larionova J, Guari Y, Ferreira RAS, Carlos LD, Trifonov AA, Kalaivani T, Lascialfari A, Guérin Ch, Molvinger K, Datas L, Maynadier M, Gary-Bobo M, Garcia M. Nanoscale. 2011;3:1200–1210. doi: 10.1039/c0nr00709a. [DOI] [PubMed] [Google Scholar]
- 22.Fu G, Liu W, Feng S, Yue X. Chem Comm. 2012;48:11567–11569. doi: 10.1039/c2cc36456e. [DOI] [PubMed] [Google Scholar]
- 23.Lian HY, Hu M, Liu CH, Yamauchi Y, Wu KCW. Chem Comm. 2012;48:5151–5153. doi: 10.1039/c2cc31708g. [DOI] [PubMed] [Google Scholar]
- 24.Perrier M, Kenouche S, Long J, Thangavel K, Larionova J, Goze-Bac C, Lascialfari A, Mariani M, Baril N, Guerin C, Donnadieu B, Trifonov A, Guari Y. Inorg Chem. 2013;52:13402–13414. doi: 10.1021/ic401710j. [DOI] [PubMed] [Google Scholar]
- 25.Liang X, Deng Z, Jing L, Li X, Dai Z, Li C, Huang M. Chem Comm. 2013;49:11029–11031. doi: 10.1039/c3cc42510j. [DOI] [PubMed] [Google Scholar]
- 26.Paul G, Prado Y, Dia N, Riviere E, Laurent S, Roch M, Elst LV, Muller RN, Sancey L, Perriat P, Tillement O, Mallaha T, Catala L. Chem Comm. 2014;50:6740–6743. doi: 10.1039/c4cc01251h. [DOI] [PubMed] [Google Scholar]
- 27.Dumont MF, Hoffman HA, Yoon PRS, Conklin LS, Saha SR, Paglione J, Sze RW, Fernandes R. Bioconjugate Chem. 2014;25:129–137. doi: 10.1021/bc4004266. [DOI] [PubMed] [Google Scholar]
- 28.Koenig SH, Brown RD. Prog NMR Spectrosc. 1990;22:487–567. [Google Scholar]
- 29.Hifumi H, Yamaoka S, Tanimoto A, Citterio D, Suzuki K. J Am Chem Soc. 2006;128:15090–15091. doi: 10.1021/ja066442d. [DOI] [PubMed] [Google Scholar]
- 30.Weissleder R, Elizondo G, Wittenberg J, Rabito CA, Bengele HH, Josephson L. Radiology. 1990;175:489–493. doi: 10.1148/radiology.175.2.2326474. [DOI] [PubMed] [Google Scholar]
- 31.Bruce DW, Hietbrink BE, DuBois KP. Toxicol Appl Pharm. 1963;5:750–759. doi: 10.1016/0041-008x(63)90067-x. [DOI] [PubMed] [Google Scholar]
- 32. [last accessed on September 9, 2015]; See http://water.epa.gov/drink/contaminants/index.cfm#List.
- 33.Vetter J. Toxicon. 2000;38:11–36. doi: 10.1016/s0041-0101(99)00128-2. [DOI] [PubMed] [Google Scholar]
- 34.Pangburn TO, Georgiou K, Bates FS, Kokkoli E. Langmuir. 2012;28:12816–12830. doi: 10.1021/la300874z. [DOI] [PubMed] [Google Scholar]
Associated Data
This section collects any data citations, data availability statements, or supplementary materials included in this article.


