Abstract
The 5-year survival rate for pancreatic ductal adenocarcinoma (PDAC) remains dismal despite current chemotherapeutic agents and inhibitors of molecular targets. As the incidence of PDAC constantly increases, more effective multidrug approaches must be made. Here, we report a novel method of delivering antitumorigenic therapy in PDAC by upregulating the transcriptional factor CCAAT/enhancer-binding protein-α (C/EBPα), recognized for its antiproliferative effects. Small activating RNA (saRNA) duplexes designed to increase C/EBPα expression were linked onto PDAC-specific 2′-Fluropyrimidine RNA aptamers (2′F-RNA) - P19 and P1 for construction of a cell type–specific delivery vehicle. Both P19- and P1-C/EBPα-saRNA conjugates increased expression of C/EBPα and significantly suppressed cell proliferation. Tail vein injection of the saRNA/aptamer conjugates in PANC-1 and in gemcitabine-resistant AsPC-1 mouse-xenografts led to reduced tumor size with no observed toxicity. To exploit the specificity of the P19/P1 aptamers for PDAC cells, we also assessed if conjugation with Cy3 would allow it to be used as a diagnostic tool on archival human pancreatic duodenectomy tissue sections. Scoring pattern from 72 patients suggested a positive correlation between high fluorescent signal in the high mortality patient groups. We propose a novel aptamer-based strategy for delivery of targeted molecular therapy in advanced PDAC where current modalities fail.
Introduction
Pancreatic ductal adenocarcinoma (PDAC) is the fourth most common cause of cancer death in the United States, accounting for 30,000 deaths annually.1 Despite great efforts to improve treatment for patients with pancreatic cancer, limited progress has been made.2,3 The majority of patients present with either local or systemic recurrence within 2 years following resection and postoperative adjuvant chemotherapy.4,5,6 Despite numerous new drugs entering phase 3 trials, gemcitabine, as a single agent administered postoperatively, remains the current standard of care. However, gemcitabine only improves the 1-year survival rate from 16% to 19%. Combinations of gemcitabine with other chemotherapeutic drugs or biological agents for unresectable pancreatic cancer, or adjuvant treatment following resection, have resulted in limited improvement; the 5-year survival of patients with pancreatic cancer remains less than 5%.4,5,6,7,8,9,10 This limitation of conventional treatment is most likely due to the fast development of chemoresistance displayed by PDAC cells.11,12 Therefore, there remains a strong need for improved systemic therapies for pancreatic cancer.
V-Ki-ras2 Kirsten rat sarcoma viral oncogene homolog (KRAS) has been recognized as an important therapeutic target in PDAC. However, despite the crucial role of KRAS and its mutated forms in PDAC, the clinical outcome of KRAS-directed therapies has not been successful, and KRAS is now assumed to be an undruggable target.13 This suggests that there are other mechanisms underlying PDAC progression that are independent of KRAS mutations. The recent correlation between oncogenic KRAS-induced senescence, mediated by the tumor suppressor lysine-specific demethylase 6B (KDM6B) in PDAC, and inhibition of tumor cell sphere formation by forced expression of CCAAT/enhancer-binding protein-α (C/EBPα), suggests that C/EBPα plays an important role in PDAC.14 In this study, we upregulate C/EBPα expression using a small activating RNA (saRNA) linked with aptamer molecules that were directed toward a PDAC-specific epitope.
RNA activation (RNAa or saRNA) is recognized as a novel strategy for nonintegrative gene activation in mammalian cells by short 21-mer nucleotide duplexes.15,16 Targeted increase in transcription is known to occur through an Argonaute-2-mediated mechanism and recognition of key promoter regions by the saRNAs to the target genes.15,16 SaRNAs targeting C/EBPα in vivo has previously shown to induce a potent antitumor effect in hepatocellular carcinoma through positive regulation of C/EBPα and its downstream targets including cyclin-dependent kinase inhibitor 1 (p21). Increased levels of these targets significantly reduced tumor growth, and now, more evidence of antitumor effects through activation of p21 and E-cadherin has been observed in breast and lung carcinoma.17,18 This demonstrates that strategic choice of gene activation particularly by saRNAs can be exploited to assist in conventional antitumor therapy. Since reduced expression of C/EBPα is recognized in pancreatic intraepithelial neoplasms14; 2′-Fluropyrimidine RNA (2′F-RNA) PDAC-specific aptamer molecules were used as a novel vehicle to deliver C/EBPα saRNA into PDAC cells for activation of C/EBPα expression. These small, structured, single-stranded RNA aptamers are powerful tools for targeting cell surface motifs and show great promise for clinical therapy. The tertiary structure of these nucleotide-based molecules allows for specific epitope recognition and cell internalization, making them the chemical equivalent of antibodies to deliver a therapeutic “payload” into target cells.
Cancer cell-specific aptamers were identified using the Systematic Evolution of Ligands by EXponential enrichment (SELEX) selection strategy.19,20 Aptamers can be selected to recognize a wide variety of targets, from small molecules to proteins and nucleic acids, and have been used in cultured cells and ex vivo organ cultures.21,22,23,24,25,26 RNA aptamers hold their three-dimensional structures by means of well-defined set of complementary nucleic acid sequences which allows the chain to fold back into its natural conformation following denaturation. Therefore, aptamers are able to maintain their structural conformation even when exposed to physiologically harsh reducing conditions.27 As a potential molecular vehicle for therapeutic delivery, RNA aptamers offer significant advantages over antibodies as they show better structural stability, lower toxicity, and lower immunogenicity.27
In this study, we employed a 2′F-RNA combinatorial library and isolated 2′F RNA aptamers (P19 and P1) through a whole cell-based SELEX for PDAC-targeted delivery. We linked both P19 and P1 aptamers to C/EBPα-saRNAs as a novel strategy to re-activate its epigenetically silenced target in PDAC. The antitumor effects of P19 or P1-C/EBPα-saRNA were assessed in vitro and in vivo using human pancreatic adenocarcinoma (PANC-1) and gemcitabine resistant AsPC-1 cell xenograft mouse models. Our findings demonstrate an efficient uptake of the saRNA-linked aptamers within PANC-1 cells comparable to lipid-mediated transient transfection methods. A strong antiproliferative effect, possibly through mediation of p21 was seen in the cell lines. The xenograft models when treated with the aptamer-saRNA constructs also demonstrated a significant reduction in tumor burden. Biodistribution studies also showed effective localization of the P19/P1 aptamer to the tumor nodule following intravenous delivery. This study heralds a novel approach for site-directed targeting of gene activation using nucleotide-based molecules with strong affinity to cancer-specific cell surface epitopes.
Results
SELEX-screened aptamers identify cancer-specific cell surface epitopes
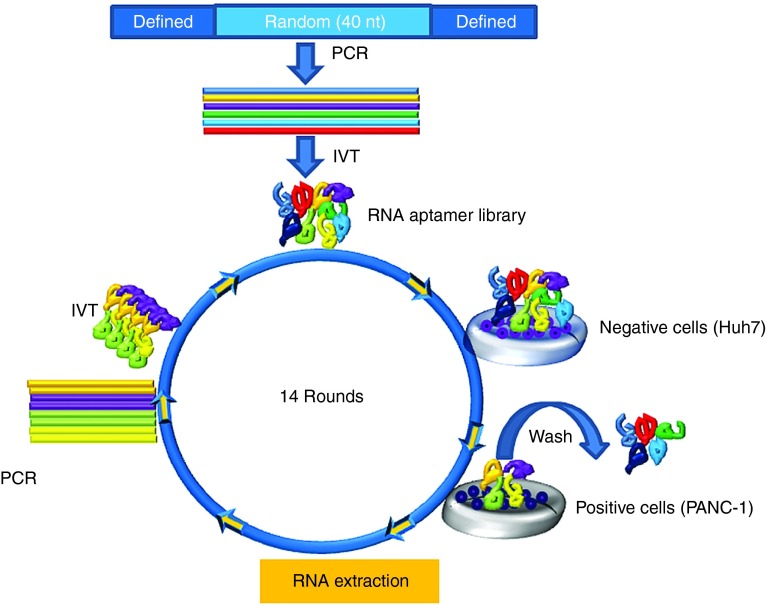
The human pancreatic adenocarcinoma, PANC-1, cells were used as target cells for the aptamer selection. To remove background/irrelevant binding and select pancreatic cancer–specific aptamers, the hepatocellular carcinoma cell line (Huh7) was used for the counter-selection step. A library of 2′F RNAs was used to increase nuclease resistance and enhance aptamer folding. To isolate 2′F RNA aptamers binding to intact cells, a library containing a 40-nt-long random sequence flanked by defined sequences was screened by SELEX (Figure 1). After 14 cycles of selection, a highly enriched aptamer pool was then cloned. Detailed selection conditions are summarized in Supplementary Table S1.
Figure 1.
Naive whole cell-based SELEX. Schematic live-cell SELEX procedures. The DNA library contained 40 nt of random sequences was synthesized and amplified by PCR. 2′F modified RNA aptamer library was synthesized throughout in vitro transcription. To identify the enriched RNA aptamers that bind to target cells, the RNA aptamer library pool was incubated on the negative cells. After removal of nonspecific binding to the negative cells, the supernatant was incubated on the positive cells for positive selection. Total RNA was extracted and amplified through polymerase chain reaction (PCR) and in vitro transcription (IVT). The RNA aptamer selection was repeated for 14 rounds of SELEX. The enriched pools were cloned, and the positive clones were sequenced to identify individual RNA aptamers.
For comparison of individual sequences and structures, two different groups of aptamers were selected (Table 1). P19 and P1 showed multistem loops and structural similarity, including a common motif: GAAUGCCC.
Table 1. The alignment and identification of RNA aptamers.

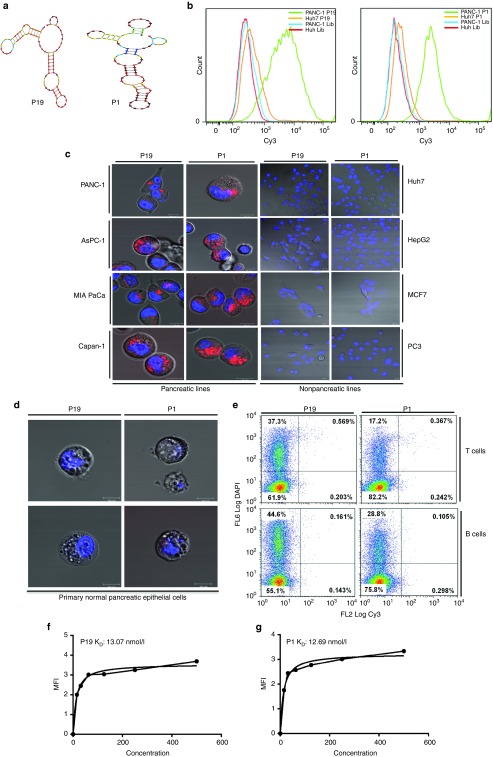
A minimum energy structural analysis of the selected aptamers was carried out using NUPACK software. As depicted, (Figure 2a), the calculated secondary structures of the RNA aptamers P19 and P1 contained several stem-loop regions.
Figure 2.
Aptamer secondary structure and cancer cell–specific internalization. (a) The secondary structures of P19 and P1, selected from randomized N40 RNA libraries, were predicted using the Mfold software. (b) Cy3-labeled P19 and P1 aptamers were assessed for binding efficiency by flow cytometry in PANC-1 and control Huh7 cells. The data show the measurements of positively stained cells and representative of triplicates. (c) The pancreatic cell lines PANC-1, AsPC-1, MIA PaCa, and Capan-1 were treated with 100 nmol/l of the Cy3-labeled P19 and P1 aptamer and analyzed by confocal microscopy. All of the pancreatic lines showed punctate regions of Cy3 labeling. Nonpancreatic lines including Huh7, HepG2, MCF7, and PC3 cells were also treated with 100 nmol/l of Cy3-labeled P19 and P1 aptamers. No Cy3 signal was observed. Blue: Hoechst 33342. Bar = 10 µm. (d) Normal primary pancreatic cells were treated with 100 nmol/l Cy3-labeled aptamers and imaged by confocal microscopy. Blue: Hoechst 33342. Bar = 10 µm. (e) Flow cytometry analysis of normal T and B cells treated with Cy3-labeled P19 and P1 aptamers. (f and g) The dissociation constant (KD) was measured by flow cytometry using increasing concentrations of Cy3-labeled aptamers (from 15.6 to 500 nmol/l). Mean fluorescence intensity was measured and calculated using a one-site binding model for nonlinear regression.
RNA aptamers P19 and P1 show efficient cell internalization
Flow cytometry analyses of the individual enriched aptamer clones, compared to the initial RNA library, confirmed enriched cell surface binding to the PANC-1 cells (Figure 2b). No binding was observed on PANC-1 and Huh7 cells treated with Cy3-aptamers from the initial RNA library (Supplementary Figure S1). To verify the specificity of the enriched aptamers to pancreatic cancer cells, a panel of five different pancreatic cancer cell lines AsPC-1, MIA PaCa, Capan-1 (Figure 2c, left panel) and CFPAC-1 and BxPC3 (Supplementary Figure S2) were treated with Cy3-labelled P19 and P1 aptamers. Nonpancreatic cancer lines including Huh7, HepG2, MCF7, and PC3 (Figure 2c, right panel) did not show internalization of the Cy3-labeled aptamers. To determine whether P19 or P1 were ubiquitously internalized irrespective of the status of the pancreatic cells, we incubated primary pancreatic epithelial cells dissociated from normal human pancreatic tissue with the Cy3-labeled aptamers. No Cy3 staining was detected in these noncancerous cells (Figure 2d). No staining was observed when normal T cells and B cells were incubated with the Cy3-labeled aptamers (Figure 2e). The binding affinities of P19 and P1 aptamers were quantified to 13.07 and 12.69 nmol/l, respectively (Figure 2f,g).
C/EBPα-conjugated P19 and P1 demonstrate strong anti-proliferation in cultured cells
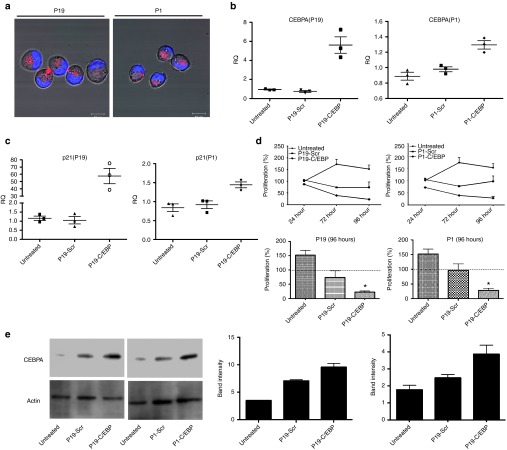
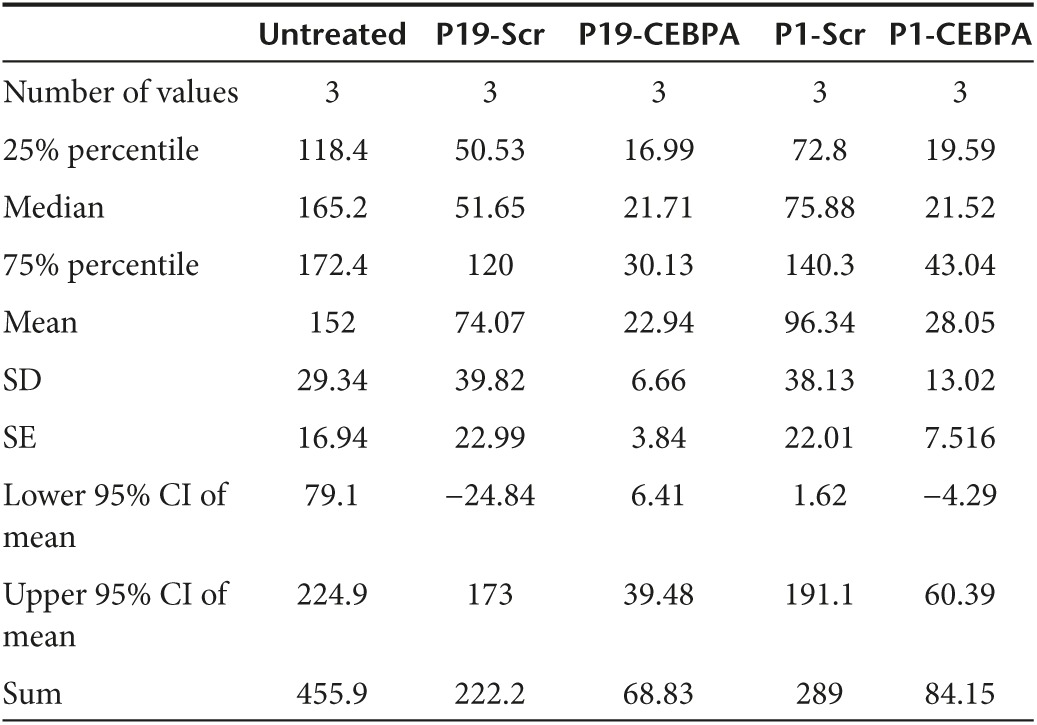
Since downregulation of C/EBPα has been previously reported to result in the formation of pancreatic intraepithelial neoplasms,14 we designed a conjugated P19 and P1 aptamer with C/EBPα-saRNA to exploit targeted delivery of the saRNA into pancreatic cancer cells for activation of C/EBPα. In order to maintain functional integrity of the molecule we placed “sticky sequences” (a sequence of 16 nucleotides that prevent structural hindrance) between the P19/P1 aptamer and either C/EBPα or a scrambled saRNA oligonucleotide (Supplementary Table S2). The P19 and P1 conjugates showed successful PANC-1 internalization (Figure 3a). To investigate gene activation in vitro, the P19 and P1 conjugated C/EBPα-saRNA or scrambled RNAs were added to PANC-1 cell culture media in the absence of any transfection reagent. Cells treated with the conjugated C/EBPα-saRNA aptamers showed significantly higher levels of C/EBPα mRNA (Figure 3b) and its downstream target, p21 (Figure 3c) when compared to a scrambled-saRNA. The P19-C/EBPα-saRNA construct induced a 5-fold increase in C/EBPα transcript (P = 0.029) and a 50-fold increase in p21 transcript level ((P = 0.03), two-tailed t-test with Welch's correction at 95% confidence interval; Table 2). P1-C/EBPα-saRNA construct induced a 1.3-fold increase in C/EBPα transcript (P = 0.01) and a 1.4-fold increase in p21 transcript level ((P = 0.026), two-tailed t-test with Welch's correction at 95% confidence interval; Table 2). Since C/EBPα is known to stabilize the cyclin-dependent kinase inhibitor (p21) to elevate expression levels and block cyclin-dependent kinases for cell cycle arrest,28 we performed a WST-1 cell proliferation assay on PANC-1 cells treated with the conjugated aptamers for 96 hours. We observed more than 80% reduction in cell proliferation following treatment with either P19- C/EBPα-saRNA (Figure 3d, left panel) or P1-C/EBPα-saRNA (Figure 3d, right panel); (P = 0.011, paired t-test at 5% confidence interval; Table 3).
Figure 3.
Internalization and biological effects of conjugated aptamers in PANC-1 cells. (a) Cy3-labeled P19- or P1-conjugated C/EBPα-saRNAs were incubated with PANC-1 cells. Red: Cy3-labeled RNA, Blue: Hoechst 33342. (b) Relative transcript expression (qPCR) for C/EBPα mRNA and (c) p21 mRNA was quantified by real-time PCR. CEBPA expression increased fivefold (P = 0.029) and p21 increase 57.6-fold (P = 0.033) by P19-CEBPα-saRNA conjugated aptamer or 1.29-fold (P = 0.015) and 1.4-fold (P = 0.026), respectively, by P1- CEBPα-saRNA-conjugated aptamer. (t-test with Welch's correction at 95% confidence interval). (d) A WST-1 cell proliferation assay was performed in PANC-1 cells. At 96 hours, only 22.9% of total cells were proliferating following treatment with P19-CEBPα-saRNA and 28% of total cells proliferation following P1-C/EBPα-saRNA. Both P19-Scramble-saRNA and P1-Scramble-saRNA demonstrated cytostatic effects on the cells. (e) Western blot analysis was carried out in PANC-1 cells treated with P19- or P1-conjugated C/EBPα–saRNA or scrambled saRNA aptamers. Membranes were probed with anti-C/EBPα and anti-actin (control). Band intensity from three representative blots was analyzed (right panel). P19 and P1- C/EBPα -saRNA treatment induced a threefold increase in CEBPA signal relative to untreated cells. P19 and P1-scramble conjugate treatment both induced a twofold increase in CEBPA signal.
Table 2. Statistical analysis of CEBPA and p21 transcript levels.
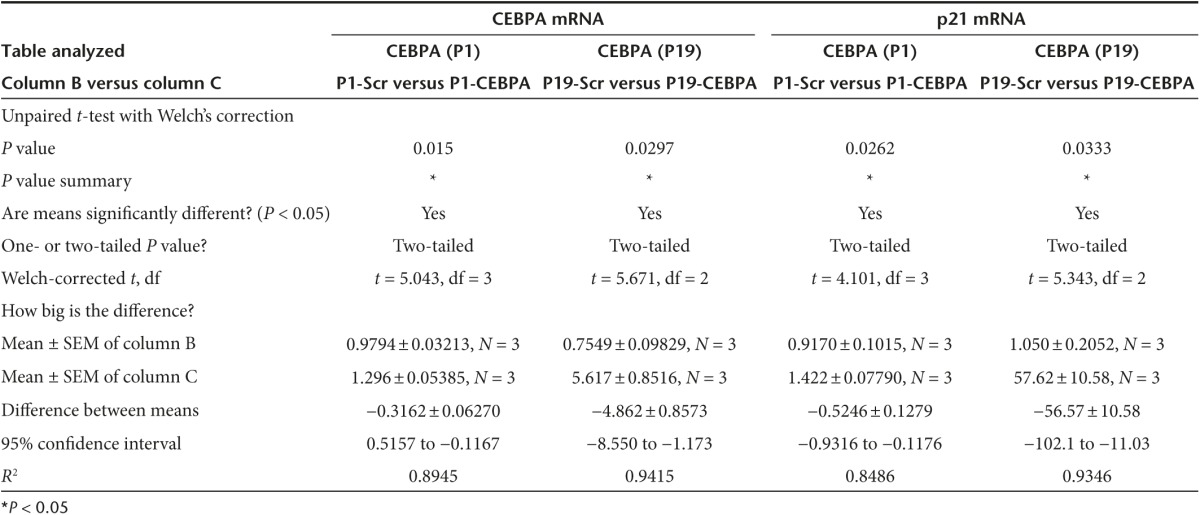
Table 3. Table summary of percentage cell proliferation in PANC1 cells treated with P19/P1 scramble and CEBPA at 96 hours.
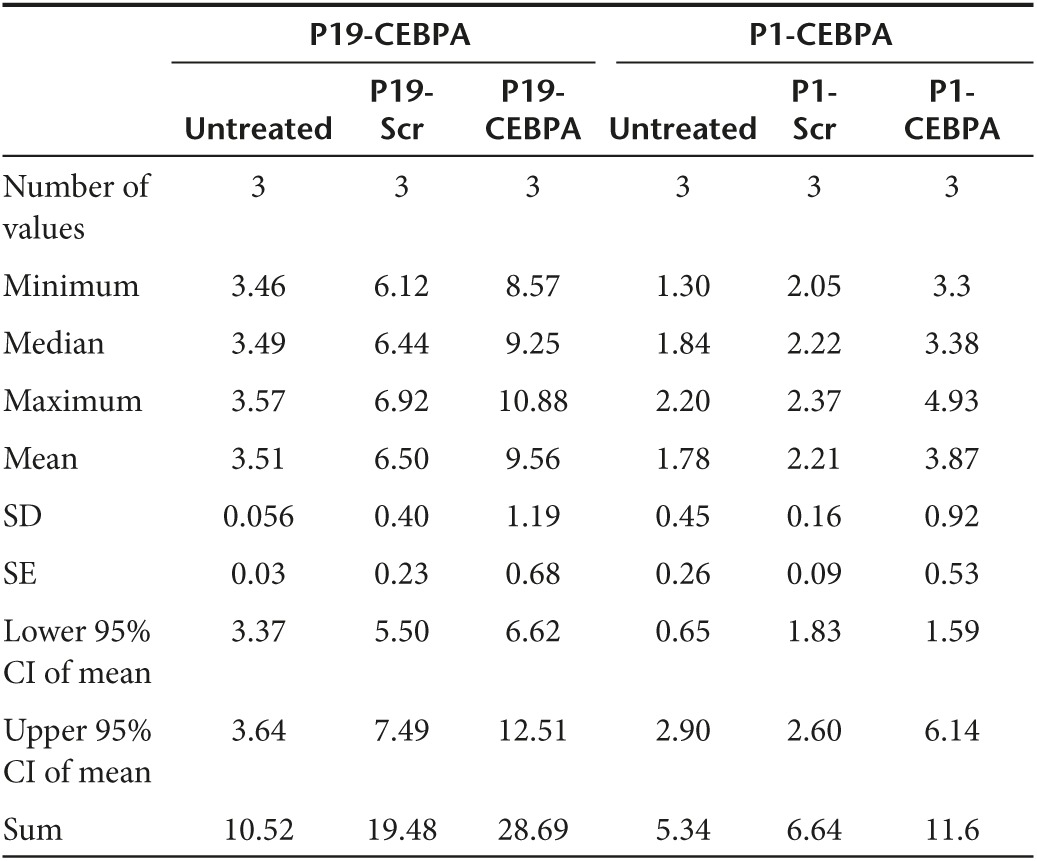
A western blot analysis of CEBPA protein extracted from the treated PANC-1 cells demonstrated three times higher band intensity in cells treated with P19-C/EBPα-saRNA when compared to P1-C/EBPα-saRNA (Figure 3e and Table 4). We also observed at least a twofold increase in CEBPA signal from cells treated with scramble conjugated aptamer (Figure 3e and Table 4). Since the P19/P1 aptamer target is linked with the c-Myc/CEBPA signaling network,29 the aptamers may be modulating a functional effect within this network which may not be picked up at the transcript level, but clearly observable at the protein level and from the WST assay where P19/P1–scramble conjugate showed a cytostatic response (Figure 3d). We are currently investigating the signaling network induced by the aptamer target.
Table 4. Table summary of band intensity from western blot on PANC1 cells treated with P19/P1 scramble and CEBPA.
Injection of C/EBPα-conjugated P19 and P1 in luciferase reporter xenografts leads to a reduction in tumor growth
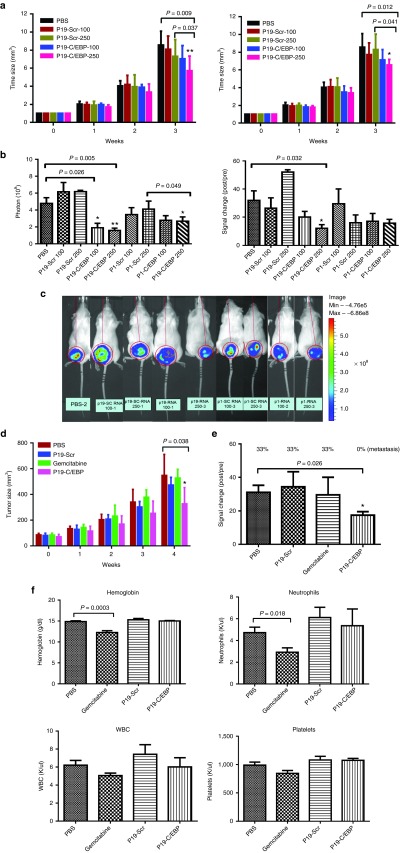
To investigate the antitumor effects of C/EBPα-saRNA in vivo, 100 and 250 pmol of P19-C/EBPα-saRNA and P1-C/EBPα-saRNA conjugates were delivered systemically into human pancreatic cancer xenografts via tail vein injection. A significant reduction in tumor growth (Figure 4a) and bioluminescent signal (Figure 4b,c) was observed in the treated groups, when compared to scramble control-treated and untreated animals. This observation confirmed the known antiproliferative effects of C/EBPα in PDAC. We then compared the antitumor effects of C/EBPα to gemcitabine over a period of 4 weeks. P19-C/EBPα-saRNA demonstrated 30% more efficient antitumor response when compared to gemcitabine by 4 weeks (Figure 4d). When the same study was performed in xenografts using gemcitabine-resistant human pancreatic adenocarcinoma cells, the only significant antitumor effect was observed in the P19-C/EBPα-saRNA-treated group. Gemcitabine showed no response (Figure 4e) and with no evidence of blood toxicity in response to P19-C/EBPα-saRNA as indicated by analysis of hemoglobin, white blood cells, neutrophil, and platelet counts (Figure 4f).
Figure 4.
In vivo effects of P19 and P1- C/EBPα-saRNA. (a) P19- and P1-conjugated C/EBPα-saRNA aptamers were injected in PANC-1 engrafted mice via tail vein injection at 100 and 250 pmol. Tumor size was calculated by the formula 0.52 × length × width × width. Data are presented as the mean ± SD (n = 4 each group) (b) Tumor growth was monitored by evaluating bioluminescence before the first injection and 1 week after the last injection. The photons (left) and bioluminescent signal changes (right) were quantified. (c) Bioluminescent images of the xenografts are a representative of each treatment groups. (d) Comparison of the antitumor effect of C/EBPα-saRNA with gemcitabine. P19-conjugated C/EBPα-saRNA aptamers were injected in PANC-1 engrafted mice by tail vein injection at 1 nmol. Gemcitabine were injected by i.p. at 3 mg on day 5 and 7 for 4 weeks. Data are presented as the mean ± SD (n = 6 each group) (e) The antitumor effects in gemcitabine-resistant AsPC-1 cells in vivo were assessed. P19-conjugated C/EBPα-saRNA aptamers were injected in AsPC-1-engrafted mice by tail vein injection at 1 nmol. Data are presented as the mean ± SD (PBS: n = 6, P19-CEBP: n = 5, P19-Scr: n = 3, gemcitabine: n = 3). Tumor growth was monitored by evaluating bioluminescence before the first injection and 1 week after the last injection. The percentage of the cells that had metastasized to the ascites was measured. (f) To assess cytotoxicity following gemcitabine treatment, the blood parameter for hemoglobin, white blood cell count, platelets, and neutrophils were measured. Data are presented as the mean ± SD (n = 6 each group).
Cy3-conjugated RNA aptamers P19 and P1 may be exploited as a tool for immunohistochemistry on pancreatic biopsies
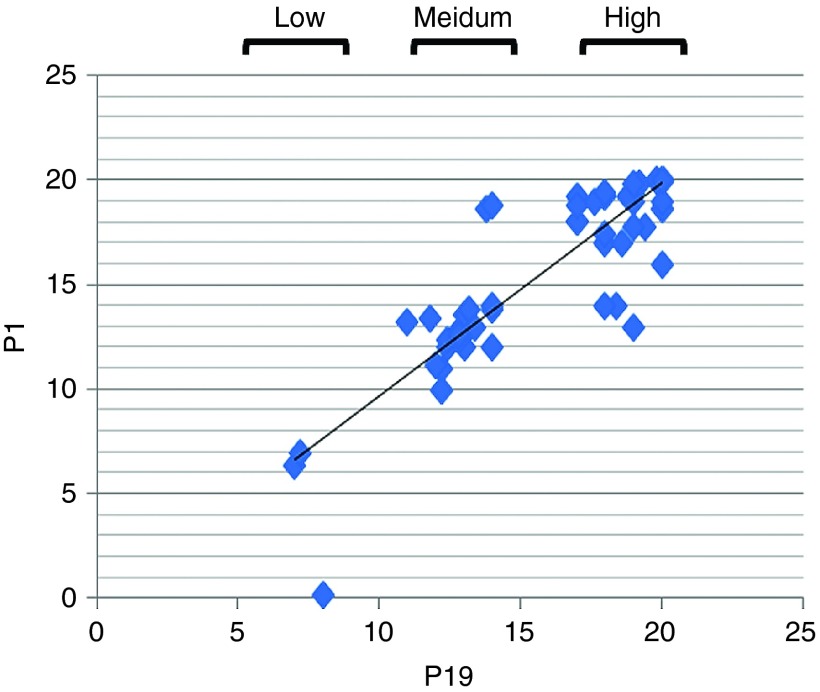
Frozen tissue sections from 72 patients with pancreatic cancer were used to determine the staining efficiency of Cy3-P19 and Cy3-P1 aptamers. As staining controls, lung, fat tissue, muscle, kidney (Supplementary Figure S3, left panel), liver, bone marrow, brain, and spleen biopsies (Supplementary Figure S3, right panel) were also screened. Pancreatic tumor sites and adjacent nontumor sections were subjected to standard antigen retrieval for conventional immunohistochemistry (Supplementary Figure S4). P19 staining appeared cytoplasmic on pancreatic cancer region specifically (Supplementary Figure S4, inset) with a correlation coefficient score of 0.891 between P19 and P1 (Figure 5). Scoring criteria was therefore established for the staining intensity of the 72 patient samples to include low- (<7), medium- (>7 and <14), and high-level staining (>14 and <20) (Table 5). The mean survival period was 21.0 ± 2.6 months for the low-level P1 staining group, 15.9 ± 3.2 months for the medium-level P1 staining group, and 13.1 ± 4.4 months for the high-level P1 staining group. The mean survival period was 21.0 ± 2.6 months for the low-level P19 staining group, 15.6 ± 3.3 months for the medium-level P19 staining group, and 13.1 ± 4.3 months for the high-level P19 staining group (Table 2). The staining intensity between each survival group showed statistically significant differences (mean ± SD relative to low staining group).
Figure 5.
Staining pattern of Cy3-labeled P19 and P1 on archival human tissue sections correlates with survival rates. A total of 72 samples from patients with pancreatic adenocarcinoma were stained with Cy3-labeled P19 and P1 aptamers. The correlation coefficient between P1 and P19 for signal intensity (low, medium, and high) versus patient survival period was 0.891.
Table 5. Scoring criteria for P19 and P1 immunohistochemistry.

Discussion
Advanced PDAC still remains a fatal disease, and in most cases, dysfunctional KRAS signaling appears to be the most common cause. Despite recognition of this target, many attempts to abrogate its response have failed. New and more effective treatments for advanced PDAC must therefore be found. RNA aptamers are becoming attractive therapeutic molecules due to their safety and effectiveness. Their high specificity, low toxicity and low immunogenicity led to the first FDA approval in 2004, for an aptamer-based treatment for neovascular age-related macular degeneration.30 To date, aptamers have been widely investigated for biomarker discovery, in vitro diagnosis, in vivo imaging, and targeted therapy. There have been few other reports of aptamer-based therapies that target pancreatic cancer; for instance, Kim et al.31 recently reported the development of a pancreatic adenocarcinoma-specific aptamer that targets the growth factor PAUF (pancreatic adenocarcinoma up regulated factor). In this study, we selected two RNA aptamers (P19 and P1) that specifically recognize pancreatic cancer cells, with the aim of using them as delivery vehicles for saRNA treatment.
Since C/EBPα is a known transcription factor that suppresses tumor growth in PDAC and is epigenetically silenced in aggressive forms of this disease, it was recognized as an appropriate factor to target for this study.14,28,32 By linking a duplex C/EBPα-saRNA molecule to pancreatic cancer-specific P19 and P1 aptamers, we demonstrated efficient endocytic uptake in pancreatic cells and a significant increase in C/EBPα transcript and protein levels. This chemical-free induction of expression was similar to the results achieved using lipid transfection of C/EBPα-saRNA, as previously reported.17 The aptamers conjugated with scrambled nonspecific RNA also showed a slight increase in CEBPA protein expression which was not observed at the transcript level. This therefore suggests that the aptamers alone might also be modulating a functional posttranslational effect within the CEBPA network to regulate cell cycle progression as observed from the WST-1 cell proliferation assay. The identity of the aptamer epitope and its functional role in PANC-1 cells is currently under further characterization.
Confocal images of fluorescently labeled (Cy3)-P19 and P1 aptamers showed punctate staining within the cytoplasm of pancreatic cancer cell lines, with no uptake observed in normal primary pancreatic cells or in human breast and prostate cancer cell lines. This suggests that P19 and P1 displays a cancer-specific epitope recognition motif and efficient uptake within cells bypassing the need for toxic and complex synthetic carrier molecules.
This report is the first to provide evidence of an antitumor response in a gemcitabine-resistant pancreatic tumor-xenograft animal model. P19-C/EBPα-saRNA induced a 40% decrease in tumor growth with no evidence of toxicity to the host. Although this rate of decrease may not as yet prove useful for treating human cancer, it is the first study to demonstrate a targeted approach of treating pancreatic cancer. Since the specificity and delivery of aptamers can be improved significantly by simply modifying the components of the nucleic acid chain, this study paves the way for increasing the efficiency of this type of vehicle to significantly reduce side effects associated with current adjuvant antitumor therapies and even potentially be used as a diagnostic marker to stratify patients to specific survival groups.
Materials and Methods
Cell lines. The following cell lines were purchased from the American Type Culture Collection (ATCC, Manassas, VA) for use as targets for SELEX, PANC-1 (CRL-1469), Capan-1 (HTB-79), CFPAC-1 (CRL-1918), MIA PaCa-2 (CRL-1420), BxPC-3 (CRL-1687), and AsPC-1 (CRL-1682). Primary human pancreatic epithelial cells (ACBRI 515) were purchased from Cell Systems (Kirkland, WA). Huh-7 cells were purchased from Japanase Collection of Research Bioresources. The cells were cultured according to the cell bank's instructions.
Whole-cell SELEX. The SELEX cycle was performed basically as described by Tuerk and Gold.20 In vitro selection was carried out essentially as described,33 with a few modifications for this study. The DNA library contained 40 nt of random sequences was synthesized by Integrated DNA Technologies (IDT, Coralville, IA). The random region was flanked by constant regions for the amplification. The DNA random library was amplified by PCR and converted to RNA library using the DuraScribe kit (Epicentre, Madison, WI). In the transcription reaction mixture, CTP and UTP were replaced with 2′F-CTP and 2′F-UTP to allow ribonuclease-resistant RNA. For the first round, 6 nmols of the RNA library was incubated with target cells (PANC-1) in 1 ml binding buffer (phosphate-buffered saline solution (PBS) without Ca2+ and Mg2+, 5 mmol/l MgCl2, 0.01% BSA, yeast tRNA (100 µg/ml)). The human pancreatic adenocarcinoma, PANC-1, cells were used as target cells for the aptamer selection. To remove irrelevant binding, the hepatocellular carcinoma cell line, Huh7, was used for the counter-selection step. RNAs that bound to target cells were recovered, amplified by RT-PCR and in vitro transcription, and used in the following selection rounds. In subsequent rounds, the RNA concentration was reduced by 10–folds, and the incubation time was reduced to create more stringent conditions. To avoid nonspecific binding to the cell surface, yeast tRNA (Sigma, St. Louis, MO) was used competitors. After 14 rounds of SELEX, each clone of aptamers were TA cloned.
Live-cell confocal imaging. For the aptamer internalization studies, 1 × 10⁵ cells were seeded in 35 mm glass-bottom dishes (MatTek, Ashland, MA) and grown in medium for 24 hours. The RNAs were labeled with Cy3 using the Cy3 Silencer siRNA labeling kit (Ambion, Austin, TX). Cy3-labeled RNAs were added to the cells at 100 nmol/l and incubated for 1 hour. The images were taken using a Zeiss LSM 510 Meta Inverted 2 photon confocal microscope system (Oberkochen, Germany) using a C-Apo 40x/1.2NA water immersion objective.
Flow cytometry-based binding assays. Aptamer binding and uptake was also assessed by flow cytometry. For the assay, the PANC-1 cells were detached using a nonenzymatic cell dissociation solution, washed with PBS, and suspended in binding buffer. Next, Cy3-labeled aptamers were added and incubated with PANC-1 cells for 30 minutes at 37 °C. Cells were washed with binding buffer and immediately analyzed by Fortessa flow cytometry (BD, San Jose, CA). For the exclusion of dead cells, 4′6′-diamidino-2-phenylindole (DAPI) (1 µg/ml; Vector Laboratories, Burlingame, CA) was used. Each flow-cytometry assay was performed in triplicate. The data were analyzed with FlowJo software.
To determine the apparent dissociation constant (KD) of aptamers to PANC-1 cells, the mean fluorescence intensity was calculated for each concentration and for the unselected library controls. The values for the controls were considered to be background fluorescence and were subtracted from the values for the aptamers, as previously described by Sefah et al.34 The dissociation constants were calculated using a one-site binding model. The nonlinear curve regression was performed using Graph Pad Prism (GraphPad Software, La Jolla, CA).
Immunofluorescence staining for Cy3-P1 and Cy3-P19. Pancreatic cancer tissue samples were obtained from patients at National Taiwan University Hospital. The slides were deparaffinized two times in xylene for 15 minutes each and rinsed with 100% ethanol, followed by 95, 80, and 70% ethanol and then distilled water. For antigen retrieval, tissue sections were heated in a microwave oven at 120 °C for 10 min in 10 mmol/l sodium citrate buffer (pH 6.0). After two washes with PBS, the sections were quenched by incubating them for 10 minutes in 0.3% H2O2. The sections were then incubated with blocking serum (10% serum) for 1 hour at room temperature. The sections were then incubated in a 1/100 dilution of the primary antibodies, Cy3-P1 and Cy3-P19, at 4 °C overnight. The primary antibodies were directly labeled with Cy3. After incubation at 4 °C, the slides were washed three times with PBS and then mounted in a mounting solution containing the nuclear stain 4′6′-diamidino-2-phenylindole (DAPI). The stained sections were viewed under a Zeiss Axio Vert. A1 fluorescent microscope at ×100 magnification. The slides were scored using five independent fields per slide, and the activity in each field was evaluated by the following scoring system: score of 0, no fluorescent signal; score of 1, 1–25% of the cells contain a fluorescent signal; score of 2, 26–50% of the cells contain a fluorescent signal; score of 3, 51–75% of the cells contain a fluorescent signal; score of 4, more than 76% of the cells contain a fluorescent signal.
WST-1 assay. The WST-1 measurement was performed according to the manufacturer's standard protocol (Takara Bio Europe). Briefly, cells were cultured into 96-well plate at a density of 2.5 × 10⁵ cells per well as three independent replicates. Ten microliters of the WST-1 reagent was added and incubated for a duration of 1 hour with spectrophotometry readings at 420 and 620 nm taken every 15 minutes.
Aptamer conjugate to saRNA using “sticky sequences” (STICK). P1-STICK, P19-STICK, Sense-STICK, and antisense RNAs were chemically synthesized by the Synthetic and Biopolymer Chemistry Core in the City of Hope. The P1-STICK and P19-STICK RNAs were refolded in binding buffer, heated to 95 °C for 3 minutes, and then slowly cooled to 37 °C. The incubation was continued at 37 °C for 10 minutes. The sense-STICK and antisense strand were annealed to the complementary partners using the same molar amounts as the corresponding partner strand to form the STICK-C/EBPα RNAs or scrambled RNAs. The same amount of the refolded P1- and P19-STICK was added and incubated at 37 °C for 10 minutes in binding buffer to form the P1- and P19- STICK-C/EBPα RNAs or the P1- and P19- STICK-scrambled RNAs.
Relative gene expression analysis by qPCR and protein expression by western blot analysis. For analyzing gene activation and protein expression, PANC-1 cells were seeded into 24-well plates at a density of 1 × 10⁵ cells per well. P19 and P1, conjugated with C/EBPα-saRNAs or scrambled saRNAs, were added directly to the cells, in duplicate, at a final concentration of 80 nmol/l, for RNA and protein extraction. The treatment was repeated 24 hours later, and the cells were harvested at the 72-hour time point. The total RNA was extracted for reverse transcription (QuantiFast Reverse transcription, Qiagen, Hilden, Germany) and target cDNA amplification by real-time PCR (QuantiFast SYBRGreen Master mix, Qiagen). The cDNA probes used were: C/EBPα (NM_007678) and the reference gene gluceraldehyde-3-phosphate-dehydrogenase GAPDH (NM_008084, XM_001003314, XM_990238) using QuantiTect SYBR Probes from Qiagen. The total protein was extracted using a conventional RIPA buffer (50 mmol/l Tris–HCl, 150 mmol/l sodium chloride, 1.0% Igepal, 0.5% sodium deoxycholate, and 0.1% sodium dodecyl sulfate). The total protein content was then quantitated using a Bradford assay, following the manufacturer's instructions (Bio-Rad, Hercules, CA). The total protein extracts were separated by SDS–PAGE and transferred onto PVDF membranes, then were probed with antibodies against C/EBPα (Sigma, 1:500, SAB4500111, St. Louis, MO) or actin (Abcam, 1:5,000, ab8226, Cambridge, UK). The proteins of interest were detected with an HRP-conjugated secondary antibody (1:5,000) and visualized with LI-COR (Lincoln, Nebraska) Western Sure ECL substrate, according to the manufacturer's protocol.
In vivo assays of antitumor effects. To establish the traceable tumor animal models, subcutaneous implantations were performed by injecting 25 μl of a monocellular suspension containing 106 PANC-1 or AsPC-1 cells expressing luciferase and a 25 μl growth factor-reduced matrigel matrix (BD Biosciences, San Jose, CA) under the dorsal skin of 6-week-old female nonobese diabetic/severe combined immunodeficiency (NOD/SCID) mice (BioLasco, Taiwan).
The firefly luciferase fragment was inserted into a pcDNA-3.1(+) backbone, which also encodes ampicillin resistance for selection in bacteria and the neomycin resistance gene for selection in mammalian cells. The recombinant constructs were purified using the QIAGEN plasmid midi kit. PANC-1 and AsPC-1 cells were transfected with the recombinant constructs for 24 hours. The following day, the culture medium was replaced with standard medium containing 1.2 mg/ml G418 (Merck, Germany) for stable clone selection. Two weeks after selection, a single stable cell line was picked and maintained in medium containing 1.2 mg/ml G418. Luciferase expression was assessed using the Luciferase Assay System. Tumors developed to about 1 × 1 cm in approximately 3 weeks after inoculation.
Each subgroup of mice was injected with 100 pmol, 250 pmol, or 1 nmol aptamer-STICK-saRNA via tail vein 4 times/week for 3 weeks and sacrificed 1 week after the last injection. Tumor growth was monitored by evaluating bioluminescence using an IVIS 200 live animal imaging system. The tumors were evaluated before the first injection and 1 week after the last injection. Prior to the in vivo imaging, the mice were anesthetized using isoflurane. A solution of 150 μg/kg d-luciferin (Biosynth, Staad, Switzerland) was then injected by the intraperitoneal route. The mice were imaged and bioluminescent signals were analyzed using the Living Image Software (Caliper Life Sciences, Alameda, CA). Tumor size was measured with a ruler and calculated by the formula 0.52 × length × width × width.
Statistical analysis. Statistically significant differences were determined by Students t-test and Mann–Whitney test using Graph Pad Prism software (GraphPad Software, La Jolla, CA).
SUPPLEMENTARY MATERIAL Figure S1. Internalization assay of initial RNA aptamer library (prior to enrichment) in PANC-1 and Huh7. Figure S2. Internalization of P19 in various pancreatic cancer cell lines. Figure S3. Negative staining of Cy3-P19 and P1 in non pancreatic lines Figure S4. Cy3-P19 signal from frozen human tissue section. Table S1. Summary of cell-SELEX. Table S2. Sequence information of P19, P1, sense and antisense CEBPAsaRNA strands.
Acknowledgments
S.Y., J.R., and N.H. developed the concept, designed the experiments, and prepared the manuscript. S.Y. performed RNA aptamer selection, cell internalization, measurements of cell binding affinity, qPCR, data organization, and statistical analyses. V.R. assisted in manuscript editing and carried out WB, WST-1 cell proliferation assay, and qPCR. K.W. performed the in vivo experiments and histopathology. L.J. involved mouse experiments. B.A. setup the live cell imaging by confocal microscopy for movies. P.S. and A.J. synthesized RNA oligonucleotides chemically for in vivo experiments. D.S., I.R., P.M., and L.J. edited the manuscript. S.Y., K.H., P.M., P.S., N.H., and J.J.R. hold stocks in Apterna Ltd., UK. We thank the core facility of the Beckman Research Institute at the City of Hope for their technical assistance in flow cytometry and light microscopy digital imaging.
Supplementary Material
References
- Jemal, A, Siegel, R, Ward, E, Hao, Y, Xu, J and Thun, MJ (2009). Cancer statistics, 2009. CA Cancer J Clin 59: 225–249. [DOI] [PubMed] [Google Scholar]
- Stathis, A and Moore, MJ (2010). Advanced pancreatic carcinoma: current treatment and future challenges. Nat Rev Clin Oncol 7: 163–172. [DOI] [PubMed] [Google Scholar]
- (2011). Pancreatic cancer in the UK. Lancet 378: 1050. [DOI] [PubMed] [Google Scholar]
- Vincent, A, Herman, J, Schulick, R, Hruban, RH and Goggins, M (2011). Pancreatic cancer. Lancet 378: 607–620. [DOI] [PMC free article] [PubMed] [Google Scholar]
- Alexakis, N, Halloran, C, Raraty, M, Ghaneh, P, Sutton, R and Neoptolemos, JP (2004). Current standards of surgery for pancreatic cancer. Br J Surg 91: 1410–1427. [DOI] [PubMed] [Google Scholar]
- Ghaneh, P, Costello, E and Neoptolemos, JP (2007). Biology and management of pancreatic cancer. Gut 56: 1134–1152. [DOI] [PMC free article] [PubMed] [Google Scholar]
- Klinkenbijl, JH, Jeekel, J, Sahmoud, T, van Pel, R, Couvreur, ML, Veenhof, CH et al. (1999). Adjuvant radiotherapy and 5-fluorouracil after curative resection of cancer of the pancreas and periampullary region: phase III trial of the EORTC gastrointestinal tract cancer cooperative group. Ann Surg 230: 776–82; discussion 782. [DOI] [PMC free article] [PubMed] [Google Scholar]
- Neoptolemos, JP, Stocken, DD, Friess, H, Bassi, C, Dunn, JA, Hickey, H et al.; European Study Group for Pancreatic Cancer. (2004). A randomized trial of chemoradiotherapy and chemotherapy after resection of pancreatic cancer. N Engl J Med 350: 1200–1210. [DOI] [PubMed] [Google Scholar]
- Oettle, H, Post, S, Neuhaus, P, Gellert, K, Langrehr, J, Ridwelski, K et al. (2007). Adjuvant chemotherapy with gemcitabine vs observation in patients undergoing curative-intent resection of pancreatic cancer: a randomized controlled trial. JAMA 297: 267–277. [DOI] [PubMed] [Google Scholar]
- (2005). Guidelines for the management of patients with pancreatic cancer periampullary and ampullary carcinomas. Gut 54 (suppl. 5): v1–16. [DOI] [PMC free article] [PubMed] [Google Scholar]
- Wong, HH and Lemoine, NR (2009). Pancreatic cancer: molecular pathogenesis and new therapeutic targets. Nat Rev Gastroenterol Hepatol 6: 412–422. [DOI] [PMC free article] [PubMed] [Google Scholar]
- Fulda, S (2009). Apoptosis pathways and their therapeutic exploitation in pancreatic cancer. J Cell Mol Med 13: 1221–1227. [DOI] [PMC free article] [PubMed] [Google Scholar]
- Eser, S, Schnieke, A, Schneider, G and Saur, D (2014). Oncogenic KRAS signalling in pancreatic cancer. Br J Cancer 111: 817–822. [DOI] [PMC free article] [PubMed] [Google Scholar]
- Yamamoto, K, Tateishi, K, Kudo, Y, Sato, T, Yamamoto, S, Miyabayashi, K, et al. (2014). Loss of histone demethylase KDM6B enhances aggressiveness of pancreatic cancer through downregulation of C/EBPalpha. Carcinogenesis 35: 2404–2414. [DOI] [PubMed] [Google Scholar]
- Li, LC, Okino, ST, Zhao, H, Pookot, D, Place, RF, Urakami, S et al. (2006). Small dsRNAs induce transcriptional activation in human cells. Proc Natl Acad Sci USA 103: 17337–17342. [DOI] [PMC free article] [PubMed] [Google Scholar]
- Janowski, BA, Younger, ST, Hardy, DB, Ram, R, Huffman, KE and Corey, DR (2007). Activating gene expression in mammalian cells with promoter-targeted duplex RNAs. Nat Chem Biol 3: 166–173. [DOI] [PubMed] [Google Scholar]
- Reebye, V, Sætrom, P, Mintz, PJ, Huang, KW, Swiderski, P, Peng, L et al. (2014). Novel RNA oligonucleotide improves liver function and inhibits liver carcinogenesis in vivo. Hepatology 59: 216–227. [DOI] [PMC free article] [PubMed] [Google Scholar]
- Junxia, W, Ping, G, Yuan, H, Lijun, Z, Jihong, R, Fang, L et al. (2010). Double strand RNA-guided endogeneous E-cadherin up-regulation induces the apoptosis and inhibits proliferation of breast carcinoma cells in vitro and in vivo. Cancer Sci 101: 1790–1796. [DOI] [PMC free article] [PubMed] [Google Scholar]
- Ellington, AD and Szostak, JW (1990). In vitro selection of RNA molecules that bind specific ligands. Nature 346: 818–822. [DOI] [PubMed] [Google Scholar]
- Tuerk, C (1997). Using the SELEX combinatorial chemistry process to find high affinity nucleic acid ligands to target molecules. Methods Mol Biol 67: 219–230. [DOI] [PubMed] [Google Scholar]
- Ulrich, H, Magdesian, MH, Alves, MJ and Colli, W (2002). In vitro selection of RNA aptamers that bind to cell adhesion receptors of Trypanosoma cruzi and inhibit cell invasion. J Biol Chem 277: 20756–20762. [DOI] [PubMed] [Google Scholar]
- Wang, J, Jiang, H and Liu, F (2000). In vitro selection of novel RNA ligands that bind human cytomegalovirus and block viral infection. RNA 6: 571–583. [DOI] [PMC free article] [PubMed] [Google Scholar]
- Blank, M, Weinschenk, T, Priemer, M and Schluesener, H (2001). Systematic evolution of a DNA aptamer binding to rat brain tumor microvessels. selective targeting of endothelial regulatory protein pigpen. J Biol Chem 276: 16464–16468. [DOI] [PubMed] [Google Scholar]
- Daniels, DA, Chen, H, Hicke, BJ, Swiderek, KM and Gold, L (2003). A tenascin-C aptamer identified by tumor cell SELEX: systematic evolution of ligands by exponential enrichment. Proc Natl Acad Sci USA 100: 15416–15421. [DOI] [PMC free article] [PubMed] [Google Scholar]
- Hicke, BJ, Marion, C, Chang, YF, Gould, T, Lynott, CK, Parma, D et al. (2001). Tenascin-C aptamers are generated using tumor cells and purified protein. J Biol Chem 276: 48644–48654. [DOI] [PubMed] [Google Scholar]
- Wilson, DS and Szostak, JW (1999). In vitro selection of functional nucleic acids. Annu Rev Biochem 68: 611–647. [DOI] [PubMed] [Google Scholar]
- Que-Gewirth, NS and Sullenger, BA (2007). Gene therapy progress and prospects: RNA aptamers. Gene Ther 14: 283–291. [DOI] [PubMed] [Google Scholar]
- Timchenko, NA, Wilde, M, Nakanishi, M, Smith, JR and Darlington, GJ (1996). CCAAT/enhancer-binding protein alpha (C/EBP alpha) inhibits cell proliferation through the p21 (WAF-1/CIP-1/SDI-1) protein. Genes Dev 10: 804–815. [DOI] [PubMed] [Google Scholar]
- Ciribilli, Y, Singh, P, Spanel, R, Inga, A and Borlak, J (2015). Decoding c-Myc networks of cell cycle and apoptosis regulated genes in a transgenic mouse model of papillary lung adenocarcinomas. Oncotarget 6: 31569–31592. [DOI] [PMC free article] [PubMed] [Google Scholar]
- Gragoudas, ES, Adamis, AP, Cunningham, ET Jr, Feinsod, M and Guyer, DR; VEGF Inhibition Study in Ocular Neovascularization Clinical Trial Group (2004). Pegaptanib for neovascular age-related macular degeneration. N Engl J Med 351: 2805–2816. [DOI] [PubMed] [Google Scholar]
- Kim, YH, Sung, HJ, Kim, S, Kim, EO, Lee, JW, Moon, JY et al. (2011). An RNA aptamer that specifically binds pancreatic adenocarcinoma up-regulated factor inhibits migration and growth of pancreatic cancer cells. Cancer Lett 313: 76–83. [DOI] [PubMed] [Google Scholar]
- Kumagai, T, Akagi, T, Desmond, JC, Kawamata, N, Gery, S, Imai, Y et al. (2009). Epigenetic regulation and molecular characterization of C/EBPalpha in pancreatic cancer cells. Int J Cancer 124: 827–833. [DOI] [PMC free article] [PubMed] [Google Scholar]
- Yoon, S, Lee, G, Han, D, Song, JY, Kang, KS and Lee, YS (2010). Neutralization of infectivity of porcine circovirus type 2 (PCV2) by capsid-binding 2'F-RNA aptamers. Antiviral Res 88: 19–24. [DOI] [PubMed] [Google Scholar]
- Sefah, K, Shangguan, D, Xiong, X, O'Donoghue, MB and Tan, W (2010). Development of DNA aptamers using Cell-SELEX. Nat Protoc 5: 1169–1185. [DOI] [PubMed] [Google Scholar]
Associated Data
This section collects any data citations, data availability statements, or supplementary materials included in this article.


