Abstract
BACKGROUND
Survival rates are commonly used to measure success in treating cancer, but can be misleading. Modern diagnostic practices can lead to the appearance of improving cancer survival, as tumors are diagnosed earlier (lead-time bias) or as an increasing proportion are slow-growing (length bias), whereas the actual burden of cancer deaths is unchanged. Increasingly, more subclinical thyroid cancers are being diagnosed. The objective of the current study was to determine whether thyroid cancer survival rates have been affected by this phenomenon.
METHODS
The authors analyzed survival data from patients with thyroid cancer who were treated at Memorial Sloan Kettering Cancer Center (MSKCC) from 1950 to 2005, and United States population-based incidence, prevalence, and survival data from 1973 to 2009 in the Surveillance, Epidemiology, and End Results data set.
RESULTS
US thyroid cancer incidence has increased 3-fold from 1975 to 2009. Over time, the proportion of thyroid cancers that are subcentimeter in size has increased from 23% (1983) to 36% (2009). At MSKCC, this percentage rose from 20% (1950) to 35% (2005). The incidence rates of large tumors (>6 cm) and distant metastasis have not changed. In the United States, 10-year relative survival improved from 95.4% to 98.6% (1983-1999). At MSKCC, 10-year disease-specific survival improved from 91.1% to 96.1% (1950-2005). However, when stratified by tumor size and stage, no changes in survival outcomes were observed. US thyroid cancer mortality rates have remained stable (1975-2009).
CONCLUSIONS
Modern medical practices increasingly uncover small, asymptomatic thyroid cancers. Survival rates appear improved, but this finding is spurious, attributable instead to shifts in the characteristics of disease being diagnosed. Relying on survival rates to measure success in treating thyroid cancer may reinforce inappropriately aggressive management. Treatment decisions in thyroid cancer should be made based on mortality, not survival data.
Keywords: thyroid cancer, thyroid cancer mortality, survival, incidence, overdiagnosis, overtreatment
INTRODUCTION
Cancers demonstrate a diversity of behavior, encompassing a spectrum of risk that ranges from indolent tumors that cause no harm during a patient’s lifetime to more aggressive subtypes that inflict considerable morbidity and death.1,2 Papillary thyroid cancer (PTC) is generally an indolent cancer type, and has experienced a disproportionate escalation in incidence corresponding to the wider use of advanced medical imaging.3-5
Modern medical practices have resulted in the heightened detection of subclinical disease, increasing the representation of low-risk patients in the cohort of diagnosed patients. This may lead to the appearance of improved survival outcomes.6 Such a phenomenon may be operant in thyroid cancer. Over the past 3 decades, thyroid cancer incidence has increased dramatically, but the natural history of the disease has not necessarily changed, a phenomenon that has been called an epidemic in diagnosis rather than an epidemic in disease.3 We hypothesized that the increasing diagnosis of subclinical thyroid cancers has led to an increasing proportion of small, localized tumors, and that this shift is associated with the appearance of improving thyroid cancer survival. In this study, we investigated the changes in presentation and survival statistics in thyroid cancer in 2 independent data sets: a large United States (US) cancer registry and a large institutional database.
MATERIALS AND METHODS
Data Sources
We analyzed trends in presentation and survival among patients diagnosed with thyroid cancer at Memorial Sloan Kettering Cancer Center (MSKCC) in New York City and nationally. MSKCC data between 1950 and 2005 were obtained from the Head and Neck Service comprehensive thyroid cancer database, a prospectively maintained registry of 2295 patients treated for thyroid cancer at MSKCC during this period.7 US data were obtained from the Surveillance, Epidemiology, and End Results (SEER) cancer registry, a National Cancer Institute program collecting cancer incidence, presentation, pathology, treatment, and survival data dating back to 1973. It has expanded over time and now collects population-level data on all newly diagnosed cancers within a representative population comprising 28% of the US population. SEER data were analyzed using SEER*Stat,8 and US prevalence data were estimated using the National Cancer Institute’s ComPrev9 and Proj-Prev10 tools. Incidence, mortality, and relative survival data were available only from SEER because it is a population-based registry. In both data sets, we examined all histologies of thyroid cancer, as well as PTC. Use of deidentified MSKCC patient data was reviewed and deemed exempt by the Institutional Review Board. SEER data do not require Institutional Review Board approval; a data use agreement was signed.
Statistical Analysis
US incidence and mortality rates in SEER for patients diagnosed with thyroid cancer between 1975 and 2009 were calculated per 100,000 population and age-adjusted to the 2000 US standard population. Confidence intervals were calculated using methods described by Tiwari et al.11 We estimated the probability that a newly diagnosed thyroid cancer in the United States is lethal by using the mortality:incidence index, defined as the ratio of annual deaths to annual diagnoses.12-14 Relative survival as defined by SEER is a net survival measure representing cancer survival in the absence of other causes of death, and is defined as the ratio of the proportion of observed survivors in a cohort of patients with cancer to the proportion of expected survivors in a comparable set of cancer-free individuals. Ten-year relative survival was modeled from data between 1975 and 1999 to ensure minimum 10-year follow-up. Tumor size and lymph node status were modeled using data since 1983, the time when these data began to be recorded in SEER. In the MSKCC data, disease-specific survival was analyzed and defined as the proportion of patients who had not died of thyroid cancer or thyroid cancer-related therapy. Trends in incidence and mortality were modeled and tested for significance with Poisson regression using the GENLIN (generalized linear models) function in SPSS statistical software (version 22.0; IBM Corporation, Armonk NY). In these models, the response variable is the rate or count, and the explanatory variable is the time period. The deviance statistic was used to confirm goodness of fit for all models.15,16
RESULTS
From 1975 to 2009, the age-adjusted incidence of thyroid cancer in the United States increased 3-fold, from 4.9 to 14.8 per 100,000 persons. Nearly all (92%) of this increased incidence is attributable to changes in the incidence of PTC, which has increased 3.7-fold, from 3.4 to 12.5 per 100,000 persons. During this time, the mortality rate (ie, the number of persons dying of thyroid cancer) has remained unchanged. The median mortality from thyroid cancer in the United States during this time has been stable, hovering around 0.47 (range, 0.43-0.57) per 100,000 persons, with a nonsignificant annual percentage change of −0.2% (95% confidence interval, −0.7 to 0.2; P = .32) (Fig. 1).
Figure 1.
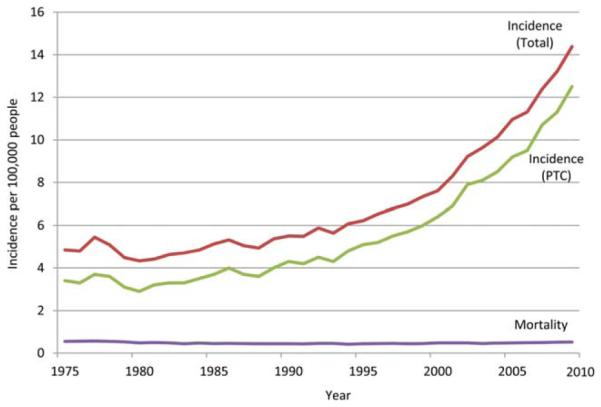
US thyroid cancer incidence and mortality for all histologies and papillary thyroid cancer (PTC). Data were obtained from the Surveillance, Epidemiology, and End Results cancer registry, 1975 to 2009. Incidence rates are age-adjusted to the 2000 US population and expressed per 100,000 people.
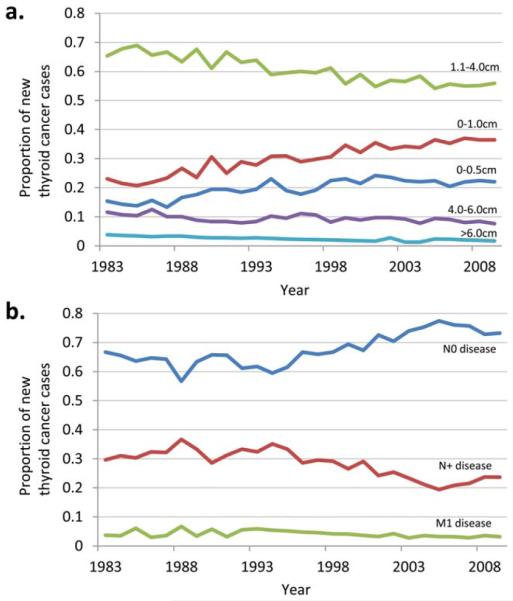
As the number of thyroid cancer diagnoses has escalated, the clinical risk of the average diagnosed case has diminished. A larger proportion of cases are small tumors with negative lymph nodes. Since 1983, the first year for which SEER tumor size and stage data are available, the proportion of patients presenting without lymph node metastases (N0) has increased from 66% to 73% (P<.001). The proportion of patients presenting with lymph node metastases (N+) has declined steadily from 30% to 23% (P<.001) and the proportion of patients with distant metastases has declined from 3.7% to 3.1% (P = .01).
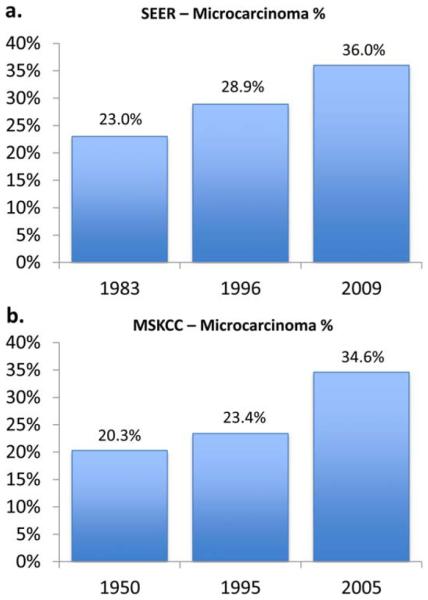
At the same time, a rising proportion of cases are small tumors. Between 1983 and 2009, the proportion of newly diagnosed thyroid cancers measuring ≤5 mm in size has increased from 15% to 22% (P<.001) and the proportion of tumors measuring ≤1.0 cm in size has increased from 23% to 36% (P<.001). These trends have been balanced with declines in the proportion of cases that are large tumors. Cancers measuring 1.1 cm to 4.0 cm have declined from 65% to 55% (P<.001), cancers measuring 4.1 cm to 6.0 cm have declined from 12% to 7% (P<.001), and cancers measuring > 6.0 cm have declined from 4% to 2% (P<.001) (Fig. 2). Both nationally and at MSKCC, thyroid microcarcinomas (cancers measuring ≤1.0 cm) have been the group with the most rapidly rising incidence. At MSKCC, the percentage of thyroid cancers that are microcarcinomas has steadily increased from 20.3% to 34.6% from 1950 to 2005 (Fig. 3).
Figure 2.
Evolution of the distribution of thyroid cancer size and extent of disease. Proportion of newly diagnosed thyroid cancer cases over time shown by (a) tumor size and (b) lymph node-negative (N0) versus lymph node-positive (N+) versus distant metastatic (M1) disease. US data were obtained from the Surveillance, Epidemiology, and End Results cancer registry, 1983 to 2009.
Figure 3.
Increasing proportion of papillary thyroid microcarcinomas (those measuring ≤1.0 cm) as a share of all thyroid cancer diagnoses shown for (a) the Surveillance, Epidemiology, and End Results (SEER) cancer registry for 1983 versus 2009 and (b) the Memorial Sloan Kettering Cancer Center (MSKCC) database for 1950 versus 2005.
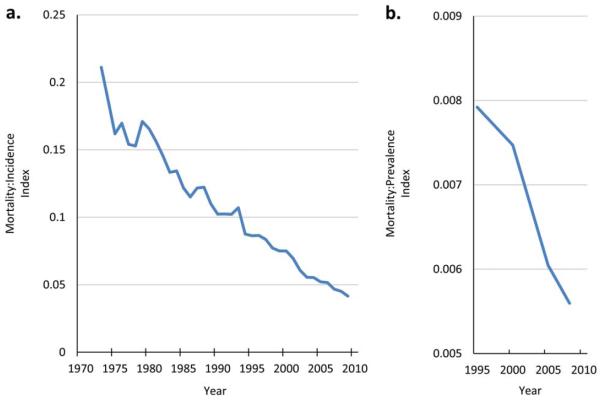
During this time period, the probability that a newly diagnosed thyroid cancer in the United States will be lethal has substantially decreased. Between 1983 and 2009, the thyroid cancer mortality:incidence index decreased by 68%, from 0.11 to 0.037. From 1995 to 2008 (for which SEER 20-year prevalence data are available), the absolute prevalence increased from 141,666 to 294,673, whereas the annual absolute mortality changed from 1122 to 1649, such that the mortality:prevalence index (the ratio of annual deaths to all diagnosed persons in the population) decreased by 38%, from 0.008 to 0.005 (Fig. 4). Rising thyroid cancer incidence and prevalence, in the context of stable mortality rates, reduces the probability that a newly diagnosed thyroid cancer will be lethal, and therefore would be expected to be associated with increasing survival probabilities.
Figure 4.
Mortality from thyroid cancer relative to thyroid cancer (a) incidence and (b) prevalence. As more small, localized thyroid cancers are diagnosed, both the incidence and prevalence increase, but the absolute number of lethal thyroid cancers has not changed. As a result, the probability that a newly diagnosed thyroid cancer will be lethal decreases, and survival rates appear to increase. Data obtained from the Surveillance, Epidemiology, and End Results cancer registry, 1975 to 2009.
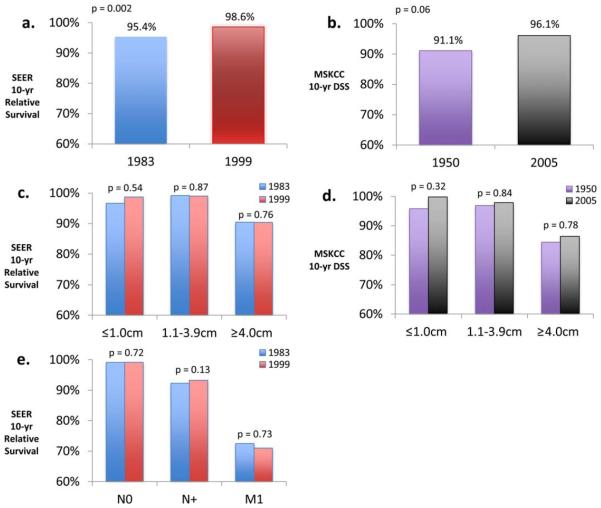
We then evaluated trends in survival over time, both nationally in SEER data and at MSKCC. For all cases, survival has appeared to increase steadily over time in both settings. In the SEER data, 10-year relative survival with thyroid cancer among patients diagnosed between the years 1983 and 1999 has increased from 95.4% to 98.6% (P = .002) (Fig. 5a). At MSKCC, 10-year disease-specific survival for patients diagnosed between 1950 and 2005 has increased from 91.1% to 96.1% (P = .06) (Fig. 5b). We then stratified survival by tumor size (≤1.0 cm, 1.1-3.9 cm, and ≥4.0 cm). In both SEER and MSKCC data, survival within each size category has not significantly changed, although there has been a nonsignificant increase in survival in the microcarcinoma subcategory (SEER cohort: P = .54; MSKCC cohort: P = .32) (Figs. 5c and 5d).
Figure 5.
Improved disease-specific survival (DSS) and relative survival improvements in thyroid cancer. (a) Surveillance, Epidemiology, and End Results (SEER) 10-year relative survival changes from 1983 to 1999 for all thyroid cancer. (b) Memorial Sloan Kettering Cancer Center (MSKCC) 10-year DSS changes from 1950 to 2005 for all thyroid cancer. (c) SEER 10-year relative survival changes from 1983 to 1999, stratified by size. (d) MSKCC 10-year DSS changes from 1950 to 2005, stratified by size. (e) SEER 10-year relative survival changes from 1983 to 1999, stratified by N and M status.
Similarly, survival stratified by extent of disease (either lymph node or distant metastasis status) demonstrated no change within subcategories (SEER data are shown in Fig. 5e; MSKCC data were unavailable). These data show that improved survival has occurred in concert with shifts in size and stage at presentation, but that survival within individual tumor size or stage subcategories has not changed. Data from regression models are detailed in Table 1.
TABLE 1.
Poisson Regression for Mortality, Incidence, and Survival Rates
| Dependent Variable | β | 95% LCI | 95% UCI | P |
|---|---|---|---|---|
| Mortality | −.002 | −0.007 | 0.002 | .32 |
| Incidence N0 | .008 | 0.006 | 0.01 | <.001 |
| Incidence N+ | −.017 | −0.02 | −0.014 | <.001 |
| Incidence M1 | −.015 | −0.022 | −0.007 | <.001 |
| Incidence <5 mm | .017 | 0.014 | 0.021 | <.001 |
| Incidence <1 cm | .021 | 0.018 | 0.024 | <.001 |
| Incidence 1-4 cm | −.009 | −0.011 | −0.007 | <.001 |
| Incidence 4-6 cm | −.009 | −0.014 | −0.004 | <.001 |
| Incidence >6 cm | −.03 | −0.04 | −0.02 | <.001 |
| Survival (SEER) | .002 | 0.001 | 0.003 | .002 |
| Survival (MSK) | .006 | −0.001 | 0.012 | .06 |
| Survival (SEER; <1 cm) | .001 | −0.002 | 0.004 | .54 |
| Survival (SEER; 1-4 cm) | 0 | −0.003 | 0.003 | .87 |
| Survival (SEER; >4 cm) | .001 | −0.002 | 0.004 | .76 |
| Survival (MSK;<1 cm) | .004 | −0.002 | 0.01 | .32 |
| Survival (MSK;1-4 cm) | .001 | −0.005 | 0.006 | .84 |
Abbreviations: LCI, lower confidence interval; MSK, Memorial Sloan Kettering Cancer Center; SEER, Surveillance, Epidemiology, and End Results; UCI, upper confidence interval.
DISCUSSION
Here, we have illustrated the escalating detection of thyroid malignancies in the United States, in both a national registry as well as at a thyroid cancer referral center. We found that an increasing share of new diagnoses are coming from small localized disease, mostly microcarcinomas. Cadaver studies have shown that a high percentage of persons harbor occult small papillary cancers in their thyroid glands that never cause symptoms or harm, and these cancers represent a subclinical reservoir from which the increased incidence is most likely drawn.3 We also demonstrated that the perceived improvements in thyroid cancer survival over decades are most likely driven by the growing share of thyroid cancers that are microcarcinomas (Fig. 3). Increased identification of cancers with favorable biology engenders more favorable outcomes. This increased detection has taken place while the absolute numbers of large tumors and the absolute number of deaths (mortality rate) have not decreased (Figs. 1 and 2), making it unlikely that we have been simply catching advanced-stage tumors at an earlier stage.
The sizable shift in the spectrum of diagnosed thyroid cancers has occurred at the same time as the appearance of improving survival with thyroid cancer, both at our institution and nationwide. It is unlikely that this improvement in survival is attributable to improved therapy for thyroid cancer, as some have suggested,17-21 or to a change in the characteristics of the disease itself. More likely, it is a spurious finding explained by a shift in the composition of the disease being diagnosed. We conclude this for 2 reasons. First, improved national survival rates have not been matched by any significant change in national mortality rates (the absolute number of persons dying annually of thyroid cancer). Second, the observed improvement in survival disappears when tumors are stratified by tumor size or metastatic status.
The misleading appearance of improving survival outcomes can lead clinicians to overestimate the benefits of therapy. Black and Welch22 have described the cycle of escalating intervention that results when diagnostic practices (eg, widespread use of thyroid ultrasound and needle biopsy of small nodules) lead to the diagnosis of milder cases of disease, for which outcomes are excellent, leading to the deceptive appearance of improving outcomes. The impression that outcomes are improving strongly reinforces both diagnostic practices as well as therapeutic practices such as thyroidectomy.22 A striking example of such increasing diagnosis has occurred in South Korea, where the female incidence of thyroid cancer has skyrocketed from 0.2 to as much as 111.3 per 100,000 population from 2002 to 2012.5,23 It is believed that such escalation in a short period is due to intense diagnostic ultrasound screening.24 The anticipated survival with small, ultrasound-detected thyroid cancers is close to 100% because these tumors never came to clinical attention in the pre-ultrasound era. Consistent with this hypothesis, between 1993 and 2007, the 5-year relative survival rate with thyroid cancer in South Korea increased from 94% to 100%.19
Modern medical practices can lead to the appearance of improving cancer survival rates as tumors are diagnosed earlier (lead-time bias) or as an increasing proportion of diagnosed tumors are slow-growing (length bias). This distortion of survival statistics from the inclusion of previously subclinical cancers also parallels the concept of stage migration, in which improved diagnostic imaging causes shifts in tumor staging from early to late stage, conveying the illusory appearance of improved survival.6 In thyroid cancer, as advanced diagnostic practices lead to more cases being identified, subclinical tumors are discovered and pulled into the category of early-stage disease. This may be predominantly due to the intensification of trigger events such as radiologic serendipity (uncovering a thyroid finding on a test done for another reason) or diagnostic cascade (identification of a thyroid finding during a workup that does not plausibly explain the patient’s presenting symptom).25-27 The inclusion of more subclinical tumors with anticipated excellent survival outcomes into the early-stage category artificially increases incidence and survival rates, even though the natural history of the disease has not necessarily changed.
US mortality from thyroid cancer hovers around 0.5 per 100,000 people. Between 1975 and 2011 (the most recent year for which data are available), the high was recorded in 1977 at 0.57 per 100,000 people (approximately 1710 deaths per year nationwide) and the low was recorded in 1994 at 0.42 per 100,000 people (approximately 1260 deaths per year nationwide). Because the mortality rate for thyroid cancer is so small, any fluctuations appear large in relative terms (even if not in absolute terms). However, our statistical modeling confirms that there has been no change in mortality rates with thyroid cancer in the United States (P = .32). One can identify periods within the broader data, in which mortality trended down (1977-1983) or trended up (2003-2011), but the mortality rate has never moved outside the range we have seen over the past 30 years. If indeed the steady improvements in thyroid cancer survival were real, we would expect to observe a concurrent decline in mortality, especially in recent years. In contrast, we have noted no change in mortality rates, suggesting that the changes in survival rates are artifacts of changes in disease characteristics.
Although most focus on the increasing incidence of small thyroid cancers, it has been rightly pointed out that large thyroid cancers have increased in incidence as well.28 Thyroid cancers of all sizes did indeed increase between 1983 and 2011, although the increase in the incidence of larger cancers is small in absolute terms. It has recently been shown that not only small cancers are picked up incidentally. Even larger, or advanced-stage, cancers are increasingly being identified incidentally,29 supporting the hypothesis that the increasing incidence is due to the detection of a subclinical reservoir. However, here we demonstrated that the proportion of cancers that are large, lymph node positive, or have distant metastases, has markedly declined over time, resulting in a shift in the spectrum of disease aggressiveness toward the indolent end of the spectrum.
When reviewing MSKCC data over 6 decades, we cannot rule out nonstatistically significant improvements in the treatment of certain subgroups of patients (eg, those with locally advanced thyroid cancers), for whom improved surgical techniques and adjuvant therapy have become available since the 1950s. However, based on data previously reported by our group,7 improvements in survival outcomes for certain high-risk patients treated at MSKCC occurred before the 1970s, and are difficult to disentangle from the concurrent effects of stage migration. We also cannot rule out other explanations for the rising incidence of thyroid cancer. It is possible that there has been a real increase in the actual occurrence of low-risk papillary microcarcinomas, and that the increased incidence is not solely due to improved diagnosis or overdiagnosis.30 Such a scenario, although unlikely as there has been no identified biologic mechanism, does not change our conclusion that the overall improvement in survival is spurious, because there has been no change in mortality rates and no changes in survival within the size or metastatic status categories. Even if the rising incidence of PTC is not solely due to improved diagnosis, other well-described biases such as lead-time bias, length bias, and stage migration can create the appearance of improved survival, when in fact there has been no change in disease behavior.
Indeed, discerning the precise cause of the increasing diagnosis of papillary thyroid microcarcinomas is less important than understanding the low-risk behavior of many of these tumors. This understanding would support the reevaluation of certain surgical practices for small, localized, well-differentiated thyroid cancers. Our observations provide an opportunity to reconsider the impact of increasing thyroid cancer diagnoses, and reduce the morbidity and mortality associated with potentially unnecessary treatment.
Acknowledgments
FUNDING SUPPORT
No specific funding was disclosed.
Footnotes
CONFLICT OF INTEREST DISCLOSURES
The authors made no disclosures.
REFERENCES
- 1.Esserman LJ, Thompson IM, Jr, Reid B. Overdiagnosis and over-treatment in cancer: an opportunity for improvement. JAMA. 2013;310:797–798. doi: 10.1001/jama.2013.108415. [DOI] [PubMed] [Google Scholar]
- 2.Esserman LJ, Thompson IM, Reid B, et al. Addressing overdiagnosis and overtreatment in cancer: a prescription for change. Lancet Oncol. 2014;15:e234–e242. doi: 10.1016/S1470-2045(13)70598-9. [DOI] [PMC free article] [PubMed] [Google Scholar]
- 3.Davies L, Welch HG. Current thyroid cancer trends in the United States. JAMA Otolaryngol Head Neck Surg. 2014;140:317–322. doi: 10.1001/jamaoto.2014.1. [DOI] [PubMed] [Google Scholar]
- 4.Davies L, Welch HG. Increasing incidence of thyroid cancer in the United States, 1973-2002. JAMA. 2006;295:2164–2167. doi: 10.1001/jama.295.18.2164. [DOI] [PubMed] [Google Scholar]
- 5.Lee TJ, Kim S, Cho HJ, Lee JH. The incidence of thyroid cancer is affected by the characteristics of a healthcare system. J Korean Med Sci. 2012;27:1491–1498. doi: 10.3346/jkms.2012.27.12.1491. [DOI] [PMC free article] [PubMed] [Google Scholar]
- 6.Feinstein AR, Sosin DM, Wells CK. The Will Rogers phenomenon. Stage migration and new diagnostic techniques as a source of misleading statistics for survival in cancer. N Engl J Med. 1985;312:1604–1608. doi: 10.1056/NEJM198506203122504. [DOI] [PubMed] [Google Scholar]
- 7.Nixon IJ, Ganly I, Patel SG, et al. Changing trends in well differentiated thyroid carcinoma over eight decades. Int J Surg. 2012;10:618–623. doi: 10.1016/j.ijsu.2012.10.005. [DOI] [PubMed] [Google Scholar]
- 8.Surveillance, Epidemiology, and End Results (SEER) Program . SEER*Stat Database: Mortality-All COD, Aggregated With State, Total US (1969-2010) >Katrina/Rita Population Adjustment<. National Cancer Institute, Division of Cancer Control and Population Sciences, Surveillance Research Program, Surveillance Systems Branch; 2013; underlying mortality data provided by National Center for Health Statistics; Bethesda, MD: cdc.gov/nchs. [Google Scholar]
- 9.Surveillance Research, National Cancer Institute Complete Prevalence (ComPrev) Software. Version 2.0. Available at: surveillance.-cancer.gov/comprev/. Accessed March 2014.
- 10.Surveillance Research, National Cancer Institute Projected Prevalence (ProjPrev) Software. Version 1.0.4. Available at: surveillance.-cancer.gov/projprev/. Accessed March 2014. [Google Scholar]
- 11.Tiwari RC, Clegg LX, Zou Z. Efficient interval estimation for age-adjusted cancer rates. Stat Methods Med Res. 2006;15:547–569. doi: 10.1177/0962280206070621. [DOI] [PubMed] [Google Scholar]
- 12.Asadzadeh Vostakolaei F, Karim-Kos HE, Janssen-Heijnen ML, Visser O, Verbeek AL, Kiemeney LA. The validity of the mortality to incidence ratio as a proxy for site-specific cancer survival. Eur J Public Health. 2011;21:573–577. doi: 10.1093/eurpub/ckq120. [DOI] [PubMed] [Google Scholar]
- 13.Kamangar F, Dores GM, Anderson WF. Patterns of cancer incidence, mortality, and prevalence across five continents: defining priorities to reduce cancer disparities in different geographic regions of the world. J Clin Oncol. 2006;24:2137–2150. doi: 10.1200/JCO.2005.05.2308. [DOI] [PubMed] [Google Scholar]
- 14.Ito Y, Miyauchi A, Kobayashi K, Miya A. Prognosis and growth activity depend on patient age in clinical and subclinical papillary thyroid carcinoma. Endocr J. 2014;61:205–213. doi: 10.1507/endocrj.ej13-0403. [DOI] [PubMed] [Google Scholar]
- 15.Li Y, Tiwari RC, Zou Z. An age-stratified poisson model for comparing trends in cancer rates across overlapping regions. Biom J. 2008;50:608–619. doi: 10.1002/bimj.200710430. [DOI] [PMC free article] [PubMed] [Google Scholar]
- 16.Dickman PW, Sloggett A, Hills M, Hakulinen T. Regression models for relative survival. Stat Med. 2004;23:51–64. doi: 10.1002/sim.1597. [DOI] [PubMed] [Google Scholar]
- 17.Nagar S, Aschebrook-Kilfoy B, Kaplan EL, Angelos P, Grogan RH. Hurthle cell carcinoma: an update on survival over the last 35 years. Surgery. 2013;154:1263–1271. doi: 10.1016/j.surg.2013.06.029. discussion 1271. [DOI] [PubMed] [Google Scholar]
- 18.Gondos A, Bray F, Hakulinen T, Brenner H. EUNICE Survival Working Group. Trends in cancer survival in 11 European populations from 1990 to 2009: a model-based analysis. Ann Oncol. 2009;20:564–573. doi: 10.1093/annonc/mdn639. [DOI] [PubMed] [Google Scholar]
- 19.Jung KW, Won YJ, Kong HJ, Oh CM, Lee DH, Lee JS. Cancer statistics in Korea: incidence, mortality, survival, and prevalence in 2011. Cancer Res Treat. 2014;46:109–123. doi: 10.4143/crt.2014.46.2.109. [DOI] [PMC free article] [PubMed] [Google Scholar]
- 20.Tisell LE, Nilsson B, Molne J, et al. Improved survival of patients with papillary thyroid cancer after surgical microdissection. World J Surg. 1996;20:854–859. doi: 10.1007/s002689900130. [DOI] [PubMed] [Google Scholar]
- 21.Banach R. Davies and Welch draw unfounded conclusions about thyroid cancer from epidemiological data. JAMA Otolaryngol Head Neck Surg. 2014;140:678–679. doi: 10.1001/jamaoto.2014.942. [DOI] [PubMed] [Google Scholar]
- 22.Black WC, Welch HG. Advances in diagnostic imaging and overestimations of disease prevalence and the benefits of therapy. N Engl J Med. 1993;328:1237–1243. doi: 10.1056/NEJM199304293281706. [DOI] [PubMed] [Google Scholar]
- 23.Kweon SS, Shin MH, Chung IJ, Kim YJ, Choi JS. Thyroid cancer is the most common cancer in women, based on the data from population-based cancer registries, South Korea. Jpn J Clin Oncol. 2013;43:1039–1046. doi: 10.1093/jjco/hyt102. [DOI] [PubMed] [Google Scholar]
- 24.Ahn HS, Kim HJ, Welch HG. Korea’s thyroid-cancer “epidemic”– screening and overdiagnosis. N Engl J Med. 2014;371:1765–1767. doi: 10.1056/NEJMp1409841. [DOI] [PubMed] [Google Scholar]
- 25.Davies L, Ouellette M, Hunter M, Welch HG. The increasing incidence of small thyroid cancers: where are the cases coming from? Laryngoscope. 2010;120:2446–2451. doi: 10.1002/lary.21076. [DOI] [PubMed] [Google Scholar]
- 26.Brito JP, Davies L. Is there really an increased incidence of thyroid cancer? Curr Opin Endocrinol Diabetes Obes. 2014;21:405–408. doi: 10.1097/MED.0000000000000094. [DOI] [PubMed] [Google Scholar]
- 27.Morris LG, Sikora AG, Tosteson TD, Davies L. The increasing incidence of thyroid cancer: the influence of access to care. Thyroid. 2013;23:885–891. doi: 10.1089/thy.2013.0045. [DOI] [PMC free article] [PubMed] [Google Scholar]
- 28.Chen AY, Jemal A, Ward EM. Increasing incidence of differentiated thyroid cancer in the United States, 1988-2005. Cancer. 2009;115:3801–3807. doi: 10.1002/cncr.24416. [DOI] [PubMed] [Google Scholar]
- 29.Malone MK, Zagzag J, Ogilvie JB, Patel KN, Heller KS. Thyroid cancers detected by imaging are not necessarily small or early stage. Thyroid. 2014;24:314–318. doi: 10.1089/thy.2012.0651. [DOI] [PubMed] [Google Scholar]
- 30.Ito Y, Nikiforov YE, Schlumberger M, Vigneri R. Increasing incidence of thyroid cancer: controversies explored. Nat Rev Endocrinol. 2013;9:178–184. doi: 10.1038/nrendo.2012.257. [DOI] [PubMed] [Google Scholar]


