Abstract
Leoligin is a natural lignan found in Edelweiss (Leontopodium nivale ssp. alpinum). The aim of this study was to examine its influence on cholesterol efflux and to address the underlying mechanism of action. Leoligin increases apo A1- as well as 1% human plasma-mediated cholesterol efflux in THP-1 macrophages without affecting cell viability as determined by resazurin conversion. Western blot analysis revealed that the protein levels of the cholesterol efflux transporters ABCA1 and ABCG1 were upregulated, whereas the SR-B1 protein level remained unchanged upon treatment with leoligin (10 μM, 24 h). Quantitative reverse transcription PCR further uncovered that leoligin also increased ABCA1 and ABCG1 mRNA levels without affecting the half-life of the two mRNAs in the presence of actinomycin D, a transcription inhibitor. Proteome analysis revealed the modulation of protein expression fingerprint in the presence of leoligin. Taken together, these results suggest that leoligin induces cholesterol efflux in THP-1-derived macrophages by upregulating ABCA1 and ABCG1 expression. This novel activity suggests leoligin as a promising candidate for further studies addressing a possible preventive or therapeutic application in the context of atherosclerosis.
Cardiovascular disease (CVD) is a leading cause of human mortality, especially in developed countries.1 CVD, like coronary or peripheral artery disease and stroke, involves atherosclerosis. A main pathological manifestation of atherosclerosis is the accumulation of excessive cholesterol in arterial walls, resulting in plaque formation. Reverse cholesterol transport (RCT) can eliminate excessive plasma cholesterol from peripheral tissues by mediating its transfer to the liver for excretion. Thus, RCT inhibits the development of CVD.2,3 Cholesterol efflux from peripheral cells in particular macrophages represents the initial and key step of RCT.2,3 In line with this concept, a recent epidemiologic study involving 2924 adults confirmed that the cholesterol efflux capacity was inversely associated with the incidence of CVD.4 Overall, the enhanced cholesterol efflux might lead to increased RCT and finally have a beneficial effect on CVD development. Receptor-dependent cholesterol efflux through ATP-binding cassette transporters A1 (ABCA1) and G1 (ABCG1) and scavenger receptor class B type 1 (SR-B1) constitutes the biggest part of cholesterol transport by macrophages.5 Among them, ABCA1-mediated cholesterol efflux in particular is predominant in human macrophages.5,6
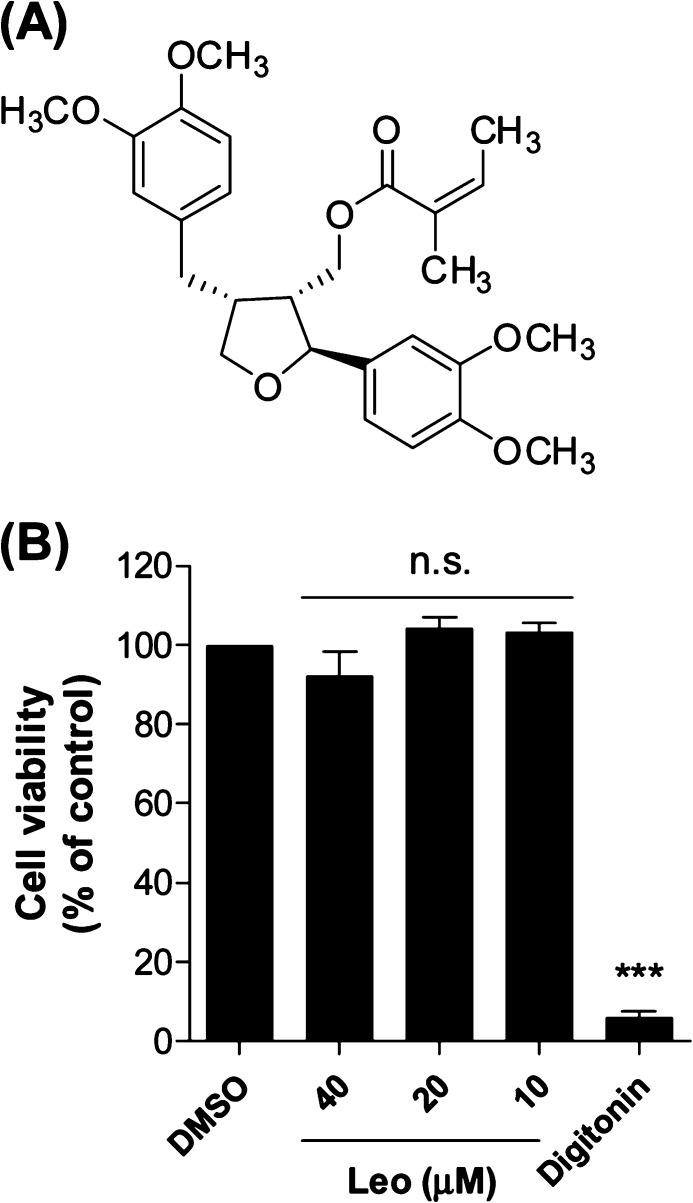
Natural products have been a continuous source of therapeutic agents historically and still represent an important pool for the discovery of new drug leads.7 Leoligin ([(2S,3R,4R)-4-(3,4-dimethoxybenzyl)-2-(3,4-dimethoxyphenyl)tetrahydrofuran-3-yl]methyl (2Z)-2-methylbut-2-enoate, Figure 1A) is the major lignan from the roots of Edelweiss (Leontopodium nivale subsp. alpinum (Cass.) Greuter).8 Previous studies indicated a potential beneficial action of leoligin in the context of CVD, since the compound demonstrated a cholesteryl ester transfer protein (CETP)-modulatory activity and inhibited intimal hyperplasia in vivo in a mouse model of vein graft disease.9,10 Aiming to further characterize the potential of this natural product as a cardioprotective agent in this study within an interdisciplinary project consortium,11 we identified for the first time leoligin as an inducer of macrophage cholesterol efflux.
Figure 1.
(A) Chemical structure of leoligin. (B) Leoligin (Leo) does not affect cell viability of THP-1 macrophages. THP-1 macrophages were treated with leoligin for 24 h at the indicated concentrations, and cell viability was evaluated by resazurin conversion. Digitonin (50 μg/mL), a cytotoxic natural product, was used as positive control. The data are shown as mean ± SD of four independent experiments and evaluated by one-way ANOVA analysis with a Bonferroni post-test. ***p < 0.001 versus solvent control (DMSO); n.s. not significant versus DMSO. Compared with the mean of DMSO, the 95% CI (confidence interval) of difference is 0.1573 to 15.28 (40 μM, Leo), −12.01 to 3.426 (20 μM, Leo), −11.07 to 4.367 (10 μM, Leo), and 86.36 to 101.8 (digitonin), respectively.
Results and Discussion
Leoligin Promotes Cholesterol Efflux in Human THP-1 Macrophages
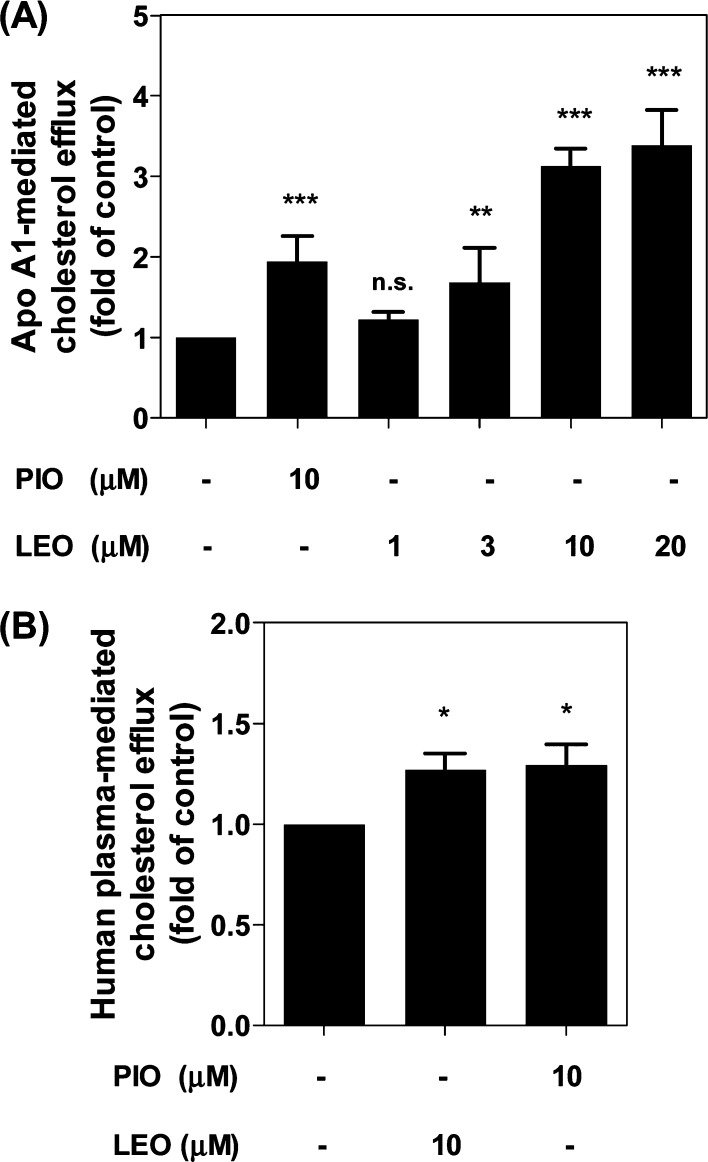
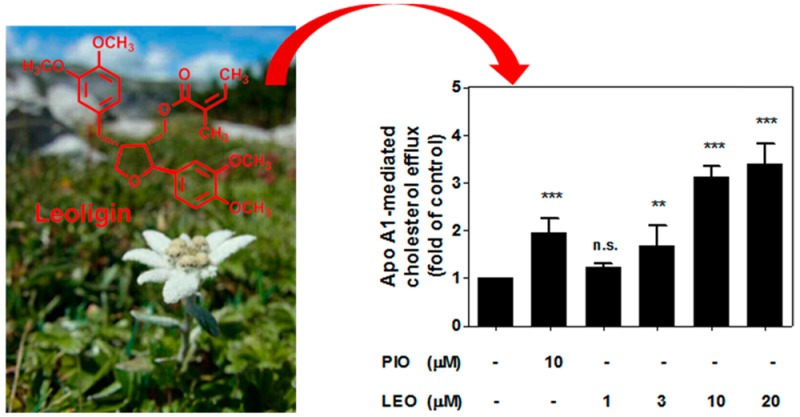
Removal of excessive cholesterol from macrophages, which is termed macrophage cholesterol efflux, plays a protective role during the development of atherosclerosis.12,13 Since apo A1, the nascent lipid-free form of HDL, is the strongest acceptor for cholesterol,6 we first studied apo A1-mediated cholesterol efflux from THP-1-derived macrophages in response to 1–20 μM leoligin, concentrations that do not affect cell viability (Figure 1B). As shown in Figure 2A, leoligin significantly promotes apo A1-mediated cholesterol efflux from human THP-1 macrophages in a concentration-dependent manner. Interestingly, at equimolar concentration (10 μM) leoligin led to an even higher efflux than pioglitazone, which is a well-established enhancer of cholesterol efflux in macrophages and was used as a positive control.14−16
Figure 2.
Leoligin promotes THP-1 macrophage cholesterol efflux mediated by apo A1 (A) as well as by human plasma (B). The assay was performed using 24-well plates. Leoligin (LEO, 10 μM)-treated macrophages labeled with [3H]-cholesterol were incubated for 24 h and then divided into two groups. One group was treated with serum-free medium, whereas the other one was treated with serum-free medium supplemented with 10 μg/mL apo A1 (A) or 1% human plasma (B) for 6 h, respectively. Pioglitazone (PIO, 10 μM) was used as positive control. The intracellular and extracellular radioactivity was measured with scintillation counting. The data are shown as mean ± SD of three independent experiments. One-way ANOVA (Bonferroni) statistical significance evaluation: *p < 0.05, **p < 0.01, and ***p < 0.001 versus the solvent control (DMSO); n.s. no significance versus DMSO. Compared with the mean of DMSO (A), the 95% CI of difference is −1.445 to −0.4443 (10 μM, PIO), −0.7278 to 0.2729 (1 μM, LEO), −1.182 to −0.1812 (3 μM, LEO), −2.628 to −1.628 (10 μM, LEO), and −2.887 to −1.886 (20 μM, LEO), respectively. For (B), the 95% CI of difference is −0.4593 to −0.08031 (10 μM, LEO) and −0.4838 to −0.1047 (10 μM, PIO).
Human plasma contains different isotypes of HDL containing apo A1 with a different degree of lipidation.6 To achieve a better resemblance to the physiological conditions existing in vivo, we checked whether leoligin enhances cholesterol efflux using plasma as an acceptor. As presented in Figure 2B, leoligin (10 μM) indeed exhibited a significant effect on cholesterol efflux with 1% human plasma as acceptor. Taken together, leoligin was an effective inducer of cholesterol efflux in human THP-1 macrophages in the presence of both apo A1 and human plasma.
Leoligin Increases the Expression of ABCA1 and ABCG1
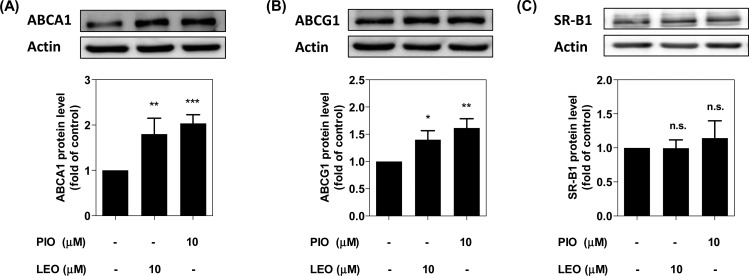
Three transmembrane transporter proteins, ABCA1, ABCG1, and SR-B1, are reported to play a major role in the export of intracellular cholesterol from THP-1 macrophages.5,17 To explore the mechanism of leoligin-mediated induction of cholesterol efflux, we first investigated the protein abundance of these three transporter proteins using Western blot analysis. As shown in Figure 3A and B, ABCA1 and ABCG1, which are considered to play the primary role for macrophage cholesterol efflux,17 were significantly upregulated upon stimulation with leoligin, which might explain the enhanced efflux in the presence of the compound (Figure 2A). The SR-B1 protein level remained unchanged compared to the solvent control (DMSO) (Figure 3C). In contrast to ABCA1 and ABCG1, SR-B1 is not considered to be a crucial transporter protein for macrophage cholesterol efflux. It is a bidirectional transporter and more important for downstream RCT events associated with the elimination of plasma lipids or cholesterol by the liver.17,18
Figure 3.
Leoligin increases ABCA1 and ABCG1, but not SR-B1 protein expression. THP-1 macrophages were treated with leoligin (LEO, 10 μM), pioglitazone (PIO, 10 μM), or solvent control (DMSO) for 24 h. Then, cells were lysed with NP40 buffer. A 20 μg amount of total protein was analyzed by Western blot using anti-ABCA1 (A), -ABCG1 (B), or -SR-B1 (C) antibodies. Band intensities of four independent experiments were quantified. The bar graphs represent mean ± SD, and the statistical evaluation was performed by one-way ANOVA with the Bonferroni post-test. *p < 0.05 versus solvent control (DMSO); **p < 0.01 versus DMSO; ***p < 0.001 versus DMSO; n.s. not significant versus DMSO. For ABCA1 protein level, 95% CI of difference is −1.246 to −0.3587 (LEO, 10 μM) and −1.479 to −0.5911 (PIO, 10 μM); for ABCG1 protein level, 95% CI of difference is −0.6935 to −0.1084 (LEO, 10 μM) and −0.9088 to −0.3237 (PIO, 10 μM); for SR-B1 protein level, 95% CI of difference is −0.3437 to 0.3445 (LEO, 10 μM) and −0.4903 to 0.1979 (PIO, 10 μM).
Leoligin Increases ABCA1 and ABCG1 mRNA Levels but Not mRNA Stability
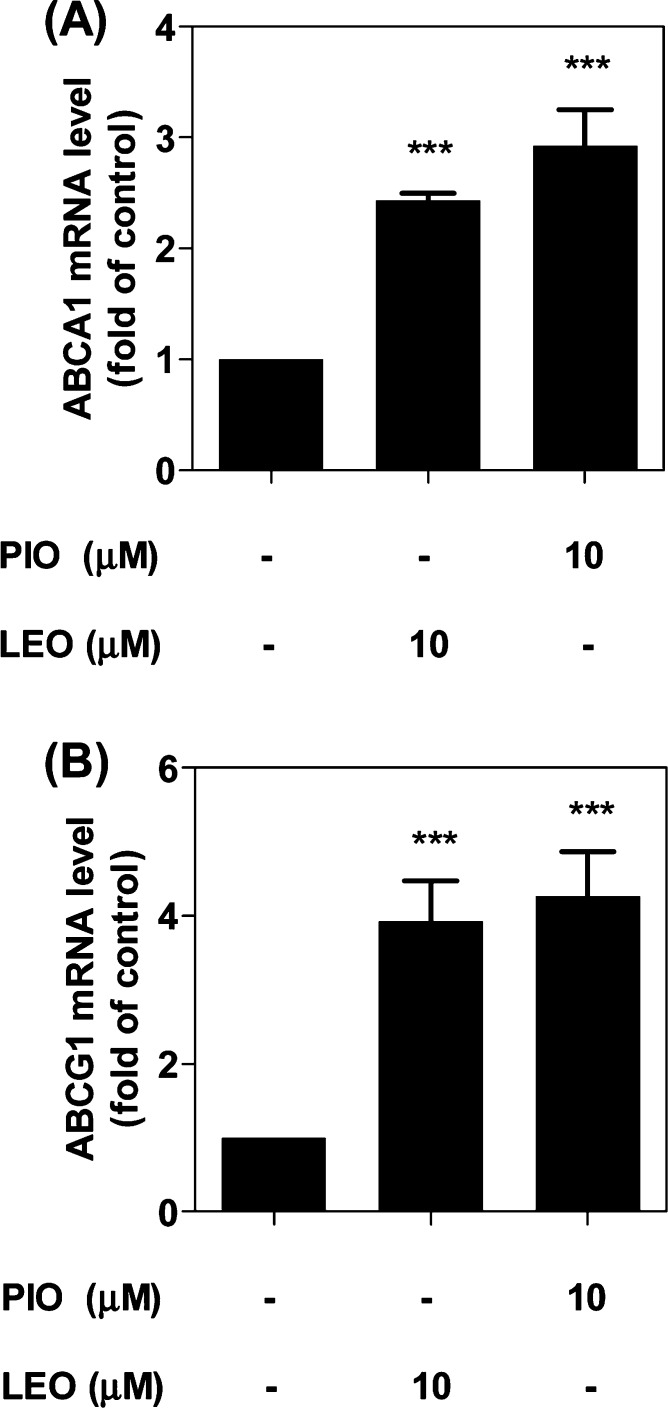
In the next step, we investigated whether the upregulation of the protein level of ABCA1 and ABCG1 is a result of the upregulation of mRNA. Indeed, the mRNA levels of both ABCA1 and ABCG1 were significantly increased compared to the solvent control (DMSO), with 2.4- and 3.8-fold induction, respectively (Figure 4A and B). The magnitude of the leoligin effect is similar to that induced by the positive control pioglitazone, which is reported to augment the mRNA level of ABCA1 and ABCG1 due to PPARγ activation.14−16 Noteworthy, investigation of the time-dependent effect of leoligin (10 μM) on ABCA1 protein and mRNA levels (after 3, 6, 15, and 24 h exposure; presented in the supplementary Figures S1 and S2) revealed a first significant effect after 24 h of exposure. Also considering that the magnitude of ABCA1 and ABCG1 mRNA increase induced by leoligin after 24 h exposure (Figure 4) is larger than the magnitude of the respective ABCA1 and ABCG1 protein level increase (Figure 3), it is reasonable to expect that exposures longer than 24 h might possibly yield even higher upregulation of ABCA1 and ABCG1 protein levels.
Figure 4.
Leoligin increases the expression of ABCA1 (A) and ABCG1 (B) mRNA in THP-1 macrophages. THP-1 macrophages were treated with leoligin (LEO, 10 μM), pioglitazone (PIO, 10 μM), or solvent control (DMSO). After 24 h, total RNA was extracted followed by cDNA synthesis. qPCR was performed and quantified based on four independent experiments. The data are presented as mean ± SD, and the statistical evaluation was performed by one-way ANOVA analysis with the Bonferroni post-test. ***p < 0.001 versus solvent control (DMSO); n.s. not significant versus DMSO. For ABCA1 mRNA level, 95% CI of difference is −1.803 to −1.064 (LEO, 10 μM) and −2.301 to −1.562 (PIO, 10 μM); for ABCG1 mRNA level, 95% CI of difference is −3.726 to −2.134 (LEO, 10 μM) and −4.069 to −2.477 (PIO, 10 μM);.
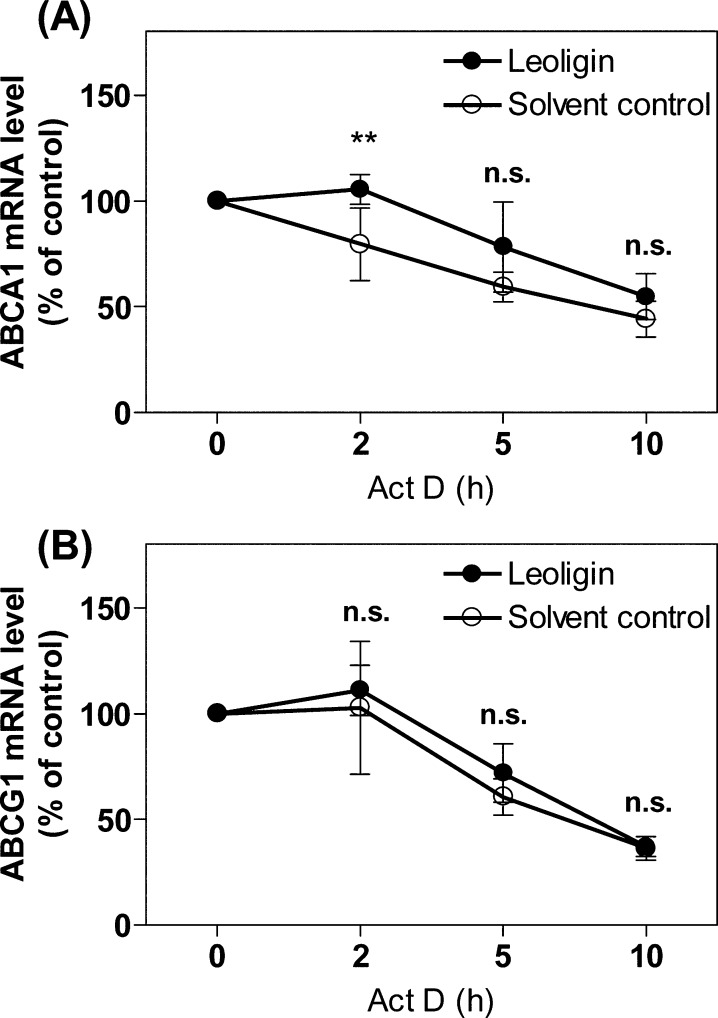
Considering that ABCA1 and ABCG1 mRNA levels were boosted in response to leoligin treatment, we next investigated whether the increased mRNA level can be attributed to differences in the mRNA degradation rate. In this experimental study, actinomycin D (5 μg/mL)19 was used to inhibit de novo gene transcription. The results presented in Figure 5A and B indicate that ABCA1 and ABCG1 mRNA stability was not significantly altered in the presence of leoligin compared to the solvent control (DMSO) with one exception, that for ABCA1 at the 2 h time point (Figure 5A). This transient effect, however, disappeared when actinomycin D was applied longer than 2 h. Taken together, leoligin appears to upregulate ABCA1 and ABCG1 protein level via a mechanism involving mRNA upregulation that is largely independent of ABCA1 and ABCG1 mRNA stability. Therefore, the enhanced mRNA level of the two transporters might be due to the activation of the transcription of the ABCA1 and ABCG1 genes.
Figure 5.
Leoligin does not prevent ABCA1 (A) and ABCG1 (B) mRNA degradation. Differentiated THP-1 macrophages were treated with 10 μM leoligin or vehicle (DMSO). After 24 h incubation, cells were treated with 5 μg/mL actinomycin D (Act D) and lysed at the indicated time points. Total RNA was extracted followed by cDNA synthesis. qPCR was performed and quantified based on four independent experiments. The data are presented as mean ± SD, and the statistical evaluation was performed by two-way ANOVA analysis with the Bonferroni post-test. **p < 0.01 versus solvent control (DMSO); n.s. not significant versus DMSO. For ABCA1 protein, the 95% CI of difference between DMSO and leoligin at different time points is −19.25 to 19.25, 6.647 to 45.14, −0.3661 to 38.13, −8.693 to 29.80; for ABCG1 protein, the 95% CI of difference between DMSO and leoligin at different time points is −18.70 to 18.70, −10.45 to 26.94, −7.388 to 30.00, −17.90 to 19.49.
Proteome Analysis
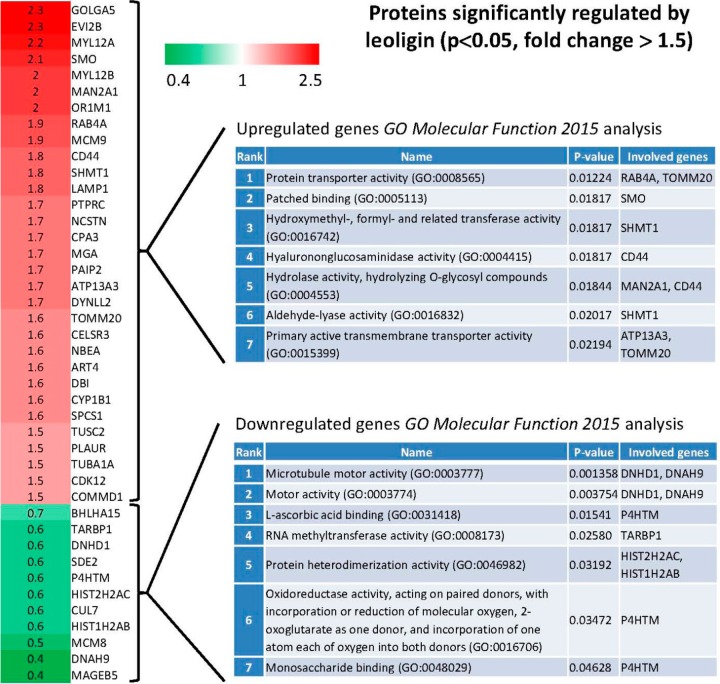
Proteome analysis was performed to study the mechanism by which leoligin upregulates ABCA1 and ABCG1, as well as to characterize the influence of leoligin on global protein expression. Interestingly, leoligin induced very modest THP-1 proteome changes (Figure 6), with 31 proteins being significantly upregulated >1.5-fold above the level of the solvent vehicle control group (p < 0.05 and fold change above 1.5: GOLGA5, EVI2B, MYL12A, SMO, MYL12B, MAN2A1, OR1M1, RAB4A, MCM9, CD44, SHMT1, LAMP1, PTPRC, NCSTN, CPA3, MGA, PAIP2, ATP13A3, DYNLL2, TOMM20, CELSR3, NBEA, ART4, DBI, CYP1B1, SPCS1, TUSC2, PLAUR, TUBA1A, CDK12, COMMD1) and 11 proteins being downregulated lower than 0.75-fold below the level of the solvent vehicle control group (p < 0.05 and fold change below 0.75: BHLHA15, TARBP1, DNHD1, SDE2, P4HTM, HIST2H2AC, CUL7, HIST1H2AB, MCM8, DNAH9, MAGEB5). Interestingly, the proteome analysis data indicated ABCA1 as being upregulated just 1.1-fold and ABCG1-derived peptides were not detected at all. Both proteins would have been missed as mediators of leoligin action if relying exclusively on proteomics data, overall indicating the limitations of the proteomics technique in comparison to the used targeted knowledge-based protein expression study approach. To further identify affected molecular functions represented in the sets of the most upregulated and most downregulated proteins, gene set enrichment analysis was performed using Enrichr (Figure 6).20 For the set of the upregulated genes, the most significantly represented (p = 0.01224) GO term association was Protein transporter activity (GO:0008565), with RAB4A (upregulated 1.9-fold in the presence of leoligin), a regulator of the recycling of receptors from early endosomes to the cell surface,21 and TOMM20 (upregulated 1.6-fold), a subunit of the translocation complex of the mitochondrial outer membrane.22 In the context of cholesterol efflux regulation, RAB4A has been implicated in the membrane recycling of ABCA1 and apo A1.23 It is also interesting to mention that among the upregulated genes is ATP13A3 (upregulated 1.7-fold), which is also a protein associated with primary active transmembrane transporter activity, similarly to TOMM20, and the ATP-binding cassette (ABC) transporters ABCA1 and ABCG1. For the set of the downregulated genes, the most significantly represented (p = 0.001358) GO term association was Microtubule motor activity (GO:0003777), with dynein heavy chain domain 1 (DNHD1, fold change 0.6 in the presence of leoligin) and dynein, axonemal, heavy chain 9 (DNAH9, fold change 0.4), both being subunits of the molecular motor protein dynein. Interestingly, in the context of cholesterol efflux regulation, dynein-mediated microtubular transport has been reported to regulate the dynamic structure of intracellular lipid droplets,24 and mutations in one of the dynein subunits, dynein axonemal heavy chain 10 (DNAH10), are reported to be associated with elevated HDL cholesterol levels in humans.25
Figure 6.
Fold change of proteins being significantly upregulated >1.5-fold above the level of the solvent vehicle control group (labeled in red) and being downregulated lower than 0.75-fold below the level of the solvent vehicle control group (labeled in green) in the presence of leoligin (p < 0.05). THP-1 macrophages were treated with 10 μM leoligin or solvent control (DMSO) for 24 h. Then cells were lysed, and mass spectrometry and proteomic analysis were performed as described in the Experimental Section. Presented is also the outcome of enrichment of GO terms analysis with respect to molecular function (“GO_Molecular_Function_2015”) for the sets of genes most upregulated and most downregulated by leoligin that was performed with Enrichr [for each of the two sets the top seven most enriched GO terms are shown, ordered based on the statistical significance (p-value) of the respective enrichment].
Taken together, although the performed proteomics analysis did not yield direct hints that could explain the molecular mechanism involved in the ABCA1 and ABCG1 mRNA upregulation, it presents an overview of the global protein expression changes induced by leoligin and provides further clues that might be used in future studies to reveal additional mechanistic details underlying the promising bioactivities of this natural product.
In conclusion, we identify leoligin as a new inducer of macrophage cholesterol efflux. Leoligin increases the protein and mRNA level of the cholesterol efflux transporters ABCA1 and ABCG1 in differentiated THP-1 macrophages through a mechanism most likely involving increased ABCA1 and ABCG1 gene transcription. This novel activity outlines leoligin as a promising candidate for further investigation of potential in vivo benefits in experimental models related to atherosclerosis.
Experimental Section
General Experimental Procedures
In this study, phorbol 12-myristate 13-acetate (PMA), apolipoprotein (apo) A1, water-soluble unesterified cholesterol, resazurin sodium salt, actinomycin D, cycloheximide, trizol, digitonin, and dimethyl sulfoxide (DMSO) were purchased from Sigma-Aldrich (Vienna, Austria). Fatty acid free bovine serum albumin (FAF-BSA) was obtained from Roth (Karlsruhe, Germany), and pioglitazone was from Molekula (Munich, Germany). [3H]-Cholesterol (1 mCi, 37 MBq) was purchased from PerkinElmer Life Sciences (Vienna, Austria). Leoligin was isolated as previously described.10,26 Purity of leoligin was >98% as determined by LC-DAD/MS and NMR.
Human plasma was obtained from young, healthy volunteers: Written informed consent was obtained from participants. A 10 mL amount of venous blood was collected after an overnight fast. The study was approved by the Ethics Committee of the Medical University of Vienna (#511/2007).
Roswell Park Memorial Institute 1640 medium (RPMI-1640) was obtained from Lonza (Basel, Switzerland). Fetal bovine serum (FBS) was supplied by Gibco (Lofer, Austria). Primary antibodies against ABCA1, ABCG1, and SR-B1 were purchased from Novus Biologicals (Vienna, Austria). Actin monoclonal antibody was from MP Biologicals (Illkirch, France). The peroxidase-conjugated secondary antibody was obtained from Millipore (Vienna, Austria), and the HRP-linked anti-rabbit IgG secondary antibody was acquired from New England Biolabs (Frankfurt, Germany). The peqGOLD total RNA extraction kit was purchased from PeqLab (Linz, Austria), and the High Capacity cDNA Reverse Transcription Kit was from Applied Biosystems (Vienna, Austria). The LightCycler 480 SYBR Green I Master Mix was from Roche (Mannheim, Germany). ABCA1 (HS_ABCA1_1_SG QuantiTect primer assay, cat. no.: #QT00064869), ABCG1 (Hs_ABCG1_1_SG QuantiTect Primer Assay, cat. no.: #QT00021035), and human 18S (Hs_RRN18S_1_SG QuantiTect Primer assay, cat. no.: #QT00199367) oligonucleotide primers were purchased from Qiagen (Vienna, Austria).
Cell Culture and Viability Detection
THP-1 cells were obtained from ATCC and maintained in RPMI-1640 medium supplemented with 10% heat-inactivated FBS, 100 U/mL penicillin, 100 μg/mL streptomycin, and 2 mM l-glutamine at 37 °C in an incubator with 5% CO2 flow and humidified atmosphere. THP-1 macrophages were acquired upon stimulation with 200 nM PMA for 72 h.
As previously described,27,28 THP-1 cell viability was determined using a resazurin conversion assay upon treatment with the indicated concentrations of leoligin. The increased fluorescence yielded from the conversion of resazurin was detected at an emission wavelength of 580 nm and an excitation wavelength of 535 nm in a 96-well plate reader via Tecan GENios Pro from Tecan Group Ltd. (Männedorf, Switzerland).
Cholesterol Efflux Assay
The cholesterol efflux assay was performed as previously described27 with minor modifications. Differentiated THP-1 macrophages were stimulated with the indicated compounds (leoligin, pioglitazone, and DMSO) at certain concentrations together with the [3H]-cholesterol loading for 24 h. After treatment, medium was aspirated and a second round of addition of the same compounds was conducted in the serum-free RPMI-1640 medium. At the same time, 10 μg/mL apo A1 or 1% human plasma was added as acceptor, together with the indicated compounds. Calculations of apo A1- and human plasma-mediated cholesterol efflux are as follows.27,29
 |
 |
Western Blot Analysis
THP-1 macrophages treated as indicated in the figure legends were washed with cold PBS (4 °C) and lysed with NP40 buffer (150 mM NaCl; 50 mM HEPES (pH 7.4); 1% NP40) containing a protease inhibitor mixture (1% Complete (Roche); 1% phenylmethylsulfonyl fluoride; 0.5% Na3VO4; 0.5% NaF).30 Cell lysates were harvested and centrifuged at 16,060 g for 20 min (4 °C) to remove cell pellets. The protein concentration was determined by the Bradford method. An equal amount of protein samples (20 μg) was resolved via sodium dodecyl sulfate-polyacrylamide gel electrophoresis (SDS-PAGE) and then transferred onto a PVDF membrane (Bio-Rad). The membranes were blocked with 5% lowfat milk and sequentially incubated with the primary antibodies (ABCA1, ABCG1, SR-B1, or β-actin) and appropriate secondary antibodies followed by ECL reagent. Luminescence was detected by a LAS-3000 (Fujifilm, Duesseldorf, Germany). Densitometric analysis was performed using AIDA image analyzer 4.06 software (Raytest, Sprockhoevel, Germany).
qPCR Analysis
Total RNA was isolated from the stimulated THP-1 macrophages using the peqGOLD total RNA kit from PeqLab. cDNA was obtained from the isolated total RNA (1 μg) using oligo (dT) and MultiScribe Reverse Transcriptase. Relative gene expression was quantified using qPCR with the LightCycler 480 SYBR Green I Master kit. The results are expressed as the ratio of the detected expression of each gene normalized to that of 18S.
Protein Preparation for Proteome Analysis
THP-1 macrophages were treated with 10 μM leoligin or solvent control (DMSO) for 24 h. After the treatment, cells were washed with cold PBS and lysed with TRIzol reagent. Dissolved proteins from the organic phase of TRI reagent were precipitated by acetone. The protein pellets were washed three times with 0.3 M guanidine hydrochloride (Sigma-Aldrich) in 95% ethanol and 2.5% glycerol. Dried protein pellets were dissolved in 250 μL of 8 M urea (Sigma-Aldrich) and processed by a filter-aided sample preparation method using a Vivacon 500 MWCO 10 kDa filter (Sartorius Stedim Biotech, Germany). Dissolved proteins were washed twice with 100 μL of 8 M urea and reduced by 100 μL of 10 mM dithiotreitol (Sigma-Aldrich). After reduction, proteins were incubated with 100 μL of 50 mM iodoacetamid (Sigma-Aldrich) dissolved in 25 mM triethylammonium bicarbonate buffer (TEAB; Sigma-Aldrich) and washed twice with 100 μL of 25 mM TEAB. Trypsin (Promega, WI, USA) was used at 1:50 ratio (w/w), and the digestion proceeded for 16 h at 30 °C.
For each sample, peptide concentration was determined as absorbance at 280 nm using a NanoDrop 2000c UV–vis spectrophotometer (Thermo Scientific), and biological replicates were then pooled to obtain a single representative sample per group. Samples were then labeled using iTRAQ 4-plex isobaric tags (Applied Biosystems, CA, USA) according to the manufacturer’s recommendations. Labeled samples were then combined, and three fractions were prepared using Oasis MCX extraction cartridges (Waters, MA, USA), desalted on Empore SPE C18 extraction cartridges (Sigma-Aldrich), and concentrated in a SpeedVac (Thermo Scientific, MA, USA).
Mass Spectrometry and Data Analysis
LC-MS/MS analyses of each fraction were performed on an UltiMate 3000 RSLCnano system (Dionex, MA, USA) connected to an Orbitrap Velos Pro mass spectrometer (Thermo Scientific). Chromatographic separation was performed on an EASY-Spray C18 separation column (25 cm × 75 μm, 3 μm particles) using a 4 h gradient. The mass spectrometer was operating in data-dependent manner using top 10 precursors for isolation and HCD fragmentation at normalized collision energy 40. Each sample fraction was analyzed three times.
Raw LS-MS/MS data were analyzed using Proteome Discoverer v.1.4 (Thermo Scientific). MS/MS spectra identification was performed by the SEQUEST algorithm using Homo sapiens Swiss-Prot sequences as a database. Precursor and fragment mass tolerances for searches were 10 ppm and 0.1 Da, respectively. Only peptides passing FDR ≤ 0.05 were considered for analysis. For protein quantification, only unique peptide sequences were considered. For each protein, its individual peptide ratios were log2 transformed, and the mean value was calculated and tested with one sample t test. A Bejnamin–Hochberg multiple testing correction was then applied to the p-values, and only proteins having a fold induction of at least 1.5 up or 0.75 down and having an adjusted p-value of ≤0.05 were considered as misregulated.
Significantly up- and downregulated proteins were then tested with gene set enrichment analysis using Enrichr20 software. Only categories having a p-value of ≤0.05 were considered.
Statistical Analysis
The data presented in this study are expressed as the mean ± SD of at least three independent experiments. To compare three or more groups, one-way analysis of variance (one-way ANOVA) and two-way ANOVA were used, followed by Bonferroni’s multiple comparison tests. p-Value (<0.05) and 95% confidence interval of difference were used to evaluate the significance among different conditions.31 The statistical analysis was performed with GraphPad Prism 4 software (GraphPad Software Inc.).
Acknowledgments
The authors gratefully acknowledge the financial support by the Austrian Science Fund (FWF) project (P25971-B23), the Vienna Anniversary Foundation for Higher Education (Hochschuljubiläumsstiftung der Stadt Wien) project (H-297332/2014), the AdmireVet project CZ.1.05/2.1.00/01.0006–ED0006/01/01 from the Czech Ministry of Education, and the FWF-NFN project “Drugs from nature targeting inflammation”: S10703, S10704, and S10710.
Supporting Information Available
The Supporting Information is available free of charge on the ACS Publications website at DOI: 10.1021/acs.jnatprod.6b00227.
Figures showing the time-dependent effect of leoligin on ABCA1 protein and mRNA level (PDF)
The authors declare no competing financial interest.
Supplementary Material
References
- Perk J.; De Backer G.; Gohlke H.; Graham I.; Reiner Z.; Verschuren W. M. M.; Albus C.; Benlian P.; Boysen G.; Cifkova R.; Deaton C.; Ebrahim S.; Fisher M.; Germano G.; Hobbs R.; Hoes A.; Karadeniz S.; Mezzani A.; Prescott E.; Ryden L.; Scherer M.; Syvanne M.; Reimer W. J. M. S. O.; Vrints C.; Wood D.; Zamorano J. L.; Zannad F. Int. J. Behav. Med. 2012, 19, 403–488. 10.1007/s12529-012-9242-5. [DOI] [PubMed] [Google Scholar]
- Tall A. R. Eur. Heart J. 1998, 19, A31–A35. [PubMed] [Google Scholar]
- Fielding C. J.; Fielding P. E. J. Lipid Res. 1995, 36, 211–228. [PubMed] [Google Scholar]
- Rohatgi A.; Khera A.; Berry J. D.; Givens E. G.; Ayers C. R.; Wedin K. E.; Neeland I. J.; Yuhanna I. S.; Rader D. R.; de Lemos J. A.; Shaul P. W. N. Engl. J. Med. 2014, 371, 2383–2393. 10.1056/NEJMoa1409065. [DOI] [PMC free article] [PubMed] [Google Scholar]
- Rosenson R. S.; Brewer H. B.; Davidson W. S.; Fayad Z. A.; Fuster V.; Goldstein J.; Hellerstein M.; Jiang X. C.; Phillips M. C.; Rader D. J.; Remaley A. T.; Rothblat G. H.; Tall A. R.; Yvan-Charvet L. Circulation 2012, 125, 1905–1919. 10.1161/CIRCULATIONAHA.111.066589. [DOI] [PMC free article] [PubMed] [Google Scholar]
- Du X. M.; Kim M. J.; Hou L. M.; Le Goff W.; Chapman M. J.; Van Eck M.; Curtiss L. K.; Burnett J. R.; Cartland S. P.; Quinn C. M.; Kockx M.; Kontush A.; Rye K. A.; Kritharides L.; Jessup W. Circ. Res. 2015, 116, 1133–1142. 10.1161/CIRCRESAHA.116.305485. [DOI] [PubMed] [Google Scholar]
- Atanasov A. G.; Waltenberger B.; Pferschy-Wenzig E. M.; Linder T.; Wawrosch C.; Uhrin P.; Temml V.; Wang L. M.; Schwaiger S.; Heiss E. H.; Rollinger J. M.; Schuster D.; Breuss J. M.; Bochkov V.; Mihovilovic M. D.; Kopp B.; Bauer R.; Dirsch V. M.; Stuppner H. Biotechnol. Adv. 2015, 33, 1582–1614. 10.1016/j.biotechadv.2015.08.001. [DOI] [PMC free article] [PubMed] [Google Scholar]
- Wawrosch C.; Schwaiger S.; Stuppner H.; Kopp B. Fitoterapia 2014, 97, 219–223. 10.1016/j.fitote.2014.06.008. [DOI] [PMC free article] [PubMed] [Google Scholar]
- Duwensee K.; Schwaiger S.; Tancevski I.; Eller K.; van Eck M.; Markt P.; Linder T.; Stanzl U.; Ritsch A.; Patsch J. R.; Schuster D.; Stuppner H.; Bernhard D.; Eller P. Atherosclerosis 2011, 219, 109–115. 10.1016/j.atherosclerosis.2011.07.023. [DOI] [PMC free article] [PubMed] [Google Scholar]
- Reisinger U.; Schwaiger S.; Zeller I.; Messner B.; Stigler R.; Wiedemann D.; Mayr T.; Seger C.; Schachner T.; Dirsch V. M.; Vollmar A. M.; Bonatti J. O.; Stuppner H.; Laufer G.; Bernhard D. Cardiovasc. Res. 2009, 82, 542–549. 10.1093/cvr/cvp059. [DOI] [PMC free article] [PubMed] [Google Scholar]
- Waltenberger B.; Atanasov A. G.; Heiss E. H.; Bernhard D.; Rollinger J. M.; Breuss J. M.; Schuster D.; Bauer R.; Kopp B.; Franz C.; Bochkov V.; Mihovilovic M. D.; Dirsch V. M.; Stuppner H. Monatsh. Chem. 2016, 147, 479–491. 10.1007/s00706-015-1653-y. [DOI] [PMC free article] [PubMed] [Google Scholar]
- Khera A. V.; Cuchel M.; de la Llera-Moya M.; Rodrigues A.; Burke M. F.; Jafri K.; French B. C.; Phillips J. A.; Mucksavage M. L.; Wilensky R. L.; Mohler E. R.; Rothblat G. H.; Rader D. J. N. Engl. J. Med. 2011, 364, 127–135. 10.1056/NEJMoa1001689. [DOI] [PMC free article] [PubMed] [Google Scholar]
- Ohashi R.; Mu H.; Wang X.; Yao Q.; Chen C. QJM 2005, 98, 845–856. 10.1093/qjmed/hci136. [DOI] [PubMed] [Google Scholar]
- Ozasa H.; Ayaori M.; Iizuka M.; Terao Y.; Uto-Kondo H.; Yakushiji E.; Takiguchi S.; Nakaya K.; Hisada T.; Uehara Y.; Ogura M.; Sasaki M.; Komatsu T.; Horii S.; Mochizuki S.; Yoshimura M.; Ikewaki K. Atherosclerosis 2011, 219, 141–150. 10.1016/j.atherosclerosis.2011.07.113. [DOI] [PubMed] [Google Scholar]
- Nakaya K.; Ayaori M.; Hisada T.; Sawada S.; Tanaka N.; Iwamoto N.; Ogura M.; Yakushiji E.; Kusuhara M.; Nakamura H.; Ohsuzu F. J. Atheroscler. Thromb. 2007, 14, 133–141. 10.5551/jat.14.133. [DOI] [PubMed] [Google Scholar]
- Hirakata M.; Tozawa R.; Imura Y.; Sugiyama Y. Biochem. Biophys. Res. Commun. 2004, 323, 782–788. 10.1016/j.bbrc.2004.08.151. [DOI] [PubMed] [Google Scholar]
- Duffy D.; Rader D. J. Circulation 2006, 113, 1140–1150. 10.1161/CIRCULATIONAHA.105.593855. [DOI] [PubMed] [Google Scholar]
- Stangl H.; Hyatt M.; Hobbs H. H. J. Biol. Chem. 1999, 274, 32692–32698. 10.1074/jbc.274.46.32692. [DOI] [PubMed] [Google Scholar]
- Venkateswaran A.; Laffitte B. A.; Joseph S. B.; Mak P. A.; Wilpitz D. C.; Edwards P. A.; Tontonoz P. Proc. Natl. Acad. Sci. U. S. A. 2000, 97, 12097–12102. 10.1073/pnas.200367697. [DOI] [PMC free article] [PubMed] [Google Scholar]
- Chen E. Y.; Tan C. M.; Kou Y.; Duan Q. N.; Wang Z. C.; Meirelles G. V.; Clark N. R.; Ma’ayan A.. BMC Bioinf. 2013, 14.128. 10.1186/1471-2105-14-128 [DOI] [PMC free article] [PubMed] [Google Scholar]
- Goueli B. S.; Powell M. B.; Finger E. C.; Pfeffer S. R. Proc. Natl. Acad. Sci. U. S. A. 2012, 109, 15787–15792. 10.1073/pnas.1204540109. [DOI] [PMC free article] [PubMed] [Google Scholar]
- Johnson J. M.; Lai S. Y.; Cotzia P.; Cognetti D.; Luginbuhl A.; Pribitkin E. A.; Zhan T. T.; Mollaee M.; Domingo-Vidal M.; Chen Y. Y.; Campling B.; Bar-Ad V.; Birbe R.; Tuluc M.; Outschoorn U. M.; Curry J. Semin. Oncol. 2015, 42, 915–922. 10.1053/j.seminoncol.2015.09.025. [DOI] [PMC free article] [PubMed] [Google Scholar]
- Azuma Y.; Takada M.; Shin H. W.; Kioka N.; Nakayama K.; Ueda K. Genes Cells 2009, 14, 191–204. 10.1111/j.1365-2443.2008.01261.x. [DOI] [PubMed] [Google Scholar]
- Bostrom P.; Rutberg M.; Ericsson J.; Holmdahl P.; Andersson L.; Frohman M. A.; Boren J.; Olofsson S. O. Arterioscler., Thromb., Vasc. Biol. 2005, 25, 1945–1951. 10.1161/01.ATV.0000179676.41064.d4. [DOI] [PubMed] [Google Scholar]
- Singaraja R. R.; Tietjen I.; Hovingh G. K.; Franchini P. L.; Radomski C.; Wong K.; vanHeek M.; Stylianou I. M.; Lin L.; Wang L. S.; Mitnaul L.; Hubbard B.; Winther M.; Mattice M.; Legendre A.; Sherrington R.; Kastelein J. J.; Akinsanya K.; Plump A.; Hayden M. R. J. Lipid Res. 2014, 55, 1693–1701. 10.1194/jlr.M048710. [DOI] [PMC free article] [PubMed] [Google Scholar]
- Dobner M. J.; Ellmerer E. P.; Schwaiger S.; Batsugkh O.; Narantuya S.; Stutz M.; Stuppner H. Helv. Chim. Acta 2003, 86, 733–738. 10.1002/hlca.200390072. [DOI] [Google Scholar]
- Wang L.; Rotter S.; Ladurner A.; Heiss E. H.; Oberlies N. H.; Dirsch V. M.; Atanasov A. G.. Molecules 2016, 21, 55. 10.3390/molecules21010055. [DOI] [PMC free article] [PubMed] [Google Scholar]
- Ladurner A.; Atanasov A. G.; Heiss E. H.; Baumgartner L.; Schwaiger S.; Rollinger J. M.; Stuppner H.; Dirsch V. M. Biochem. Pharmacol. 2012, 84, 804–812. 10.1016/j.bcp.2012.06.029. [DOI] [PMC free article] [PubMed] [Google Scholar]
- Chinetti G.; Lestavel S.; Bocher V.; Remaley A. T.; Neve B.; Torra I. P.; Teissier E.; Minnich A.; Jaye M.; Duverger N.; Brewer H. B.; Fruchart J. C.; Clavey V.; Staels B. Nat. Med. 2001, 7, 53–58. 10.1038/83348. [DOI] [PubMed] [Google Scholar]
- Holden P.; Horton W. A. BMC Res. Notes 2009, 2, 243. 10.1186/1756-0500-2-243. [DOI] [PMC free article] [PubMed] [Google Scholar]
- Wasserstein R. L.; Lazar N. A. Am. Stat. 2016, 00. 10.1080/00031305.2016.1154108. [DOI] [Google Scholar]
Associated Data
This section collects any data citations, data availability statements, or supplementary materials included in this article.


