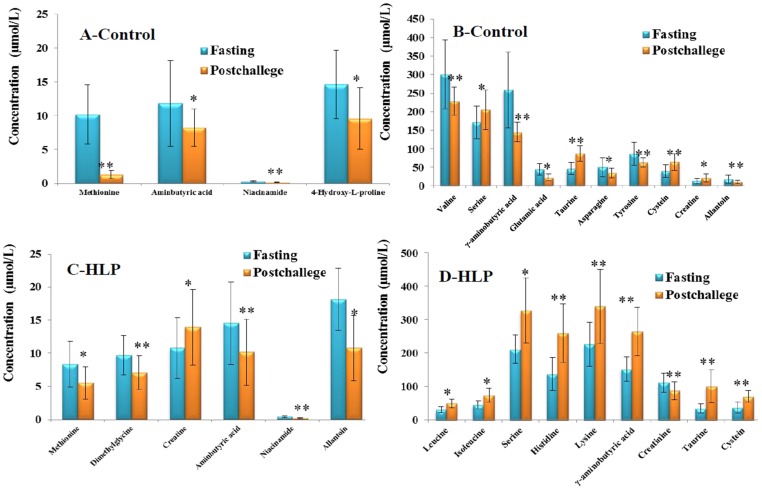
Figure 3.
(A,B) Fourteen significant metabolites concentrations (Mean ± SD) in control group between the fasting (Blue) and post-challenge (Orange); (C,D) Fifteen significant metabolites concentrations (Mean ± SD) in control group between the fasting (Blue) and post-challenge (Orange). * p < 0.05, ** p < 0.01, compared with the control group using the paired t test.

