Abstract
Background
The insertion of suction devices through endotracheal tubes (ETTs) increases airway resistance and the subsequent suctioning may reduce airway pressures and facilitate atelectasis.
The aim of this study was to investigate how airway pressures and tidal volumes change when different combinations of suction equipment and ETT sizes are used, and to what extent unfavorable effects can be ameliorated by choice of ventilator settings.
Methods
A mechanical ventilator was connected to a lung model by ETTs of 9 mm, 8 mm or 7 mm internal diameter (ID) with a pressure transducer inserted distal to the ETT. The effects of suction procedures with bronchoscope and closed catheter systems were investigated during pressure controlled ventilation (PCV) and volume controlled ventilation (VCV). In each mode, the effects of changes in inspiration:expiration (I:E) ratio, trigger sensitivity and suction pressure were examined.
Results
The variables that contributed most to negative model airway pressures and loss of tidal volume during suctioning were (in descending order); 1) Small-size ETTs (7–8 mm ID) combined with large diameter suction devices (14–16 Fr); 2) inverse I:E ratio ventilation (in VCV); 3) negative ventilator trigger sensitivity; and 4) strong suction pressure. The pressure changes observed distal to the ETTs were not identical to those detected by the ventilator.
Conclusions
Negative model airway pressure was induced by suctioning through small-size ETTs. The most extreme pressure and volume changes were ameliorated when conventional ventilator settings were used, such as PCV mode with short inspiration time and a trigger function sensitive to flow changes.
Electronic supplementary material
The online version of this article (doi:10.1186/s12871-016-0196-z) contains supplementary material, which is available to authorized users.
Keywords: Endotracheal suctioning, Airway pressure, Peak pressure, End-expiratory pressure, Bronchoscopic suctioning, Closed Catheter System, High frequency trigging, Pressure Controlled Ventilation, Volume Controlled Ventilation, AutoPEEP, Ventilator
Background
Closed catheter systems and flexible bronchoscopes are often used to remove pulmonary secretions from patients with endotracheal tubes (ETTs) or cannulas [1]. As the insertion of a suction device partly obstructs the lumen, air trapping may occur distal to the ETT followed by generation of negative airway pressures during suctioning. Suction procedures may, therefore, induce atelectasis and compromise gas exchange [2]. Other potential hazards include lung collapse [3] and haemodynamic instability [4, 5]. The magnitude of the pressure changes imposed by endotracheal suctioning may not be reliably detected by sensors in the ventilator air circuit [6].
Our main hypotheses were that increased obstruction, as a result of large suction device diameter and/or narrow ETT internal diameter, would contribute to negative model airway pressures during suctioning, and that both pressure and volume changes can be influenced by ventilator settings.
Methods
Lung model, ventilator and pressure measurements
A commercial test model (Adult/ Pediatric Demonstration Lung Model, IngMar Medical, Pittsburgh, PA, USA) was modified to mimic the low FRC and lung compliance of most ARDS patients and provide means for measuring airspace pressure distal to the ETT during a systematic test protocol. The model was connected to an air chamber (Fig. 1a) to obtain an end-expiratory gas volume of 1400 ml, comparable to the Functional Residual Capacity (FRC) reduction found in mechanically ventilated patients with secondary lung disorder [7]. An extra weight of approximately 750 grams was placed on the bellows to simulate the reduction in compliance common in patients with acute respiratory failure (Fig. 1b).
Fig. 1.
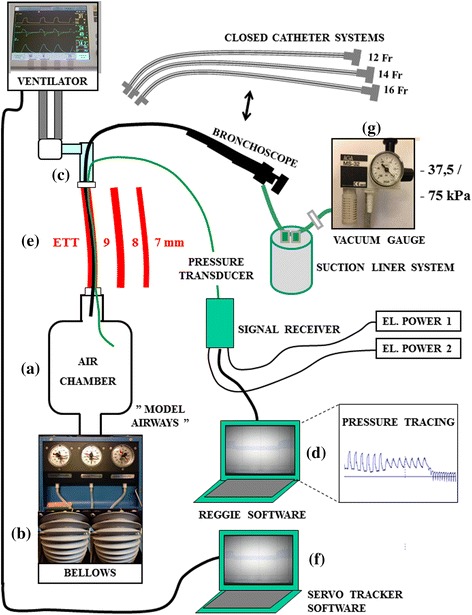
Mechanical lung model test system: Design setup and connections. The term “model airways” (MA) describes the air space distal to the ETT and is comprised of an air chamber, two test model bellows and connecting tubes. Pressures distal to the obstruction were measured by a transducer. Pressures proximal to the obstruction were measured in the ventilator circuit
Airspace pressures distal to the ETT (simulating airway pressures distal to an ETT in positive pressure ventilated patients and referred to as “model airways” (MA) in figures) were measured by a rapid response pressure transducer (baud rate 115200/sec) imbedded in a 5 Fr plastic tube (Reggie, Camtech AS, Høvik – Norway) inserted through an air-tight entrance port (Fig. 1c). The transducer was connected to a dedicated computer (Fig. 1d) which displayed and saved real-time pressure changes. Representative tracings from the experiments are depicted in Fig. 2.
Fig. 2.
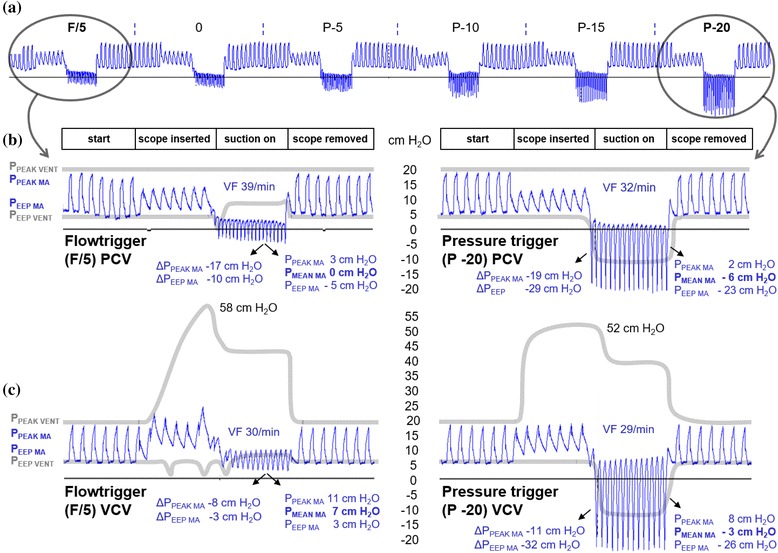
Pressure tracings and ventilator recordings (I:E ratio 1:2, 7 mm ID ETT). a Effects of altered trigger sensitivity on peak and end-expiratory model airway pressures (blue tracings, PPEAK MA and PEEP MA) are shown during bronchoscope insertion (16 Fr) through a 7 mm ID ETT and with suction pressure −765 cm H2O (−75 kPa). Note (both circles) that the pressures, which are measured distal to the obstruction, fall as the bronchoscope is inserted and drop below zero when suctioning is performed. b Details of the most and least sensitive triggers with their corresponding ventilator circuit pressures (grey lines; PPEAK VENT and PEEP VENT). The total effect of suction compared to normal ventilation (prior to scope insertion) is shown as Δ PPEAK MA and Δ PEEP MA. VF = ventilator frequency. Note that ventilator peak pressures, which are measured in the ventilator circuit, are much higher than the actual pressures distal to the obstruction for as long as the bronchoscope is inserted. Ventilator end-expiratory pressures are also much higher than model end-expiratory pressures during suctioning. c Details of the same trigger settings during VCV mode, shown as in panel B. Note that for both modes, triggering of new inspirations during suctioning increases the ventilation rate and prevents further reduction of PEEP MA
During mechanical ventilation, the model was connected to a commonly used ICU ventilator (Servo-i, Maquet, Solna - Sweden) with ETTs of either 9 mm, 8 mm or 7 mm internal diameter (ID) (Mallinckrodt, Hazelwood, Missouri - USA) cut to lengths of 26, 25 and 24 cm, respectively, to simulate clinically relevant ETT lengths in accordance with practise in our hospital (Fig. 1e). Pressures proximal to the ETT (i.e. those detected by transducers monitoring pressures in the ventilator circuit), as well as other ventilator data, were recorded using a commercial filing system (Servo Tracker software version 4.0, Maquet, Solna - Sweden) (Fig. 1f). In addition, a video camera recorded real-time curves and parameters displayed on the ventilator screen.
Suction devices and flow rates
Bronchoscopic suctioning was performed using a 16 Fr bronchoscope (Olympus LF-TP, Tokyo - Japan) with a suction channel diameter of 2.6 mm. Catheter suctioning was performed using closed system catheters with an outer diameter of 12 Fr in 7 mm ID ETT and 14 Fr in 8 and 9 mm ID ETT, as in clinical practice.
Catheters and bronchoscopes were connected to an AGA MS-32 ejector suction device (AGA, Espoo, Finland) (Fig. 1g) with a vacuum gauge (WIKA Instrument Corporation, Georgia, USA) connected to a suction liner system (Serres Hospital Products, Kauhajoki, Finland). The suction equipment was driven by the hospital compressed air system and generated a negative pressure of −765 cm H2O (−75 kPa) (checked against a water column) when set to maximum. Experimental data to support an appropriate maximum level are lacking in the literature. Based on clinical practice, both the maximum level and a moderate level of −382 cm H2O (−37.5 kPa) were used in our investigation.
Flow rates through the different suction devices were measured by a spirometer (Vmax 22, Viasys Inc. Yorba Linda, CA, USA). The flow rate through the bronchoscope suction channel was 8.8 l/min at −382 cm H2O (−37.5 kPa) and 14.1 l/min at −765 cm H2O (−75 kPa). In 12 Fr catheters the flow rate was 9.6 and 15 l/min, respectively, and in 14 Fr catheters 9.6 and 17 l/min. These flow rates correspond with measurements in other experimental studies [3, 8].
Experimental procedures
The effect of variations in endotracheal tube size (9 mm, 8 mm and 7 mm ID), I:E ratio (1:3, 1:2, 1:1, 2:1, 3:1, 4:1) and flow (F)- or pressure (P) trigger settings (F/5, 0, P-5 cm H2O, P-10 cm H2O, P-15 cm H2O, P-20 cm H2O) were investigated with the ventilator set in either pressure control (PCV) or volume control (VCV) mode, using both a bronchoscope and a closed catheter suction system with two suction levels (864 permutations in total). Changes in ventilator tidal volume, circuit pressure and model airway pressure distal to the ETT (PMA), were measured for 30 seconds; i) before insertion of a suction catheter/bronchoscope, ii) after insertion but before suctioning, iii) during suctioning with the end of the catheter/bronchoscope positioned 5 cm distal to the ETT, and iv) after removal of the suctioning device; as depicted in Fig. 2.
For experiments with PCV, the ventilator settings were; PPEAK 20 cm H2O, PEEP 5 cm H2O, ventilator frequency 15/min and RT 5 %. During VCV, initial settings were; inspiratory tidal volume (Vt) 500 ml, PEEP 5 cm H2O, ventilator frequency 15/min, pressure rise time (RT) 5 % and pause 0 %, giving a PPEAK of 18–22 cm H2O. The model compliance, calculated for both modes, was approximately 39 mL/cm H2O. Alarms and cutoff levels for high pressures were set to maximum. For the purpose of this investigation, the level of flow trigging most commonly used in our hospital (bias flow decreased by 1 l/min, called F/5) and five other levels of pressure trigging were used (see above). Changes in ventilator rate and tidal volume were recorded continuously. Mean model airway pressure (PMEAN MA) was calculated from the tracings.
Statistics and data management
Pressures and tidal volumes measured before and after scope/catheter insertion at each given mode, I:E ratio and ETT dimension (n = 12) were analyzed using the statistical package SPSS 15.0 for Windows (SPSS Inc., Chicago, IL, USA). Wilcoxon signed rank test was used to assess possible differences between paired values. Null hypothesis were rejected if two-tailed p-value was < 0.05.
Pressures and volumes measured during suctioning were strongly influenced by the choice of ventilator trigger sensitivity and suction level (due to high frequency ventilator trigging) and therefore unique for each of the 12 permutations.
Results
Due to the large number of permutations included in this study, only data illustrating the most salient points are presented. Effects on model airway pressures and ventilation are described with reference to tables and figures. Conventional ventilator setting (PCV with I:E ratio 1:2 and flowtrigger F/5) applies if not otherwise stated.
A) Effects of suction device insertion
The insertion of suction devices in ETTs reduced peak pressures and tidal volumes, as shown in Table 1 (1) and Figs. 3 and 4 (left panels). In VCV, pressures increased after insertion in ETT 7 mm ID but tidal volumes were unchanged (Figs. 3 and 4, right panels).
Table 1.
Effects of device insertion and suctioning
| (1) Closed catheter insertion (no suction)¤ | |||||
| PPEAK MA | PEEP MA | Vti | Vte | Vti - vte | |
| ETT 9 before | 22 | 6 | 679 | 659 | 20 |
| after | 21 | 6 | 583 | 569 | 14 |
| ETT 8 before | 22 | 6 | 652 | 635 | 17 |
| after | 20 | 6 | 470 | 461 | 9 |
| ETT 7 before | 21 | 6 | 593 | 566 | 27 |
| after | 18 | 7 | 393 | 376 | 17 |
| (2) Closed catheter suctioning (moderate vs. maximum suction pressure)¤ | |||||
| PPEAK MA | PEEP MA | Vti | Vte | Vti - Vte | |
| ETT 9 mod | 20 | 6 | 765 | 331 | 434 |
| max | 17 | 3 | 873 | 226 | 647 |
| ETT 8 mod | 18 | 5 | 623 | 216 | 407 |
| max | 14 | 3 | 660 | 83 | 577 |
| ETT 7 mod | 15 | 4 | 492 | 136 | 356 |
| max | 13 | 5 | 555 | 21 | 534 |
| (3) Bronchoscopic suctioning (moderate vs. maximum suction pressure)¤ | |||||
| PPEAK MA | PEEP MA | Vti | Vte | Vti - Vte | |
| ETT 9 mod | 17 | 4 | 647 | 294 | 353 |
| max | 16 | 4 | 724 | 166 | 558 |
| ETT 8 mod | 15 | 4 | 513 | 177 | 336 |
| max | 13 | 3 | 540 | 52 | 488 |
| ETT 7 mod | 10 | 4 | 286 | 8 | 278 |
| max | 3 | −5 | 389 | 0 | 389 |
| (4) Effect of volume controlled ventilation (closed catheter system, mod. vs. max. suction pressure) | |||||
| PPEAK MA | PEEP MA | Vti | Vte | Vti - Vte | |
| ETT 9 mod | 16 | 5 | 503 | 150 | 353 |
| max | 13 | 4 | 506 | 2 | 504 |
| ETT 8 mod | 16 | 5 | 506 | 139 | 367 |
| max | 11 | 3 | 514 | 0 | 514 |
| ETT 7 mod | 16 | 5 | 507 | 144 | 363 |
| max | 12 | 5 | 517 | 9 | 508 |
| (5) Effect of volume controlled ventilation (bronchoscopic suction, mod. vs. max. suction pressure) | |||||
| PPEAK MA | PEEP MA | Vti | Vte | Vti - Vte | |
| ETT 9 mod | 15 | 4 | 507 | 185 | 322 |
| max | 12 | 3 | 507 | 43 | 464 |
| ETT 8 mod | 15 | 5 | 498 | 164 | 334 |
| max | 13 | 5 | 510 | 13 | 497 |
| ETT 7 mod | 17 | 4 | 499 | 185 | 314 |
| max | 11 | 3 | 498 | 17 | 481 |
¤ = PCV, l:E 1:2, flowtrigger (F/5). Mod.suction = -382 cm H20 (-37.5 kPa). Max.suction = -765 cm H20 (-75 kPa)
The table exemplifies an experiment were a conventional ventilator setting is used; I:E ratio 1:2 and flowtrigger F/5. Model airway pressures and tidal volumes are presented with variations in ETT size, suction device, suction pressure level and ventilation mode (PCV in sections 1–3, VCV in section 4–5)
Fig. 3.
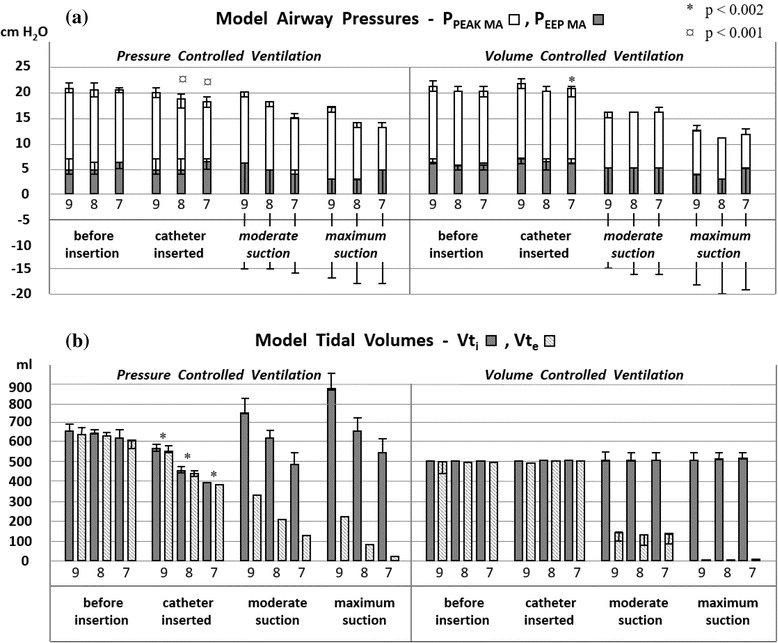
Closed catheter suctioning. Model airway pressures (PPEAK MA and PEEP MA, panel a) and inspiratory/expiratory tidal volumes (panel b) detected by the ventilator (Vti / Vte) are shown during suctioning with closed catheters (14 Fr in 8 and 9 mm ID ETT and 12 Fr in 7 mm ID ETT). Data are from experiments in PCV (left) and VCV (right) with I:E ratio 1:2 and flowtrigger. Measurements with trigger settings P0, P-5, P-10, P-15 and P-20 cm H2O are shown as ranges. The choice of trigger setting and suction level (12 combinations used in this experiment) did not affect measurements prior to suctioning; significant changes from catheter insertion are therefore shown accordingly. During suctioning, however, pressures and volumes were strongly influenced by high frequency ventilator trigging. The dynamics of such trigging depends on the choice of suction pressure and ventilator trigger sensitivity. Pressures and volumes measured during suction were therefore unique for each of the 12 permutations (thus not subject to statistical analysis)
Fig. 4.
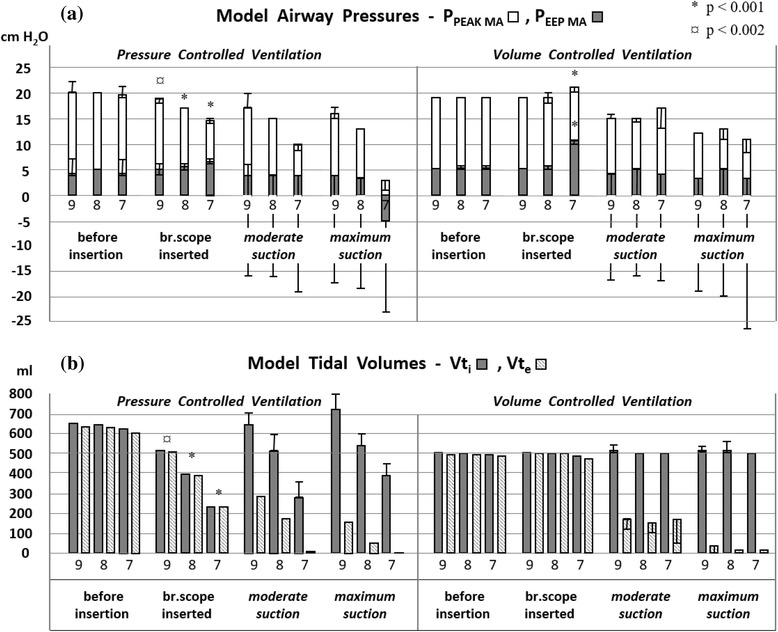
Bronchoscopic suctioning. Bronchoscope insertion and suctioning with altered tube size (ETT 9 mm, 8 mm and 7 mm ID); presented as described in Fig. 3. Bronchoscopic suctioning reduced model airway pressures and tidal volume more than closed catheter suctioning in all ETT sizes, most pronounced in 7 mm ID ETT
B) Effects of suctioning with different ETT sizes
Suctioning through smaller ETTs reduced model airway pressures and tidal volumes, as exemplified in Table 1 (2). A change from 9 to 7 mm ID ETT reduced PPEAK MA and PEEP MA during closed catheter suctioning by 25 % and 33 % respectively. Inspiratory tidal volume (Vti) decreased 35 %.
C) Effects of suction device alteration
Bronchoscopic suctioning reduced model airway pressures and tidal volume more than closed catheter suctioning in all ETT sizes, most pronounced in 7 mm ID ETT, as shown in Table 1 (3), were PPEAK MA was reduced 33 % more by bronchoscopic suctioning. Vti was reduced 42 % more, and Vte 94 % more, than during closed catheter suctioning.
D) Effects of increased suction pressure
The reduction in model airway pressure was more pronounced using maximum vs. moderate suction pressure, exemplified in Table 1 (3). The lowest airway pressures were observed with maximum bronchoscopic suction in a 7 mm ID ETT, giving PPEAK MA and PEEP MA of 3 and −5 cm H2O, respectively, representing 70 % and 225 % reduction compared to moderate suction. Vti increased 36 % when changing from moderate to maximum suction presssue (Table 1 (3)). The total effect of maximum suction compared to normal ventilation (prior to scope insertion) is shown as Δ PPEAK MA and Δ PEEP MA in Fig. 2.
E) Effects of ventilator mode change
Changing from pressure to volume controlled ventilation (VCV) had no dramatic impact on model airway pressures and tidal volumes as long as conventional trigger setting and I:E ratio was used, as shown in Table 1 (4 and 5). VCV contributed more to pressure reduction when suctioning was performed in 9 mm ID ETT. PCV contributed more to pressure reduction when suctioning was performed in ETT 7 mm ID. Vte was reduced more by maximum suction in VCV than in PCV, as shown in Figs. 3 and 4.
F) Effects of inverse I:E ratio
Inverse ratio ventilation (I:E ratio > 1:1) did not dramatically change model airway pressures during bronchoscopic suctioning in PCV, as exemplified in Fig. 5, upper right panel (I:E 3:1, ETT 7 mm ID). Maximum suction increased Vti from 234 to 835 ml and reduced Vte from 216 ml to zero. Much more dramatic effects were seen in VCV, however, as PPEAK MA and PEEP MA escalated immediately after scope insertion and dropped to negative values when maximum suctioning was performed (to −11 cm H2O and −19 cm H2O respectively), as seen in Fig. 5, lower right panel (I:E 3:1, ETT 7 mm ID). Maximum suction increased Vti from 496 ml to 871 ml and reduced Vte from 349 ml to zero.
Fig. 5.
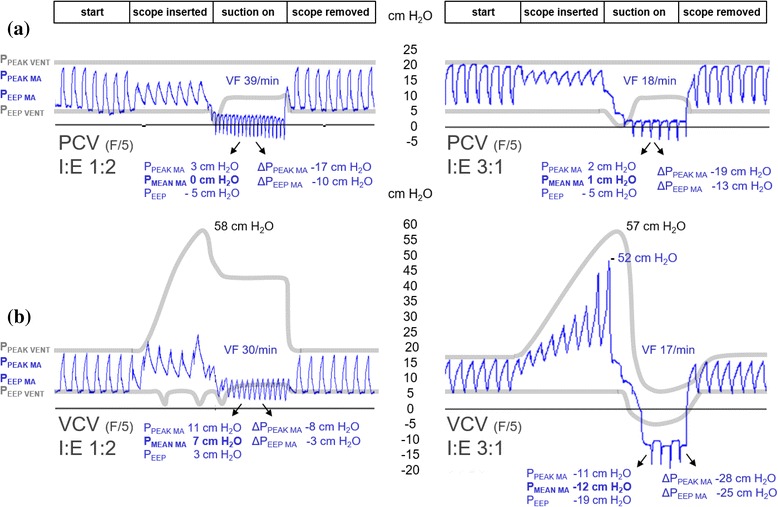
Conventional vs. inverse ratio ventilation. Comparison of conventional (left) and inverse ratio (right) ventilation effects on model airway (PPEAK MA, PEEP MA) and ventilator circuit (PPEAK VENT, PEEP VENT) pressures during and after suctioning with maximum suction pressure (−765 cm H2O (−75 kPa). A 16 Fr bronchoscope was used in a 7 mm ID ETT with flow trigger (F/5) during PCV (panel a) and VCV (panel b), presented as in Fig. 2. Note from the blue tracings that the length of the inspiration phase during suctioning is unchanged, while sensitive triggering reduces the expiratory phase substantially. End-expiratory pressures were underestimated by the ventilator during device insertion (PEEP VENT < PEEP MA) and overestimated during suction (PEEP VENT > PEEP MA)
G) Effects of altered trigger setting
Setting the ventilator to more negative pressure trigger sensitivity, decreased model airway pressures during bronchoscopic suctioning in both PCV and VCV, as seen in Fig. 2 (right panels). The same applied for closed catheter suction. Tidal volumes, however, were practically unchanged by negative trigger setting.
H) Pressure escalation effects (autoPEEP)
In VCV, model airway pressures escalated dramatically when a suction device was inserted in a small-size ETT and throughout the next 30 seconds before suctioning was performed. The effect was most profound when a 16 Fr bronchoscope was inserted in a 7 mm ID ETT, as shown in Fig. 6. The volume of air trapped at end expiration escalated with increased inverse ventilation and gave pressure levels of 75 cm H2O (PPEAK MA) and 25 cm H2O (PEEP MA) 30 seconds after bronchoscope insertion. Suctioning reduced these pressures within ten seconds to clearly negative values. Pressure escalation effects (autoPEEP) were not seen in PCV.
Fig. 6.
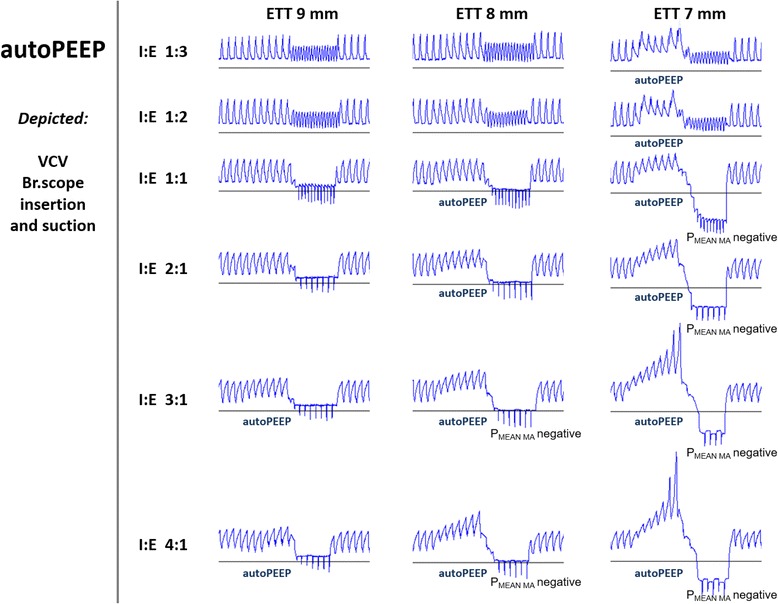
Pressure escalation effects (autoPEEP). Comparison of altered I:E ratios during VCV with three different ETT sizes during insertion of a 16 Fr bronchoscope followed by suction at −765 cm H2O (−75 kPa) with flowtrigger (F/5). Presentation of tracings as in Fig. 2, with initial PPEAK MA 20 cm H2O and PEEP MA 5 cm H2O in all examples. Note that pressures drop to negative values when suctioning is performed with I:E ratio 1:1 and remain unchanged when the ratio is further inversed. Increased end-expiratory pressure (autoPEEP) develops during bronchoscope insertion as a result of progressive air trapping with high resistance and inverse I:E ratio
I) Ventilator and model airway pressure discrepancies
Pressures measured in the ventilator circuit (shown on the ventilator screen) overestimated the actual model airway pressures distal to the ETT when suction devices were inserted and when suctioning was performed. End-expiratory pressures were underestimated during device insertion (PEEP VENT < PEEP MA) and overestimated during suctioning (PEEP VENT > PEEP MA), as seen in Figs. 2 and 5 (grey lines).
J) Effects of high frequency trigging
High frequency trigging was seen during suctioning with commonly used I:E ratios, even in 8 and 9 mm ID ETTs. The most sensitive trigger (F/5) increased ventilator frequency from 15 to 39/min during I:E 1:2 (Fig. 2(b)) and up to 50/min in I:E 1:3.
K) Variables that contribute to pressures reduction and loss of tidal volume
Table 2 summarizes the findings in this bench study with regard to key variables and their impact on reduction of model airway pressures and tidal volumes during ETT suctioning.
Table 2.
Key variables and their effects on model airway pressure and tidal volume
| SUCTION EFFECT VARIABLES | Model airway pressure reduction | Tidal volume reduction |
|---|---|---|
| ETT size reduction | Strong impact | Strong impact |
| Suction device alteration | Bronchoscope > Closed catheter | Bronchoscope > Closed catheter |
| Increased suction pressure | Strong impact | Vte reduced |
| Ventilator PCV - > VCV | Moderate impact (ETT size dependent) | Vti unchanged, Vte reduced |
| Inverse ratio ventilation | Strong impact in VCV (not PCV) | Vti increased |
| Negative trigger sensitivity | Strong impact | Minor impact on Vti and Vte |
The variables are listed according to their impact on the reduction of model airway pressure and tidal volume during suctioning
An Additional file 1 with more data from this bench test is available in the online version of the article.
Discussion
The effects of insertion and use of suction devices distal to ETTs have been examined in prior studies [3, 9]. No one, however, have previously studied to what extent different combinations of suction devices, suctioning pressure levels, and ventilator settings change airway pressures during suction procedures. The use of a lung model for this type of investigation has limitations, the major being that reduced gas volume in patient airways may lead to small airway collapse and therefore a more modest pressure reduction in vivo while increased air trapping could expand the small airways, which would ameliorate pressure increases. Also, the accumulation of secretions in the ETT lumen may reduce its effective inner diameter and enhance negative effects of both device insertion and suctioning in patients [10]. On the other hand, using an artificial lung model makes it possible to systematically record and compare the effects of variations in tube size, suction pressure levels, suction devices and ventilator settings to an extent that would be impossible in patient studies.
Effects of partial ETT obstruction
The relative proportions between the outer diameter of suction devices and the inner dimensions and lengths of artificial airways determine, to a large extent, the relative obstruction of the ETT lumen and thus the effect on distal airway pressures during suction procedures. Current AARC (American Association for Respiratory Care) clinical practice guidelines suggest that suction catheters should occlude less than 50 % of the lumen of the endotracheal tube in children and adults [1], but there is a considerable discrepancy between guidelines and clinical practice [11]. The guidelines also suggest that suction pressure should be set as low as possible and yet high enough to effectively clear secretions. Commonly used ETT dimensions are 8 to 9 mm ID in males, 7 to 8 mm ID in females and even smaller in youth and children. A bronchoscope has a larger outer diameter but a smaller suction channel than suction catheters; as these factors may interact in determining changes in airway pressure during suctioning procedures, both devices were subject to investigation in this study.
The pressure changes seen in this bench test when ETT dimension was reduced from 8 to 7 mm ID (contrary to shifts from 9 to 8 mm) are to be expected from Poiseuille's Law in which R = 8lŋ/ π r4 (R = resistance, l = length of the tube, ŋ = gas viscosity and r = the radius of the tube). Changes to the radius will, by virtue of its elevation to the fourth power, have a strong impact on the resistance; if the tube diameter is reduced to its half, resistance will increase by a factor of sixteen. The equation, however, is not applicable to turbulent flow in which resistance is more profound than in laminar flow. The friction generated by the luminal tube wall and its secretions will also create turbulence, and the insertion of suction devices complicates resistance calculations further. It is clear from the results presented in this study, however, that ETT size does have a major impact on airway pressure and tidal volume, and that the choice of suction device and suction pressure also matters, as summarized in Table 2.
Effects of ventilator setting and flow
The VCV mode has impact on model airway pressure loss during suctioning. Even if suction is not performed, device insertion in this mode contributes to pressure escalation (autoPEEP). As the ventilator uses the pressure necessary to force a preset tidal volume past the obstruction, a shorter expiration phase (as in inverse ratio ventilation) will reduce the expired volume and increase air trapping.
During PCV, the inspiratory flow decreases as the airway resistance increases, which reduces the tidal volume delivered to distal airways. This may explain why some studies suggest that ETT obstruction influences lung volume loss more than suction pressure in PCV [12]. Even if not tested in our study, compressible gas flow models indicate that no matter the driving pressure, flow will eventually approach (though never fully reach) an upper limit in all constricted tubes.
Effects of high frequency trigging and inverse I:E ratio
Most ventilators can be configured to deliver a wide range of I:E ratios and allow for triggering of additional inspirations to be initiated either by a reduction in bias flow through the ventilator circuit (flow trigger) or a reduction in circuit pressure (pressure trigger), at the discretion of users. In our model, high frequency trigging was seen during suctioning with commonly used ventilator settings, but not when large ETTs (8 or 9 mm ID) were combined with inverse I:E ratio (3:1, 4:1) or negative pressure trigger settings. During prolonged inspiration (inverse I:E ratio 1:1–4:1) much of the air volume lost during suctioning was compensated for in PCV due to a high ventilator flow capacity (198 l/min - 3,3 l/sec), which is well above suction flow.
Clinical considerations
The dramatic pressure changes seen when ETT dimension is reduced from 8 to 7 mm ID, suggests that clinicians should use the largest ETT possible in patients, as a precaution against negative airway pressures when long-lasting suction procedures are performed (as in bronchoscopic suctioning). Larger ETT diameter will also prevent loss of PEEP/recruitment which may otherwise induce atelectasis [2] and other potential hazards [3–5]. Examination of model lungs with different compliances would help to address this issue, and more research is therefore needed.
In a real life ICU setting, removal of pulmonary secretions may be needed several times a day; changing ETT size or suction device in between procedures is therefore not really an option. The parameters that could more easily be changed prior to endotracheal suctioning are ventilator mode, I:E ratio and trigger sensitivity. Unfortunately, changes to these parameters do not seem to counteract unwanted pressure- and volume effects very effectively. On the contrary, it may very well worsen the patient’s condition if wrong choices are made. In our model, positive flow trigger (F/5) and I:E ratio < 1 clearly prevented dramatic changes to airway pressures and ventilation during suctioning. Device insertion contributed to more pressure escalation in VCV compared to PCV. During suctioning, VCV contributed to more pressure reduction when ETT 9 mm ID was used, and PCV contributed more to pressure reduction when ETT 7 mm ID was used.
Conclusions
The variables that contributed most to negative model airway pressures and loss of tidal volume during suctioning were (in descending order):
Small size ETTs (7 mm ID) combined with large diameter suction devices (14–16 Fr).
Inverse I:E ratio ventilation (in VCV).
Negative ventilator trigger sensitivity.
Strong suction pressure.
Conventional ventilator settings ameliorate pressure- and volume changes during both device insertion and suctioning, and seem beneficial also in real life situations.
Abbreviations
ARDS, acute respiratory distress syndrome; AutoPEEP, increased end-expiratory pressure due to progressive air trapping (as a result of increased expiratory resistance); bpm, beats per minute; ETT, endotracheal tube; Fr, Ch = French (1 Fr = a diameter of 1/3 mm); FRC, functional residual capacity; ICU, intensive care unit; ID, internal diameter; MA, model airways; PCV, pressure controlled ventilation; PEEP, positive end-expiratory pressure; PEEP MA, end-expiratory pressure in model airways (distal to ETT); PPEAK MA, peak pressure in model airways (distal to ETT); RT, rise time; VCV, volume controlled ventilation; VF, ventilator frequency; Vte, expiratory tidal volume; Vti, inspiratory tidal volume
Acknowledgements
Department of Acute Medicine and the Department of Pulmonary Medicine at Oslo University Hospital.
Funding
No funding was obtained for this study.
Availability of data and materials
A supplementary file containing data from all pressure and volume registrations is enclosed.
Authors’ contributions
HO conceived the idea (together with ERN), helped design the study, participated in pre-test measurements and worked extensively on manuscript and figure texts. FH participated in pre-test measurements and experimental procedures, did revision of the manuscript and contributed to statistical work. FB helped design the study, was involved the interpretation of pre-test measurements and participated in the revision of the manuscript. OHS helped design the study, worked on the manuscript and did thorough revision of all text and figure legends. ERN (corresponding author) designed the study, made modifications to the lung model, did pre-test measurements, carried out all experimental procedures, performed statistical analysis, drafted the manuscript and produced figures and legends. All authors read and approved the final manuscript.
Competing interests
The authors declare that they have no competing interests.
Ethics approval and consent to participate
No patients or biological samples were included in this study. Ethics approval was therefore not required. This complies with national guidelines: https://helseforskning.etikkom.no/ikbViewer/page/forside?_ikbLanguageCode=us.
Additional file
RR (Ventilator frequency), Vti (insp.tidal volume), Vte (exp. tidal volume), MVe (minute ventilaton), Pinsp (= PPEAK ventilator), Pmean (= PMEAN ventilator), Ventilator PEEP (= PEEP ventilator), Distal transducer Pinsp (= PPEAK model airways), Distal transducer PEEP (= PEEP model airways). Data are presented for each of the permutations listed in the methods section; before scope/catheter insertion (30 sec), after insertion (30 sec), during suctioning (30 sec) and after removal of the device (30 sec). Calculations are also listed in separate columns. (XLSX 522 kb)
Footnotes
Electronic supplementary material
The online version of this article (doi:10.1186/s12871-016-0196-z) contains supplementary material, which is available to authorized users.
References
- 1.AARC Clinical Practice Guidelines Endotracheal suctioning of mechanically ventilated patients with artificial airways 2010. Respir Care. 2010;55(6):758–64. [PubMed] [Google Scholar]
- 2.Liu XW, Liu Z. [The effects of endotracheal suction on gas exchange and respiratory mechanics in mechanically ventilated patients under pressure-controlled or volume-controlled ventilation] Zhonghua Jie He He Hu Xi Za Zhi. 2007;30(10):751–5. [PubMed] [Google Scholar]
- 3.Lindgren S, Odenstedt H, Erlandsson K, Grivans C, Lundin S, Stenqvist O. Bronchoscopic suctioning may cause lung collapse: a lung model and clinical evaluation. Acta Anaesthesiol Scand. 2008;52(2):209–18. doi: 10.1111/j.1399-6576.2007.01499.x. [DOI] [PubMed] [Google Scholar]
- 4.Bourgault AM, Brown CA, Hains SM, Parlow JL. Effects of endotracheal tube suctioning on arterial oxygen tension and heart rate variability. Biol Res Nurs. 2006;7(4):268–78. doi: 10.1177/1099800405285258. [DOI] [PubMed] [Google Scholar]
- 5.Walsh JM, Vanderwarf C, Hoscheit D, Fahey PJ. Unsuspected hemodynamic alterations during endotracheal suctioning. Chest. 1989;95(1):162–5. doi: 10.1378/chest.95.1.162. [DOI] [PubMed] [Google Scholar]
- 6.Nakstad ER, Opdahl H, Skjonsberg OH, Borchsenius F. Intrabronchial airway pressures in intubated patients during bronchoscopy under volume controlled and pressure controlled ventilation. Anaesth Intensive Care. 2011;39(3):431–9. doi: 10.1177/0310057X1103900314. [DOI] [PubMed] [Google Scholar]
- 7.Bikker IG, van Bommel J, Reis Miranda D, Bakker J, Gommers D. End-expiratory lung volume during mechanical ventilation: a comparison with reference values and the effect of positive end-expiratory pressure in intensive care unit patients with different lung conditions. Critical Care (London, England) 2008;12(6):R145. doi: 10.1186/cc7125. [DOI] [PMC free article] [PubMed] [Google Scholar]
- 8.Palazzo SG, Soni B. Pressure changes during tracheal suctioning--a laboratory study. Anaesthesia. 2013;68(6):576–84. doi: 10.1111/anae.12218. [DOI] [PubMed] [Google Scholar]
- 9.Almgren B, Wickerts CJ, Heinonen E, Hogman M. Side effects of endotracheal suction in pressure- and volume-controlled ventilation. Chest. 2004;125(3):1077–80. doi: 10.1378/chest.125.3.1077. [DOI] [PubMed] [Google Scholar]
- 10.Glass C, Grap MJ, Sessler CN. Endotracheal tube narrowing after closed-system suctioning: prevalence and risk factors. Am J Crit Care. 1999;8(2):93–100. [PubMed] [Google Scholar]
- 11.Beuret P, Roux C, Constan A, Mercat A, Brochard L. Discrepancy between guidelines and practice of tracheal suctioning in mechanically ventilated patients: a French multicenter observational study. Intensive Care Med. 2013;39(7):1335–6. doi: 10.1007/s00134-013-2936-6. [DOI] [PubMed] [Google Scholar]
- 12.Copnell B, Dargaville PA, Ryan EM, Kiraly NJ, Chin LO, Mills JF, Tingay DG. The effect of suction method, catheter size, and suction pressure on lung volume changes during endotracheal suction in piglets. Pediatr Res. 2009;66(4):405–10. doi: 10.1203/PDR.0b013e3181b337b9. [DOI] [PubMed] [Google Scholar]
Associated Data
This section collects any data citations, data availability statements, or supplementary materials included in this article.
Data Availability Statement
A supplementary file containing data from all pressure and volume registrations is enclosed.


