

Abstract
Inflammatory markers are important prognostic factors in various cancers. This study investigated whether inflammatory markers of the Glasgow prognostic score (GPS) predicted progression‐free survival (PFS) and overall survival (OS) for patients with all cases of epithelial ovarian cancer (OC). Pretreatment GPS was examined for the correlations with PFS and OS in 216 patients in all stages of epithelial OC. Statistical analyses were performed using the Mann–Whitney U‐test. PFS and OS were analyzed using the Kaplan–Meier method. Cox's proportional hazard regression was used for univariate and multivariate analyses. For all patients, the median PFS was 35.1 months, and median OS was 46.7 months; follow‐up range was 1–162 months. Kaplan–Meier analysis revealed that patients with high GPS (GPS 2) at pretreatment had a shorter PFS and OS than did patients with lower GPS (GPS 0 + 1) in for early, advanced, and all‐stages of OC (PFS: P < 0.001 for early‐, advanced‐ and all‐stages; OS; P < 0.001 for early‐ and all‐stage, P = 0.015 for advanced‐stage). GPS (GPS 2) was also found to be an independent predictor of both recurrence (P = 0.002) and survival (P = 0.001) of all cases of epithelial OC by a multivariate analysis. GPS can serve as an indicator of poor prognosis in patients with all stages of epithelial OC, including early‐stage disease and regardless of histology.
Keywords: Glasgow prognostic score, ovarian cancer, predictor for poor
Introduction
Ovarian cancer (OC) is the second most common gynecological malignancy in the United States; it accounted for about 21,500 new cases of cancer and 14,600 deaths in the United States in 2009 1. In Japan, 8000 cases of OC are newly diagnosed and more than 4000 women die of the disease every year 2. Its 5‐year survival rate is inversely related to the disease stage at first diagnosis. Although the 5‐year survival rate for stage I disease is 92.7%, most cases (67–74%) are diagnosed with metastatic disease (stage III–IV), which has a 5‐year survival rate of only 30.6% 3. Known prognostic factors for OC include residual tumor and chemotherapy response 4, 5, but these parameters are not sufficient to predict accurate OC prognoses. Therefore, a new approach for pretreatment assessment of OC is pivotal in improving outcomes.
Inflammatory markers are important prognostic factors for survival in various cancer types. C‐reactive protein (CRP) and albumin play prominent roles in tumor inflammation 6, 7, 8. Reportedly, inflammation‐based prognostic scores, including the Glasgow prognostic score (GPS)—a combination of CRP and albumin levels—is associated with survival in various cancers, including lung, breast, esophagus, stomach, pancreas, kidney, and colorectal cancers 9, 10, 11, 12, 13, 14, 15. Although data on survival outcomes has in advanced OC has been published 16, patients with early‐stage OCs have not been sufficiently investigated. In this study, we investigated the correlation between pretreatment GPS and prognosis of patients with all stages of OC including those with early‐stage epithelial OC.
Methods
Study population
This retrospective study reviewed medical records of 216 patients with different stages (stages I–IV) of epithelial OC who were treated at the Department of Obstetrics and Gynecology of Okayama University Hospital between January 2002 and July 2015. The study protocol was approved by the Institutional Review Board of Okayama University Hospital. All patients gave informed consent. Staging of disease was done according to the FIGO criteria for ovarian carcinoma. All 216 patients had to have a diagnosis of stage on the basis of imaging or surgical finding. The use of computed tomography (CT)/positron emission tomography/CT (PET‐CT) to locate tumor deposits before debulking surgery has become standard practice. An attempt is made to identify signs of transdiaphragmatic tumor spread, such as diffuse peritoneal thickening, large‐volume ascites, large bowel involvement, diaphragmatic disease, splenic involvement, hepatic involvement, bulky omental disease, pleural space/extra‐abdominal disease, on chest, and abdominal CT/PET‐CT images because their presence may have a substantial effect on further management. Lymph node with short‐axis lengths >10.0 mm were defined as metastatic with CT/PET‐CT in the interval debulking surgery (IDS) group. The amount of ascites >500 mL was defined as present in the both Primary debulking surgery (PDS) and IDS group 17, 18.
PDS was performed if in the opinion of the multidisciplinary team, consisting of gynecologic oncologists, medical oncologists, and a dedicated radiologist, debulking surgery of all visible tumor to less than one centimeter in diameter was possible. Every operative cytoreductive procedure was performed with the aim of leaving complete resection with no residual tumor (R0). All PDS cases were successfully performed R0. Patients with more extensive disease and those unable to undergo surgery started neoadjuvant chemotherapy. Patients who underwent exploratory laparotomy for diagnostic biopsy or oophorectomy without debulking were analysed in the IDS group. Surgical resection was classified as curative (R0, complete resection with no residual tumor) or noncurative (R1 or R2, microscopic or gross residual tumor) on IDS group. Patients who underwent PDS were then treated with or without 3–6 cycles of standard chemotherapy (n = 115), including 3–6 cycles of neoadjuvant chemotherapy with IDS followed by 2–3 cycles of adjuvant chemotherapy (n = 91). All (early‐and advanced‐stage) of the patients underwent a laparotomy for total abdominal hysterectomy, bilateral salpingo‐oophorectomy and omentectomy with or without pelvic and/or para‐aortic lymphadenectomy. Pelvic lymph node (PLN) dissection included the right and left common iliac, external iliac, suprainguinal, internal iliac, obturator, sacral, and parametrial nodal chains. Para‐aortic lymph node (PAN) dissection included the nodes located from the bifurcation of the aorta to the level of the renal vein.
Laboratory data collection
All subjects had serum albumin, CRP, and CA125 levels recorded within 1 week before their treatments. Levels of serum albumin and CRP were measured using latex nephelometry (LT Auto Wako, Osaka, Japan). Serum CA125 level was measured with electrochemiluminescence immunoassay on the Roche/Hitachi Modular Analysis E170 (Roche Diagnostics, Tokyo, Japan). GPS was estimated as described previously 9. Briefly, the high GPS group included patients with GPS 2: both CRP levels >1.0 mg/dL and hypoalbuminemia (<3.5 g/dL). The low GPS group included patients with only one of these abnormal levels (GPS 1) or none of these abnormalities (GPS 0).
Statistical analysis
Statistical analyses were performed using the Mann–Whitney U‐test for comparisons with controls. Progression‐free survival (PFS) and overall survival (OS) of the groups were analyzed using the Kaplan–Meier method. Differences between the recurrence and survival curves were examined using the log‐rank test. We performed univariate and multivariate analyses using Cox's proportional hazards model to determine which factors predict PFS and OS after adjusting for effects of known prognostic factors. Analyses were performed using SPSS software version 20.0 (SPSS Inc., Chicago, IL). P < 0.05 was considered statistically significant.
Results
The patients were aged 16–81 years (median: 61.0 years); their median pretreatment CRP: 3.5 mg/dL (range: 0–54.34 mg/dL); albumin: 3.22 g/dL (2.3–4.8 g/dL); and CA125: 307.6 U/mL (6.4–22594 U/mL). Patients’ ages, FIGO stage, histology, lymph node metastasis, lymphadenectomy, no residual tumor (R0) and neoadjuvant chemotherapy are shown in Table 1.
Table 1.
Patient and tumor characteristics
| Baseline characteristics | All patients | |
|---|---|---|
| Age at diagnosis, y | Mean, 61.0; range, 16–81 | |
| Numbers | N (%) | |
| Stage | ||
| I | 87 | 40.3 |
| II | 15 | 6.9 |
| III | 88 | 40.7 |
| IV | 26 | 12.1 |
| Histology | ||
| Serous adenocarcinoma | 113 | 52.3 |
| Clear cell carcinoma | 31 | 14.4 |
| Mucinous adenocarcinoma | 25 | 11.6 |
| Endometrioid adenocarcinoma | 26 | 12 |
| Other carcinoma | 5 | 2.3 |
| Mixed type carcinoma | 16 | 7.4 |
| Lymph node metastasis | ||
| Absent | 144 | 66.7 |
| Present | 72 | 33.3 |
| Lymphadenectomy | ||
| Absent | 130 | 60.2 |
| Present | 86 | 39.8 |
| Macroscopic tumor free (R0) | ||
| Absent | 17 | 7.9 |
| Ascites | ||
| Absent | 181 | 83.8 |
| Present | 35 | 16.2 |
| Neoadjuvant chemotherapy | ||
| Absent | 125 | 57.9 |
| Present | 91 | 42.1 |
We examined pretreatment GPS in patients with early‐ and/or advanced‐stage epithelial OC. Their pretreatment GPS were GPS 0: 127 patients (58.8%); GPS 1: 55 (25.4%); GPS 2: 34 (15.8%). The cut‐off value for the CA125 level determined from the median values was 307.6 U/mL, respectively. We also found pretreatment GPS was significantly associated with stage (P < 0.001), histology (P = 0.001), lymph node metastasis (P < 0.001), lymphadenectomy (P < 0.001), no residual tumor (R0) (P = 0.006), ascites (P < 0.001), neoadjuvant chemotherapy (P < 0.001), and CA125 (P < 0.001) (Mann–Whitney U‐test, P < 0.05; Table 2).
Table 2.
Associations of GPS with clinical factors on ovarian cancer
| Variable | Numbers of GPS 0 | Numbers of GPS 1 | Numbers of GPS 2 | P‐value |
|---|---|---|---|---|
| Stage | <0.001a | |||
| I–II | 77 | 20 | 5 | |
| III–IV | 50 | 35 | 29 | |
| Histology | 0.001a | |||
| Serous adenocarcinoma | 55 | 31 | 27 | |
| Non‐Serous adenocarcinoma | 72 | 24 | 7 | |
| Lymph node metastasis | <0.001a | |||
| Absent | 103 | 27 | 14 | |
| Present | 24 | 28 | 20 | |
| Lymphadenectomy | <0.001a | |||
| Absent | 85 | 27 | 18 | |
| Present | 42 | 28 | 16 | |
| No residual tumor (R0) | 0.006a | |||
| Absent | 4 | 7 | 6 | |
| Present | 123 | 48 | 28 | |
| Ascites | <0.001a | |||
| Absent | 123 | 40 | 18 | |
| Present | 4 | 15 | 16 | |
| Neoadjuvant chemotherapy | <0.001a | |||
| Absent | 95 | 22 | 8 | |
| Present | 32 | 33 | 26 | |
| CA125 | <0.001a | |||
| ≤307.6 U/mL | 85 | 19 | 4 | |
| >307.6 U/mL | 42 | 36 | 30 | |
GPS, glasgow prognostic score.
P < 0.05.
Patients had follow‐up examinations approximately every 1–2 months for first 6 months, every 3 months for next 2 years, and every 6 months thereafter. For all patients, median PFS was 35.1 months OS was 46.7 months; follow‐up range was 1–162 months (for both OS and PFS). At the time of last follow‐up, 124 patients were alive with no evidence of disease, 69 patients had died of the disease, and 23 patients were alive with disease. Figure 1 shows the PFS and OS curves for the 216 patients with OC, according to their GPS at pretreatment. The Kaplan–Meier curves showed that the PFS and OS for patients with high pretreatment GPS (GPS 2) were shorter than for patients with lower GPS (GPS 0 + 1) for early‐, advanced‐ and all‐stage OC (OS: P < 0.001 for early‐ and all‐stage, P = 0.015 for advanced‐stage; PFS: P < 0.001 for all three stage groups; Fig. 1).
Figure 1.
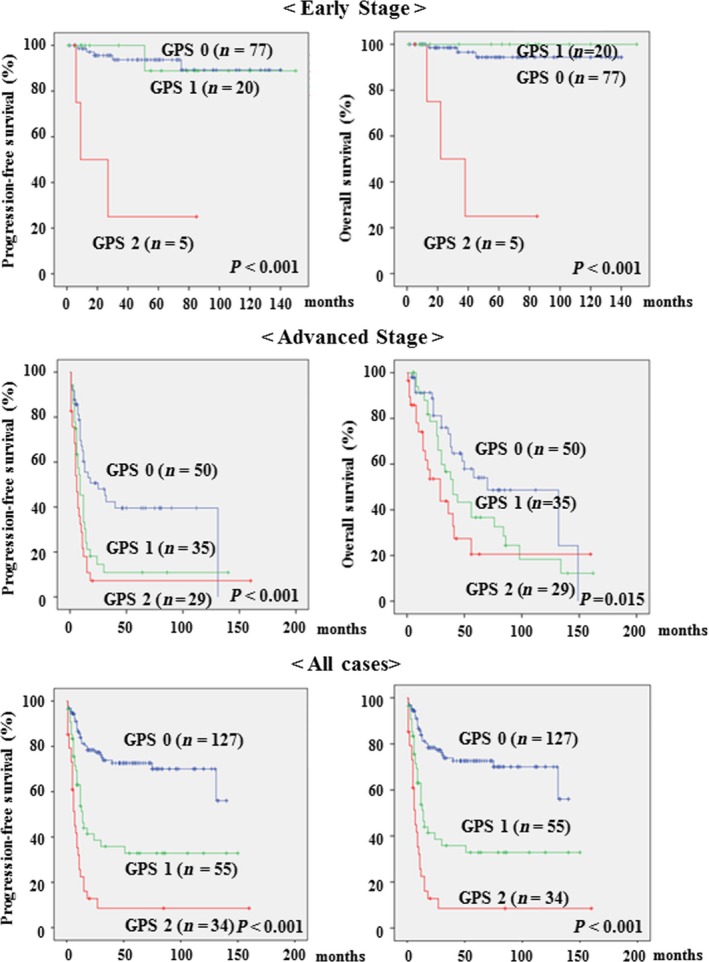
Kaplan–Meier curves for progression‐free survival and overall survival (OS) rates of 216 patients with ovarian cancer (OC) according to their Glasgow prognostic score (GPS) at pretreatment. Early stage (Stages I–II): GPS score 0 (n = 77); GPS 1 (n = 20); GPS 2 (n = 5): Advanced stage (Stages III–IV): GPS score 0 (n = 50); GPS 1 (n = 35); GPS 2 (n = 29): All cases of OC (Stages I–IV); GPS score 0 (n = 127); GPS 1 (n = 55); GPS 2 (n = 34).
The correlations between clinical factors and PFS or OS were assessed in univariate and multivariate analyses on early‐, advanced‐stage (Table 3) and all‐stage (Table 4). In univariate analysis of PFS, histology (P = 0.033) and GPS (P < 0.001) were significantly associated with PFS in early‐stage OC; whereas CA125 (P = 0.002), neoadjuvant chemotherapy (P = 0.022), lymphadenectomy (P = 0.024), and GPS (P = 0.001) were significantly associated with PFS in advanced‐stage OC. Furthermore, CA125, lymph node metastasis, no residual tumor (R0), ascites, neoadjuvant chemotherapy, histology, stage, lymphadenectomy, and GPS (P < 0.001 for all) were significantly associated with PFS in the all‐stage OC grouping. Univariate analysis showed GPS to be significantly associated with OS in early‐stage OC (P < 0.001); whereas no residual tumor (R0) (P = 0.005), lymphadenectomy (P = 0.047) and GPS (P = 0.015) were significantly associated with OS in advanced‐stage OC. We also found CA125, lymph node metastasis, no residual tumor (R0), ascites, neoadjuvant chemotherapy, histology, stage, lymphadenectomy, GPS were significantly associated with OS in all‐stage OC (P < 0.001 for all).
Table 3.
Prognostic factors for progression‐free survival and overall survival with early‐ and advanced‐stage of ovarian cancer selected by Cox's univariate and multivariate analysis
| Univariate analysis | Multivariate analysis | |||||
|---|---|---|---|---|---|---|
| Haza ratio | 95% CI | P‐value | Hazard ratio | 95% CI | P‐value | |
| Progression‐free survival | ||||||
| Early Stage (Stage I–II) | ||||||
| CA125 (≥307.6 U/mL) | 2.617 | 0.701–9.767 | 0.152 | |||
| Histology | 4.199 | 1.121–15.722 | 0.033a | 5.072 | 1.272–20.223 | 0.021a |
| Lymphadenectomy | 1.238 | 0.310–4.951 | 0.763 | |||
| GPS | 16.874 | 4.173–68.233 | <0.001a | 20.501 | 4.709–89.240 | <0.001a |
| Advance Stage (Stage III–IV) | ||||||
| CA125 (≥307.6 U/mL) | 2.55 | 1.401–4.639 | 0.002a | 2.107 | 1.140–3.893 | 0.017a |
| Lymph node metastasis | 1.386 | 0.878–2.188 | 0.161 | |||
| No residual tumor (R0) | 1.635 | 0.919–2.911 | 0.095 | |||
| Ascites | 1.561 | 0.991–2.459 | 0.055 | |||
| Neoadjuvant chemotherapy | 2.116 | 1.114–4.020 | 0.022a | 1.95 | 1.016–3.739 | 0.045a |
| Histology | 1.294 | 0.563–2.973 | 0.544 | |||
| Lymphadenectomy | 1.659 | 1.070–2.570 | 0.024a | 1.691 | 1.088–2.630 | 0.020a |
| GPS | 2.247 | 1.400–3.608 | 0.001a | 2.015 | 1.238–3.279 | 0.005a |
| Overall Survival | ||||||
| Early Stage (Stage I–II) | ||||||
| CA125 (≥307.6 U/mL) | 3.019 | 0.609–14.965 | 0.176 | |||
| Histology | 2.326 | 0.426–12.704 | 0.33 | |||
| Lymphadenectomy | 1.281 | 0.234–7.010 | 0.775 | |||
| GPS | 28.21 | 5.586–142.468 | <0.001a | |||
| Advance Stage (Stage III–IV) | ||||||
| CA125 (≥307.6 U/mL) | 1.839 | 0.935–3.620 | 0.078 | |||
| Lymph node metastasis | 1.642 | 0.948–2.843 | 0.077 | |||
| No residual tumor (R0) | 2.419 | 1.303–4.429 | 0.005a | 2.266 | 1.191–4.310 | 0.013a |
| Ascites | 1.37 | 0.807–2.325 | 0.244 | |||
| Neoadjuvant chemotherapy | 2.021 | 0.951–4.295 | 0.067 | |||
| Histology | 0.921 | 0.333–2.550 | 0.874 | |||
| Lymphadenectomy | 1.663 | 1.006–2.749 | 0.047a | 1.626 | 0.958–2.759 | 0.071 |
| GPS | 1.996 | 1.147–3.475 | 0.015a | 2.331 | 1.317–4.127 | 0.004a |
GPS, glasgow prognostic score.
P < 0.05.
Table 4.
Prognostic factors for progression‐free survival and overall survival with all stage of ovarian cancer selected by Cox's univariate and multivariate analysis
| Univariate analysis | Multivariate analysis | |||||
|---|---|---|---|---|---|---|
| Hazard ratio | 95% CI | P‐value | Hazard ratio | 95% CI | P‐value | |
| Progression‐free survival | ||||||
| CA125 (≥307.6 U/mL) | 5.882 | 3.505–9.874 | <0.001a | 1.921 | 1.073–3.439 | 0.028a |
| Lymph node metastasis | 4.812 | 3.154–7.340 | <0.001a | 1.654 | 1.022–2.677 | 0.040a |
| No residual tumor (R0) | 3.721 | 2.096–6.607 | <0.001a | 1.15 | 0.620–2.134 | 0.658 |
| Ascites | 3.947 | 2.521–6.178 | <0.001a | 1.291 | 0.781–2.134 | 0.319 |
| Neoadjuvant chemotherapy | 8.623 | 5.202–14.295 | <0.001a | 2.041 | 1.046–3.982 | 0.036a |
| Histology | 8.643 | 4.591–16.271 | <0.001a | 1.977 | 0.818–4.777 | 0.13 |
| Stage | 14.074 | 7.043–28.124 | <0.001a | 2.064 | 0.634–6.723 | 0.229 |
| Lymphadenectomy | 2.053 | 1.362–3.094 | <0.001a | 1.944 | 1.254–3.014 | 0.003a |
| GPS | 4.717 | 3.003–7.408 | <0.001a | 2.158 | 1.325–3.514 | 0.002a |
| Overall Survival | ||||||
| CA125 (≥307.6 U/mL) | 4.526 | 2.473–8.284 | <0.001a | 1.366 | 0.683–2.735 | 0.374 |
| Lymph node metastasis | 4.585 | 2.785–7.549 | <0.001a | 1.3548 | 0.762–2.421 | 0.3 |
| No residual tumor (R0) | 4.83 | 2.624–8.891 | <0.001a | 2.296 | 1.147–4.597 | 0.019a |
| Ascites | 2.966 | 1.766–4.979 | <0.001a | 0.929 | 0.501–1.720 | 0.814 |
| Neoadjuvant chemotherapy | 6.685 | 3.704–12.065 | <0.001a | 1.838 | 0.832–4.059 | 0.132 |
| Histology | 6.431 | 3.074–13.454 | <0.001a | 1.582 | 0.559–4.476 | 0.388 |
| Stage | 11.451 | 4.948–26.501 | <0.001a | 2.417 | 0.590–9.907 | 0.22 |
| Lymphadenectomy | 2.113 | 1.315–3.396 | <0.001a | 1.6 | 0.967–2.648 | 0.067 |
| GPS | 4.051 | 2.405–6.822 | <0.001a | 2.685 | 1.482–4.865 | 0.001a |
GPS, glasgow prognostic score.
P < 0.05.
In multivariate analysis, histology (P = 0.021) and GPS (P < 0.001) were significantly associated with PFS in early‐stage OC. CA125 (P = 0.017), neoadjuvant chemotherapy (P = 0.045), lymphadenectomy (P = 0.020) and GPS (P = 0.005) were significantly associated with PFS in advanced‐stage OC. Furthermore, CA125 (P = 0.028), lymph node metastasis (P = 0.040), neoadjuvant chemotherapy (P = 0.036), lymphadenectomy (P = 0.003), and GPS (P = 0.002) were significantly associated with PFS in all‐stage OC. Multivariate analysis of OS results showed no residual tumor (R0) (P = 0.013) and GPS (P = 0.004) are significantly associated with OS in advanced‐stage OC; and no residual tumor (R0) (P = 0.019) and GPS (P = 0.001) were significantly associated with OS in advanced‐stage of OCs. In particular, the multivariate analysis showed GPS to be independent predictors of recurrence and survival in patients with OC.
Discussion
The known prognostic factors for OC include residual tumor and chemotherapy response 4, 5. Inflammatory markers such as GPS are important prognostic factors in various cancers. This is the first study to evaluate whether high pretreatment GPS predicts poor prognosis for patients with epithelial OC, including those with early‐stage disease.
Increased CRP may be due to the production of inflammation‐related cytokines such as vascular endothelial growth factor and interleukin (IL)‐6 19, 20. Hefler and colleagues reported that OC patients with low CRP (≤1.0 mg/dL) had significantly better prognoses than those with elevated CRP (>1.0 mg/dL) 21. Hypoalbuminemia is often observed in patients with advanced cancer, and is usually regarded as a marker for malnutrition and cachexia. The low albumin concentration is accordance with proinflammatory cytokines such as IL‐1, IL‐6, and Tumor Necrosis Factor, which modulate albumin production 22, 23. The mechanisms that potentially underlie the relationship between hypoalbuminemia and poor prognosis are similar to those described above for CRP. Reportedly, albumin participates in systemic inflammatory responses and is a prognostic factor for shorter long term survival in patients with various cancer types 24. Warwick and colleagues reported that OC patients with low albumin (<3.5 g/dL) had significantly poorer prognoses than those with an elevated albumin (≥3.5 g/dL) 25. The combination of CRP and albumin in the GPS may reflect both the presence of a systemic inflammatory response and progressive nutritional decline in cancer patients. Sharma and colleagues reported that high GPS is a predictor of poor prognosis for patients with advanced‐stage epithelial OC 16. We investigated whether pretreatment clinical characteristics were correlated with GPS at any stage of OC, and found that pretreatment GPS was significantly associated with stage, histology, lymph node metastasis, macroscopic tumor free (R0), ascites, neoadjuvant chemotherapy and CA125 at all disease stages.
This study investigated whether inflammatory markers of the GPS predicted PFS and OS for patients with all cases of epithelial OC. The median PFS and OS of the high‐GPS patients were significantly shorter than for the low‐GPS group, for early‐, advanced‐ and all‐stage OC. Moreover, multivariate analysis of our study population showed that high pretreatment GPS independently predicted shorter PFS in early‐, advanced‐ and all‐stage OC; and shorter OS in advanced‐ and all‐stage OC. Therefore, determination of GPS at pretreatment may be useful in projecting prognosis of patients at all stages of epithelial OC, including early‐stages disease.
We acknowledge that our study has some limitations. The number of patients was relatively small, and the duration of follow‐up was relatively short. Further prospective studies with more patients and longer follow‐up periods would provide more definitive data to clarify the significance of our findings.
In conclusion, this report shows that high GPS can serve as an indicator of poor prognosis in patients with all stages and histologies of epithelial OC, including early‐stage disease.
Conflict of Interest
None delared.
Cancer Medicine 2016; 5(6): 1074–1080
References
- 1. American Cancer Society . 2009. Cancer facts & figures 2009. American cancer Society, Atlanta, Ga. [Google Scholar]
- 2. Ushijima, K. 2009. Current status of gynecologic cancer in Japan. J. Gynecol. Oncol. 20:67–71. [DOI] [PMC free article] [PubMed] [Google Scholar]
- 3. Edgell, T. , Martin‐Roussety G., Barker G., Autelitano D. J., Allen D., Grant P., et al. 2010. Phase II biomarker trial of a multimarker diagnostic for ovarian cancer. J. Cancer Res. Clin. Oncol. 136:1079–1088. [DOI] [PMC free article] [PubMed] [Google Scholar]
- 4. Fathalla, M. F. 1972. Factors in the causation and incidence of ovarian cancer. Obstet. Gynecol. Surv. 27:751–768. [DOI] [PubMed] [Google Scholar]
- 5. Vergote, I. B. , Kaern J., Abeler V. M., Pettersen E. O., De Vos L. N., and Tropé C. G.. 1993. Analysis of prognostic factors in stage I epithelial ovarian carcinoma: importance of degree of differentiation and deoxyribonucleic acid ploidy in predicting relapse. Am. J. Obstet. Gynecol. 169:40–52. [DOI] [PubMed] [Google Scholar]
- 6. McMillan, D. C. , Watson W. S., O'Gorman P., Preston T., Scott H. R., and McArdle C. S.. 2001. Albumin concentrations are primarily determined by the body cell mass and the systemic inflammatory response in cancer patients with weight loss. Nutr. Cancer 39:210–213. [DOI] [PubMed] [Google Scholar]
- 7. Wang, C. S. , and Sun C. F.. 2009. C‐reactive protein and malignancy: clinico‐pathological association and therapeutic implication. Chang. Gung. Med. J. 32:471–482. [PubMed] [Google Scholar]
- 8. Funovics, P. T. , Edelhauser G., Funovics M. A., Laux C., Berzaczy D., Kubista B., et al. 2011. Pre‐operative serum C‐reactive protein as independent prognostic factor for survival but not infection in patients with high‐grade osteosarcoma. Int. Orthop. 35:1529–1536. [DOI] [PMC free article] [PubMed] [Google Scholar]
- 9. Forrest, L. M. , McMillan D. C., McArdle C. S., Angerson W. J., and Dunlop D. J.. 2003. Evaluation of cumulative prognostic scores based on the systemic inflammatory response in patients with inoperable non‐small‐cell lung cancer. Br. J. Cancer 89:1028–1030. [DOI] [PMC free article] [PubMed] [Google Scholar]
- 10. Forrest, L. M. , McMillan D. C., McArdle C. S., Angerson W. J., and Dunlop D. J.. 2004. Comparison of an inflammation‐based prognostic score (GPS) with performance status (ECOG) in patients receiving platinum‐based chemotherapy for inoperable non‐small‐cell lung cancer. Br. J. Cancer 90:1704–1706. [DOI] [PMC free article] [PubMed] [Google Scholar]
- 11. Al Murri, A. M. , Bartlett J. M., Canney P. A., Doughty J. C., Wilson C., and McMillan D. C.. 2006. Evaluation of an inflammation‐based prognostic score (GPS) in patients with metastatic breast cancer. Br. J. Cancer 94:227–230. [DOI] [PMC free article] [PubMed] [Google Scholar]
- 12. Crumley, A. B. , McMillan D. C., McKernan M., McDonald A. C., and Stuart R. C.. 2006. Evaluation of an inflammation‐based prognostic score in patients with inoperable gastro‐oesophageal cancer. Br. J. Cancer 94:637–641. [DOI] [PMC free article] [PubMed] [Google Scholar]
- 13. Glen, P. , Jamieson N. B., McMillan D. C., Carter R., Imrie C. W., and McKay C. J.. 2006. Evaluation of an inflammation‐based prognostic score in patients with inoperable pancreatic cancer. Pancreatology 6:450–453. [DOI] [PubMed] [Google Scholar]
- 14. Ramsey, S. , Lamb G. W., Aitchison M., Graham J., and McMillan D. C.. 2007. Evaluation of an inflammation‐based prognostic score in patients with metastatic renal cancer. Cancer 109:205–212. [DOI] [PubMed] [Google Scholar]
- 15. Leitch, E. F. , Chakrabarti M., Crozier J. E., McKee R. F., Anderson J. H., Horgan P. G., et al. 2007. Comparison of the prognostic value of selected markers of the systemic inflammatory response in patients with colorectal cancer. Br. J. Cancer 97:1266–1270. [DOI] [PMC free article] [PubMed] [Google Scholar]
- 16. Sharma, R. , Hook J., Kumar M., and Gabra H.. 2008. Evaluation of an inflammation‐based prognostic score in patients with advanced ovarian cancer. Eur. J. Cancer 44:251–256. [DOI] [PubMed] [Google Scholar]
- 17. Dowdy, S. C. , Mullany S. A., Brandt K. R., Huppert B. J., and Cliby W. A.. 2004. The utility of computed tomography scans in predicting suboptimal cytoreductive surgery in women with advanced ovarian carcinoma. Cancer 101:346–352. [DOI] [PubMed] [Google Scholar]
- 18. Sehouli, J. , Richter R., Braicu E. I., Bühling K. J., Bahra M., Neuhaus P., et al. 2010. Role of secondary cytoreductive surgery in ovarian cancer relapse: who will benefit? A systematic analysis of 240 consecutive patients. J. Surg. Oncol. 102:656–662. [DOI] [PubMed] [Google Scholar]
- 19. Hefler, L. A. , Zeillinger R., Grimm C., Sood A. K., Cheng W. F., Gadducci A., et al. 2006. Preoperative serum vascular endothelial growth factor as a prognostic parameter in ovarian cancer. Gynecol. Oncol. 103:512–517. [DOI] [PubMed] [Google Scholar]
- 20. Tempfer, C. , Zeisler H., Sliutz G., Haeusler G., Hanzal E., and Kainz C.. 1997. Serum evaluation of interleukin 6 in ovarian cancer patients. Gynecol. Oncol. 66:27–30. [DOI] [PubMed] [Google Scholar]
- 21. Hefler, L. A. , Concin N., Hofstetter G., Marth C., Mustea A., Sehouli J., et al. 2008. Serum C‐reactive protein as independent prognostic variable in patients with ovarian cancer. Clin. Cancer Res. 14:710–714. [DOI] [PubMed] [Google Scholar]
- 22. McMillan, D. C. 2009. Systemic inflammation, nutritional status and survival in patients with cancer. Curr. Opin. Clin. Nutr. Metab. Care 12:223–226. [DOI] [PubMed] [Google Scholar]
- 23. Gupta, D. , and Lis C. G.. 2010. Pretreatment serum albumin as a predictor of cancer survival: a systematic review of the epidemiological literature. Nutr. J. 9:69. [DOI] [PMC free article] [PubMed] [Google Scholar]
- 24. Kobayashi, T. , Teruya M., Kishiki T., Endo D., Takenaka Y., Tanaka H., et al. 2008. Inflammation‐based prognostic score, prior to neoadjuvant chemoradiotherapy, predicts postoperative outcome in patients with esophageal squamous cell carcinoma. Surgery 144:729–735. [DOI] [PubMed] [Google Scholar]
- 25. Warwick, J. , Kehoe S., Earl H., Luesley D., Redman C., and Chan K. K.. 1995. Long‐term follow‐up of patients with advanced ovarian cancer treated in randomised clinical trials. Br. J. Cancer 72:1513–1517. [DOI] [PMC free article] [PubMed] [Google Scholar]