Abstract
Streptococcus pneumoniae forms biofilms, but little is known about its extracellular polymeric substances (EPS) or the kinetics of biofilm formation. A system was developed to enable the simultaneous measurement of cells and the EPS of biofilm-associated S. pneumoniae in situ over time. A biofilm reactor containing germanium coupons was interfaced to an attenuated total reflectance (ATR) germanium cell of a Fourier transform infrared (FTIR) laser spectrometer. Biofilm-associated cells were recovered from the coupons and quantified by total and viable cell count methods. ATR-FTIR spectroscopy of biofilms formed on the germanium internal reflection element (IRE) of the ATR cell provided a continuous spectrum of biofilm protein and polysaccharide (a measure of the EPS). Staining of the biofilms on the IRE surface with specific fluorescent probes provided confirmatory evidence for the biofilm structure and the presence of biofilm polysaccharides. Biofilm protein and polysaccharides were detected within hours after inoculation and continued to increase for the next 141 h. The polysaccharide band increased at a substantially higher rate than did the protein band, demonstrating increasing coverage of the IRE surface with biofilm polysaccharides. The biofilm total cell counts on germanium coupons stabilized after 21 h, at approximately 105 cells per cm2, while viable counts decreased as the biofilm aged. This system is unique in its ability to detect and quantify biofilm-associated cells and EPS of S. pneumoniae over time by using multiple, corroborative techniques. This approach could prove useful for the study of biofilm processes of this or other microorganisms of clinical or industrial relevance.
Microbial biofilms are comprised of both cells and extracellular polymeric substances (EPS) (7).Though a variety of in vitro model systems have been developed for growing and quantifying biofilms, most rely upon the measurement of cells recovered from the surface, using viable plating or direct microscopic counting methods, to estimate the rate or extent of biofilm formation. Even though the EPS may comprise up to 98% of the volume of the biofilm (10), this material is rarely measured. Sutherland (25) noted that cells in pure culture biofilms may produce multiple polysaccharides, but the minute quantities present preclude accurate measurement by wet chemical methods. Streptococcus pneumoniae is suspected of forming biofilms in individuals who develop otitis media (6). S. pneumoniae produces a copious polysaccharide capsule that is a known virulence factor involved in adhesion (12) and that is antiphagocytic, but there have been few published studies documenting biofilm formation by this organism.
Real-time monitoring of the biofilms formed when bacteria are in contact with an internal reflection element (IRE) substrate has been performed by Fourier transform infrared (FTIR) spectroscopy. Since biofilms have a different chemical composition than the same organisms in suspension (11, 14, 16), FTIR spectra show different bands for biofilms and isolated cells. Specific polysaccharide bands in the 1,200- to 900-cm−1 region have been detected in addition to amide bands, demonstrating the presence of extracellular polymers in biofilm formation. Results for the FTIR spectra of biofilms of Pseudomonas putida (19), Pseudomonas aeruginosa (18, 21), and Caulobacter crescentus (16) have recently been reported. These data clearly show that as the extracellular polysaccharides are formed, an increase is observed in the intensity of the polysaccharide bands in the 1,200- to 950-cm−1 region relative to the protein amide I and amide II bands, at approximately 1,650 cm−1 and 1,550 cm−1, respectively. This assignment of spectral regions with biofilm components was further proven by an elegant approach of comparing known standards for proteins (bovine serum albumin), nucleic acids (yeast RNA), and polysaccharides (cellobiose) to a biofilm of P. aeruginosa and mixing the compounds in ratiometric amounts to reconstruct the measured biofilm spectra (22). The use of the FTIR technique for monitoring biofilms was also recently reviewed in a book chapter (11).
The purpose of this study was to develop a system that would enable the detection of cells and EPS that accumulate during biofilm formation by S. pneumoniae in real time by using multiple, corroborative techniques.
MATERIALS AND METHODS
Model system design.
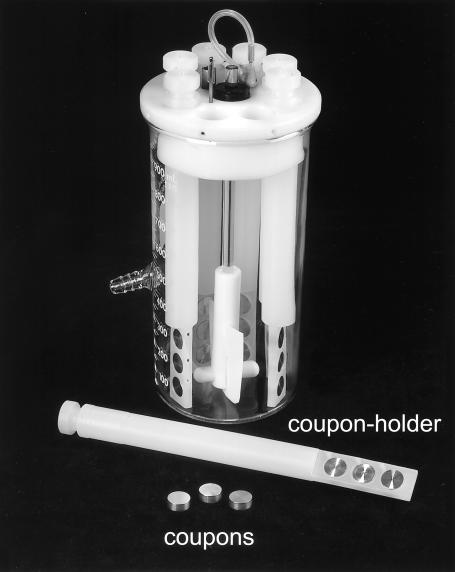
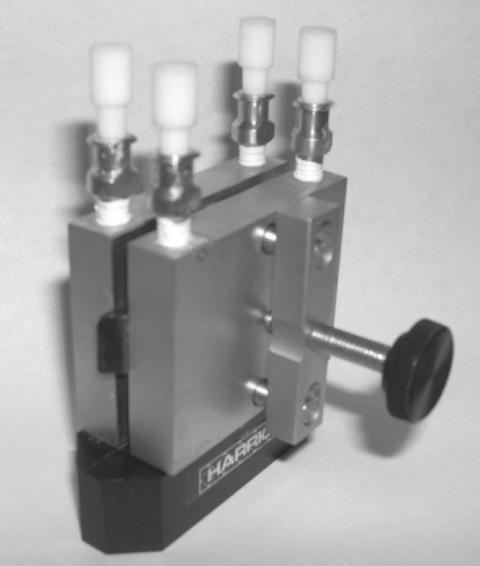
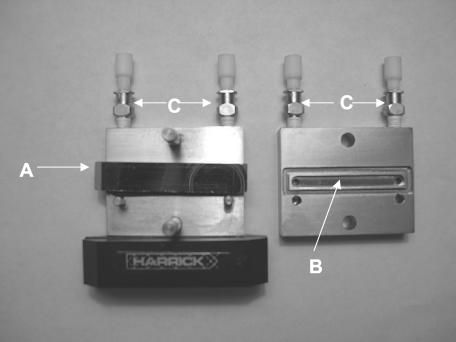
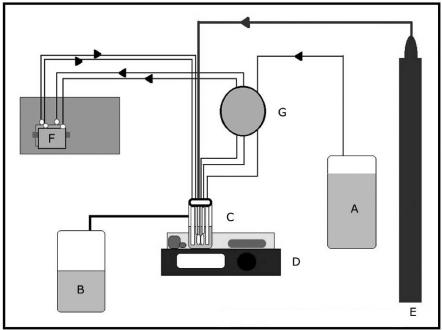
A biofilm reactor containing 1.3-cm-diameter germanium coupons (Fig. 1) was connected to a 10-liter carboy containing medium, which was supplied to the reactor at a flow rate of 0.5 ml/min by a Master Flex peristaltic pump (Cole Parmer, Niles, Ill.). Germanium was chosen as the material for the construction of the coupons because the IRE described below was also constructed of this material. The volume of medium in the reactor was maintained at 500 ml by means of a discharge line that was connected to a waste vessel. The reactor was continuously supplied with a filter-sterilized mixture of 85% nitrogen, 10% carbon dioxide, and 5% oxygen. The entire reactor was placed into a water bath containing a heating element to achieve and maintain a temperature of approximately 35°C for the duration of the experiment. The water bath was placed onto the surface of a mixing plate set to provide constant mixing at 75 rpm. Coupons could be removed from the reactor at desired time intervals by withdrawing the coupon holder through the lid of the reactor. Silicone tubing was also connected from the biofilm reactor to an attenuated total reflectance (ATR) cell (Harrick Scientific, Ossining, N.Y.) and the same peristaltic pump, allowing the medium containing bacteria to be continuously circulated through the ATR cell and over the surfaces of a 50 mm by 10 mm by 3 mm germanium IRE that was contained inside the ATR cell (Fig. 2 and 3). The ATR cell was housed in an FTIR laser spectrometer (Magna 860; Nicolet, Madison, Wis.). The configuration of the entire model system used for this study is shown in Fig. 4. All components of the biofilm reactor were sterilized in an autoclave. The components of the ATR cell that came in contact with the medium were sterilized with 2% glutaraldehyde for 10 min and then rinsed with 0.6 M filter-sterilized sodium metabisulfite for 1 min to inactivate any residual glutaraldehyde. This solution was then removed and the cell was rinsed with filter-sterilized reverse osmosis-purified water to remove any traces of the sodium metabisulfite solution. Immediately after this sterilization process, the cell was connected to sterile silicone tubing that was attached to the biofilm reactor.
FIG. 1.
Biofilm reactor.
FIG. 2.
Assembled ATR cell.
FIG. 3.
Disassembled ATR cell showing position of IRE (A) inside the ATR, the channel (B) through which the circulating medium flows, and tubing connectors (C).
FIG. 4.
Model system for growing and quantifying S. pneumoniae biofilms. The components of the system are the medium supply (A), waste container (B), biofilm reactor (C), digitally controlled magnetic stirring plate and water bath set for temperature control (D), compressed gas mixture (85% nitrogen, 5% oxygen, and 10% carbon dioxide) (E), ATR cell containing IRE (F) housed in an FTIR spectrophotometer, and peristaltic pump (G).
Culture preparation.
An S. pneumoniae clinical isolate obtained from the Boston Children's Hospital, Boston, Mass., was subcultured from a frozen stock on blood agar plates (BD Microbiology Systems, Cockeysville, Md.) and incubated at 35°C in a 5% CO2 incubator overnight. A single colony was then picked and inoculated into a 10-ml tube of brain heart infusion (BHI) broth (Difco Laboratories, Detroit, Mich.), which was then incubated for 12 h at 35°C in a 5% CO2 incubator. Nine milliliters of this 12-h culture was added to the reactor, providing 2.13 × 10⁷ CFU/ml in the reactor, as determined by plating on blood agar and incubation at 35°C in a CO2 incubator.
Experimental approach.
After inoculation of the reactor, the system containing full-strength BHI broth was mixed but operated in batch mode for exactly 12 h and then was operated as an open system by pumping 10% BHI broth into the reactor at a rate of 0.5 ml/min for the remainder of the experiment. The medium was continually circulated at 0.5 ml/min from the biofilm reactor through the ATR cell. Biofilm formation was determined in several ways. Coupons were removed from the reactor at selected time intervals and rinsed in sterile phosphate-buffered saline. Biofilms were recovered by subjecting these coupons to three 30-s cycles of sonication at a frequency of 42 kHz (model 2510 sonicating water bath; Branson Co., Danbury, Conn.), followed by vortexing (Vortex Genie 2; Scientific Products Co., Bohemia, N.Y.) and homogenization of the suspension containing the suspended biofilm cells in a tissue homogenizer (model K-120; Polysciences Co., Niles, Ill.) for 60 s at approximately 16,000 rpm. The resulting suspension was then processed to quantify the number of cells. For determination of the viable cell count, 1 ml of the sample was diluted and cultured on Trypticase soy agar containing 5% sheep's blood (BD Microbiology Systems) by using the spread plate technique. Colonies were counted after incubation at 35°C in a CO2 incubator for 24 h. For determination of the total cell count, 7 ml of the sample was filtered through a 0.2-μm-pore-size polycarbonate Nuclepore membrane filter (Whatman, Kent, United Kingdom), fixed in 5% formalin for 5 min, stained with a 2-μg/ml 4′6-diamidino-2-phenylindole (DAPI) solution (in filter-sterilized reverse osmosis-purified water) for 15 min in the dark, mounted on a glass microscope slide, and counted under a Zeiss Axioskop II epifluorescence research microscope (Carl Zeiss, Gottingen, Germany) containing a DAPI filter set (365-nm excitation wavelength, 400-nm long-pass dichroic mirror, 420-nm long-pass emission wavelength). Twenty fields were counted by using a calibrated eyepiece grid.
After all spectra had been collected, the IRE was removed from the ATR cell, rinsed twice in phosphate-buffered saline, and placed in a petri dish inside a biological safety cabinet. A wetted swab was rubbed several times across the surface of the IRE and then placed into a tube containing 9 ml of Butterfield buffer. The tube was vortexed for 1 min, and serial dilutions of the suspension were made in Butterfield buffer, spread plated onto blood agar plates, incubated at 35°C in a CO2 incubator for 24 h, and then counted. An aliquot of this suspension was also filtered through a 0.2-μm-pore-size Nuclepore filter (Whatman), fixed with 5% formalin, and stained with DAPI by the method described above. Cells in 20 fields were counted. The opposite side of the IRE was then stained with a 100-μg/ml solution of wheat germ agglutinin conjugated with Alexa Fluor 488 (WGA-AF) (Molecular Probes, Eugene, Oreg.) for 30 min in the dark, rinsed twice in filter-sterilized reverse osmosis-purified water, fixed for 5 min with 5% formalin, stained with 2 μg of DAPI/ml for 15 min in the dark, and then rinsed four times with filter-sterilized reverse osmosis-purified water. The surface was wicked dry with a paper towel to remove excess water and stain, mounted with immersion oil, and examined with a fluorescein isothiocyanate (FITC) filter set (480-nm excitation wavelength, 505-nm long-pass dichroic mirror, 535-nm emission wavelength) to visualize the Alexa Fluor stain and with a DAPI filter set (365-nm excitation wavelength, 400-nm long-pass dichroic mirror, 420-nm long-pass emission wavelength) to visualize DAPI. To ascertain that this fluorescence was due to binding of the conjugated lectins to the biofilm polysaccharides, we cleaned the ATR crystal with detergent, sonicated it in 70% ethanol in a sonicating water bath for 30 min, rinsed it several times in filter-sterilized reverse osmosis-purified water, stained it by the procedure described above, and examined it.
Biofilm proteins and polysaccharides were also quantified spectroscopically by use of the ATR cell. After the background spectrum of the uninoculated medium was measured (over a 12-h period), the inoculated medium was circulated through the ATR cell and the Nicolet Ominic program was set up to record the spectrum obtained every 10 min. One hundred scans were averaged at each sampling time. The single-beam spectra were normalized to the initial background spectrum to produce an absorption change at each sampling time. The known amide I and II bands (1,700 to 1,500 cm−1) and the polysaccharide region (1,200 to 1,000 cm−1) were used to monitor the growth of the biofilm over time and under different conditions.
RESULTS AND DISCUSSION
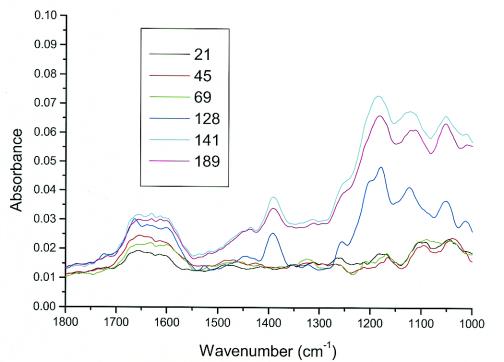
Figure 5 shows the extracted spectra of S. pneumoniae biofilms that formed in the ATR-FTIR biofilm reactor system. Several spectral features were observed in the 1,700- to 1,000-cm−1 range. It is well documented that protein vibrations appear in the region from 1,700 to 1,515 cm−1 (4, 16, 21). The C=O carbonyl stretch of the amide groups gives rise to the amide I band (between 1,690 and 1,640 cm−1). Water also absorbs in this region at about 1,640 cm−1. The N—H bend of amides gives rise to the amide II band (between 1,590 and 1,515 cm−1). The intensity of this band is usually one-half to one-third that of the amide I band. The broad band at ∼1,650 cm−1 is most likely the hydrated mixture of both the amide I and amide II bands in the protein component of the biofilm together with a water solvent contribution, as water content can vary in the biofilm with time and its background subtraction is not always completely exact, especially with a low (protein) amide signal. The broad complex region from 1,300 to 900 cm−1 has been characterized in the literature as the region where both DNA-RNA and polysaccharides appear (9, 22-24, 26). Vibrations in this region are characterized by C—O—C, C—O, ring-stretching vibrations and the P=O stretch of phosphodiesters. The data in Fig. 5 show that the amide and polysaccharide bands were detected on the IRE surface within hours after inoculation, increased up to 141 h, and then remained relatively stable through 189 h. The polysaccharide band increased at a substantially higher rate and to a much larger absolute intensity than did the amide band. The increase in spectral intensity over time reflects an increase in the coverage of the IRE surface by the biofilm rather than an increase in biofilm thickness. The infrared radiation produced by the FTIR spectroscopy system impinges on the IRE and is reflected on the inside surface of the IRE, creating an evanescent wave with a depth of penetration of approximately 1 μm (depending upon the IR wavelength). This means that only material within approximately 1 μm of the surface will be detected (16). Any material on the IRE surface outside the ∼1-μm sampling area will not be detected. To determine the ability of this system to provide reproducible results, we performed a second experiment in which only spectroscopic data were collected. As in the first experiment, the λmax value for proteins was approximately 1,650 cm−1 and that for polysaccharides was 1,300 to 1,000 cm−1.
FIG. 5.
FTIR spectrum of S. pneumoniae biofilm formation on germanium IRE showing the change in signal intensity (absorbance) as a function of time after inoculation (hours).
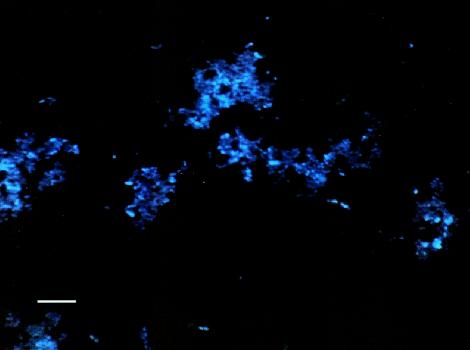
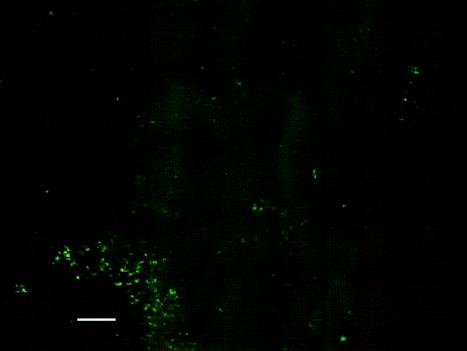
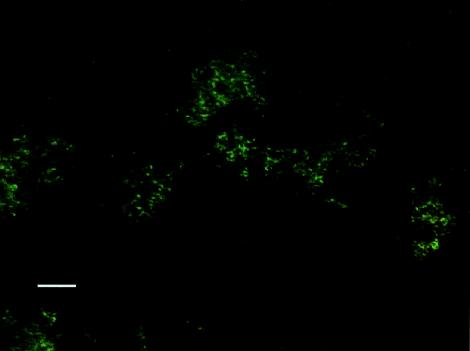
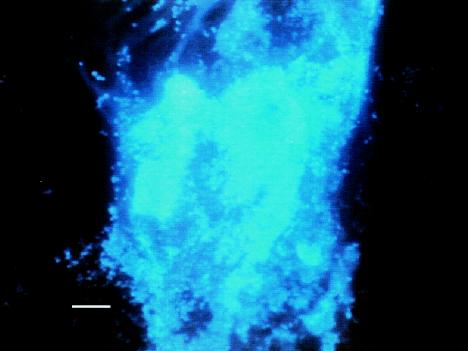
In order to provide confirmation of the putative biofilm polysaccharides detected by the ATR-FTIR system, we examined the IRE at the end of the experiment. Figures 6 to 9 show biofilms on two regions of the IRE surface after staining with WGA-AF and DAPI. WGA-AF will bind N-acetylglucosamine (13), a component of the outer peptidoglycan layer of gram-positive bacteria (20). Ebisu et al. (8) also showed that WGA will specifically bind the capsular polysaccharides of S. pneumoniae. DAPI will stain all nucleic acid-containing cells (but not the EPS material). The similarity of the biofilm structures shown in Fig. 6 and 7 suggests that most of the cells in the biofilm in this region of the IRE bound to the WGA-AF either due to the N-acetylglucosamine in the cell wall or because they were encapsulated. Figure 8 shows another region of the IRE depicting a much thicker biofilm, with very intense DAPI staining in some areas, indicative of a biofilm structure that is several cells thick in these areas. Figure 9 shows this same field of view, but after it was illuminated to show WGA-AF staining. The haze observed in this image is highly suggestive of an extracellular polysaccharide material, similar to what was reported by Neu and Lawrence (15) as “EPS clouds.” These results imply that N-acetylglucosamine is one of the components of the biofilm EPS for this organism. An examination of the IRE after cleaning and surface sterilization to remove traces of biofilm and EPS revealed that very little fluorescent material was still present, supporting the argument that the fluorescent signals observed to be emanating from the stained biofilm were not due to nonspecific binding or autofluorescence of the IRE surface.
FIG. 6.
S. pneumoniae biofilm on IRE surface after staining with WGA-AF and DAPI and imaging with a DAPI filter set (365-nm excitation wavelength, 400-nm long-pass dichroic mirror, 420-nm long-pass emission wavelength) to visualize DAPI staining. Bar, 10 μm.
FIG. 9.
S. pneumoniae biofilm on IRE surface after staining with WGA-AF and DAPI and imaging with a FITC filter set (480-nm excitation wavelength, 505-nm long-pass dichroic mirror, 535-nm emission wavelength) to visualize WGA-AF staining. Bar, 10 μm.
FIG. 7.
S. pneumoniae biofilm on IRE surface after staining with WGA-AF and DAPI and imaging with a FITC filter set (480-nm excitation wavelength, 505-nm long-pass dichroic mirror, 535-nm emission wavelength) to visualize WGA-AF staining. Bar, 10 μm.
FIG. 8.
S. pneumoniae biofilm on IRE surface after staining with WGA-AF and DAPI and imaging with a DAPI filter set (365-nm excitation wavelength, 400-nm long-pass dichroic mirror, 420-nm long-pass emission wavelength) to visualize DAPI staining. Bar, 10 μm.
Coupons collected from the biofilm reactor over the course of the experiment provided the only means to actually quantify the numbers of cells attached to the surfaces and in the biofilm. With a nucleic acid stain (DAPI), it was possible to stain all of the cells recovered, regardless of their viability, and to provide a total cell count. Cells forming colonies on blood agar plates provided an estimate of the number of viable cells. Table 1 shows the total and viable cell counts recovered from the germanium coupons installed in the biofilm reactor. Approximately 105 cells/cm2 colonized the coupon surfaces within the first 21 h, and these counts stabilized at this level throughout the 189-h exposure. The number of viable cells was highest for the 21-h sample and generally decreased as the biofilms aged. The total biofilm count recovered from the IRE was 6.16 × 10⁴ cells/cm2. This was somewhat lower than the counts obtained from the germanium coupons installed in the biofilm reactor (Table 1). One explanation for this difference is that the hydrodynamics of the biofilm reactor and the ATR cell were different. The mixing of medium in the biofilm reactor provided relatively turbulent flow conditions, while the hydrodynamics inside the ATR cell, which contained 4.2- by 0.5- by 0.2-cm chambers adjacent to each side of the IRE, would approach laminar flow conditions. These differences would impact rates of bacterial attachment and biofilm formation (7). Another explanation is that the methods used for recovering the biofilms from the IRE and coupon surfaces were different. Donlan et al. (5) found that sonicating and vortexing (used for germanium coupons) recovered a larger percentage of biofilm-associated organisms from plastic surfaces than swabbing (used for the IRE surface).
TABLE 1.
Total and viable counts of biofilm-associated S. pneumoniae collected from germanium coupons exposed in the biofilm reactor
| Time (h) in biofilm reactor | Cell count (log10 cells/cm2) per coupon surfacea
|
|
|---|---|---|
| Total | Viable | |
| 21 | 5.23 ± 0.21 | 4.99 ± 0.06 |
| 45 | 5.15 ± 0.05 | 4.21 ± 0.15 |
| 69 | 5.42 ± 0.14 | 4.70 ± 0.13 |
| 141 | 4.95 ± 0.11 | 3.08 ± 0.28b |
| 189 | 5.15 ± 0.11 | 3.85 ± 0.34 |
Data are means ± standard deviations (n = 3).
n = 2.
Few published studies document biofilm formation by S. pneumoniae. Budhani and Struthers (3) used a continuous-culture biofilm system to demonstrate the formation of S. pneumoniae biofilms on cellulose surfaces. They did not provide any structural information on the biofilms, measure the biofilm EPS, or provide real-time biofilm measurements.
S. pneumoniae cells will normally lyse during the stationary phase when they are grown under batch conditions in liquid media (1). We were able to avoid this problem and to sustain biofilms for more than 7 days by inoculating the biofilm reactor with an early-log-phase culture and maintaining batch conditions for only 12 h prior to pumping fresh medium into the reactor, initiating open system conditions.
Polysaccharides rapidly accumulated on the IRE surface, with more extensive polysaccharide production relative to protein as time progressed. Bremer and Geesey (2) measured the biofilm formation of an unidentified environmental bacterium by using an ATR-FTIR system and observed a continued increase in protein bands for 188 h, with the protein/polysaccharide ratio increasing with time. Nivens et al. (17) reported a similar pattern for Burkholderia (Pseudomonas) cepacia. The fact that S. pneumoniae produced a larger quantity of polysaccharides relative to proteins in the biofilm in our study illustrates the distinct differences in biofilm structure that may be exhibited by different organisms. The lectin-staining results also provide evidence that the EPS of S. pneumoniae is at least partly comprised of N-acetylglucosamine, the capsular polysaccharide of this organism.
In conclusion, we developed a model system for growing and characterizing biofilm formation by S. pneumoniae. The biofilm reactor provided a means for collecting and quantifying biofilm-associated cells over time. The ATR cell enabled spectroscopic measurement of biofilm components as they initially formed on the IRE surface. Biofilms were detected by spectroscopic methods to measure biofilm proteins and polysaccharides, characterized by microscopic methods to probe and visualize the biofilm structure, including the EPS, and quantified by total and viable counting methods to measure biofilm-associated cells. Biofilm protein, EPS, and cells were detected within hours of inoculation and continued to form throughout the course of the experiment. The system we have described is uniquely suited for detecting the EPS component of biofilms and for measuring biofilm formation continuously over time. Further investigation of the EPS and the mechanism of biofilm growth is currently under way.
Acknowledgments
This work was supported by the Georgia Institute of Technology/Centers for Disease Control and Prevention Seed Grant Program, 2001 and 2002.
The use of trade names and commercial sources is for identification only and does not imply endorsement by the Public Health Service of the United States Department of Health and Human Services.
REFERENCES
- 1.Balachandran, P., S. K. Hollingshead, J. C. Paton, and D. E. Briles. 2001. The autolytic enzyme LytA of Streptococcus pneumoniae is not responsible for releasing pneumolysin. J. Bacteriol. 183:3108-3116. [DOI] [PMC free article] [PubMed] [Google Scholar]
- 2.Bremer, P. J., and G. G. Geesey. 1991. An evaluation of biofilm development utilizing non-destructive attenuated total reflectance Fourier transform infrared spectroscopy. Biofouling 3:89-100. [Google Scholar]
- 3.Budhani, R. K., and J. K. Struthers. 1997. The use of Sorbarad biofilms to study the antimicrobial susceptibility of a strain of Streptococcus pneumoniae. J. Antimicrob. Chemother. 40:601-602. [DOI] [PubMed] [Google Scholar]
- 4.Cassal, H. L., D. G. Cameron, I. C. P. Smith, and H. H. Mantsch. 1980. Acholeplasma laidlawii membranes: a Fourier transform infrared study of the influence of protein on lipid organization and dynamics. Biochemistry 19:444-451. [DOI] [PubMed] [Google Scholar]
- 5.Donlan, R. M., R. Murga, M. Bell, C. M. Toscano, J. H. Carr, T. J. Novicki, C. Zuckerman, L. C. Corey, and J. M. Miller. 2001. Protocol for detection of biofilms on needleless connectors attached to central venous catheters. J. Clin. Microbiol. 39:750-753. [DOI] [PMC free article] [PubMed] [Google Scholar]
- 6.Donlan, R. M., and J. W. Costerton. 2002. Biofilms: survival mechanisms of clinically relevant microorganisms. Clin. Microbiol. Rev. 15:167-193. [DOI] [PMC free article] [PubMed] [Google Scholar]
- 7.Donlan, R. M. 2002. Biofilms: microbial life on surfaces. Emerg. Infect. Dis. 8:881-890. [DOI] [PMC free article] [PubMed] [Google Scholar]
- 8.Ebisu, S., J. Lonngren, and I. J. Goldstein. 1977. Interaction of pneumococcal S-14 polysaccharide with lectins from Ricinus communis, Triticum vulgaris, and Bandeiraea simplicifolia. Carbohydr. Res. 58:187-191. [Google Scholar]
- 9.Fleming, H.-C., G. Schaule, J. Griebe, A. Schmidt, and A. Tamachkiarowa. 1997. Biofouling—the Achilles heel of membrane processes. Desalination 113:215-225. [Google Scholar]
- 10.Fleming, H.-C., J. Wingender, T. Griebe, and C. Mayer. 2000. Physico-chemical properties of biofilms, p. 19-34. In L. V. Evans (ed.), Biofilms: recent advances in their study and control. Harwood Academic Publishers, Amsterdam, The Netherlands.
- 11.Geesey G. G., and P. A. Suci. 2000. Monitoring biofilms by Fourier transform infrared spectroscopy, p. 253-277. In L. V. Evans (ed.), Biofilms: recent advances in their study and control. Harwood Academic Publishers, Amsterdam, The Netherlands.
- 12.Magee, A. D., and J. Yother. 2001. Requirement for capsule in colonization by Streptococcus pneumoniae. Infect. Immun. 69:3755-3761. [DOI] [PMC free article] [PubMed] [Google Scholar]
- 13.Nagata, Y., and M. M. Burger. 1974. Wheat germ agglutinin. Molecular characteristics and specificity for sugar binding. J. Biol. Chem. 249:3116-3122. [PubMed] [Google Scholar]
- 14.Naumann, D., C. P. Schultz, and D. Helm. 1996. What can infrared spectroscopy tell us about the structure and composition of intact bacterial cells, p. 279-310. In H. H. Mantsch and D. Chapman (ed.), Infrared spectroscopy of biomolecules. Wiley-Liss, New York, N.Y.
- 15.Neu, T. R., and J. R. Lawrence. 1999. Lectin-binding analysis in biofilm systems. Methods Enzymol. 310:145-152. [DOI] [PubMed] [Google Scholar]
- 16.Nivens, D. E., J. Q. Chambers, T. R. Anderson, A. Tunlid, J. Smit, and D. C. White. 1993. Monitoring microbial adhesion and biofilm formation by attenuated total reflection/Fourier transform infrared spectroscopy. J. Microbiol. Methods 17:199-213. [Google Scholar]
- 17.Nivens, D. E., R. J. Palmer, Jr., and D. C. White. 1995. Continuous nondestructive monitoring of microbial biofilms: a review of analytical techniques. J. Ind. Microbiol. 15:263-276. [Google Scholar]
- 18.Nivens, D. E., D. E. Ohman, J. Williams, and M. J. Franklin. 2001. Role of alginate and its O-acetylation in formation of Pseudomonas aeruginosa microcolonies and biofilms. J. Bacteriol. 183:1047-1057. [DOI] [PMC free article] [PubMed] [Google Scholar]
- 19.Schmidt, J., and H.-C. Fleming. 1998. FT-IR spectroscopy in microbial and material analysis. Int. Biodet. Biodegr. 41:1-11. [Google Scholar]
- 20.Sizemore, R., J. J. Caldwell, and A. S. Kendrick. 1990. Alternate Gram staining technique using a fluorescent lectin. Appl. Environ. Microbiol. 56:2245-2247. [DOI] [PMC free article] [PubMed] [Google Scholar]
- 21.Suci, P. A., M. W. Mittelman, F. P. Yu, and G. G. Geesey. 1994. Investigation of ciprofloxacin penetration into Pseudomonas aeruginosa biofilms. Antimicrob. Agents Chemother. 38:2125-2133. [DOI] [PMC free article] [PubMed] [Google Scholar]
- 22.Suci, P. A., J. D. Vray, and M. W. Mittelman. 1998. Investigation of interactions between antimicrobial agents and bacterial biofilms using attenuated total reflection Fourier transform infrared spectroscopy. Biomaterials 19:327-339. [DOI] [PubMed] [Google Scholar]
- 23.Suci, P. A., and G. G. Geesey. 1995. Investigation of alginate binding to germanium and polystyrene substrate conditioned with mussel adhesive protein. J. Colloid Interface Sci. 172:347-357. [Google Scholar]
- 24.Suci, P. A., K. J. Siedlecki, R. J. Palmer, Jr., D. C. White, and G. G. Geesey. 1997. Combined light microscopy and attenuated total reflection Fourier transform infrared spectroscopy for integration of biofilm structure, distribution, and chemistry at solid-liquid interfaces. Appl. Environ. Microbiol. 63:4600-4603. [DOI] [PMC free article] [PubMed] [Google Scholar]
- 25.Sutherland, I. W. 2001. Biofilm exopolysaccharides: a strong and sticky framework. Microbiology 147:3-9. [DOI] [PubMed] [Google Scholar]
- 26.Taillandier, E., J. Liquier, and J. A. Taboury. 1985. Infrared spectral studies on DNA conformations, p. 65-114. In R. J. H. Clark and R. E. Hester (ed.), Advances in infrared and Raman spectroscopy, vol. 12. Wiley Heyden, New York, N.Y. [Google Scholar]


