

Abstract
In this work, highly oxidized multifunctional molecules (HOMs) in fresh and aged secondary organic aerosol (SOA) derived from biogenic precursors are characterized with high resolution mass spectrometry. Fresh SOA was generated by mixing ozone with a biogenic precursor (β-pinene, limonene, α-pinene) in a flow tube reactor. Aging was performed by passing the fresh SOA through a photochemical reactor where it reacted with hydroxyl radicals. Although these aerosols were as a whole not highly oxidized, molecular analysis identified a significant number of HOMs embedded within it. HOMs in fresh SOA consisted mostly of monomers and dimers, which is consistent with condensation of extremely low-volatility organic compounds (ELVOCs) that have been detected in the gas phase in previous studies and linked to SOA particle formation. Aging caused an increase in the average number of carbon atoms per molecule of the HOMs, which is consistent with particle phase oxidation of (less oxidized) oligomers already existing in fresh SOA. HOMs having different combinations of oxygen-to-carbon ratio, hydrogen-to-carbon ratio and average carbon oxidation state are discussed and compared to low volatility oxygenated organic aerosol (LVOOA), which has been identified in ambient aerosol based on average elemental composition but not fully understood at a molecular level. For the biogenic precursors and experimental conditions studied, HOMs in fresh biogenic SOA have molecular formulas more closely resembling LVOOA than HOMs in aged SOA, suggesting that aging of biogenic SOA is not a good surrogate for ambient LVOOA.
Graphical abstract
Introduction
Secondary organic aerosol (SOA), which is produced by the oxidation of volatile organic compounds (VOCs) emitted from biogenic and anthropogenic sources, has great impact on the environment and human health.1-4 The initial or “fresh” SOA formed in the atmosphere can undergo further oxidation over time by reaction with hydroxyl radicals to produce “aged” SOA. Aging alters both chemical and physical properties of the aerosol. On a molecular scale, SOA is very complex. Electrospray ionization high resolution mass spectrometry (ESI-HRMS) typically detects 1000 or more unique molecular formulas in a given SOA sample, and these formulas change with the identity of the VOC precursor and the manner and extent to which oxidation occurs.5-9 Because of this complexity, SOA composition is often assessed through methods that provide average or “bulk” measurements for the entire SOA sample such as the oxygen-to-carbon (O/C) and hydrogen-to-carbon (H/C) elemental ratios as determined with the Aerosol Mass Spectrometer.10,11
The atmospheric lifecycle of SOA includes particle formation, growth, aging and ultimately removal by volatilization or wet and dry deposition. Important components of SOA throughout its lifecycle are highly oxidized multifunctional molecules (HOMs).12-15 At the beginning of the lifecycle, particle formation is thought to be assisted by so-called extremely low volatility organic compounds (ELVOCs), which have been detected in the gas phase by online sampling into a mass spectrometer.13 ELVOCs consist of organic molecules that have sufficiently low volatility to condense onto a particle surface. ELVOCs are produced by oxidation of a VOC precursor in a manner that leads to the rapid incorporation of many oxygen atoms,13,16 which may be accompanied by the coupling of two oxidized precursors together to produce dimers and sometimes higher order oligomers. Condensation of ELVOCs provides a reasonable explanation of why oligomers are detected in the particle phase almost immediately after particle formation.17 Once particles are formed, they can continue to grow by condensation of additional ELVOC molecules or by partitioning of more volatile oxidation products of the precursor molecules.18 The partitioned compounds may also be highly oxidized, but do not possess a sufficiently low vapor pressure to simply condense, and therefore distribute between the gas and particle phases. Once in the particle phase, both condensed and partitioned molecules can continue to react, for example to form higher order oligomers. It is estimated that approximately half of the mass of laboratory generated SOA from biogenic precursors consists of oligomers.19
At the other end of the lifecycle, the end products of SOA oxidation ultimately would be carbon dioxide and water, though wet and dry deposition are usually too fast to reach this endpoint. As SOA ages, it is subjected to both functionalization and fragmentation.20 Functionalization occurs because oxidation leads to the formation of new functional groups such as acids and carbonyls. Fragmentation occurs because carbon-carbon bonds are broken, leading to the formation of smaller molecules that are also functionalized, but because of their lower molecular mass they may partition back to the gas phase. As aging proceeds, functionalization can initially lead to the formation of additional SOA mass because the insertion of functional groups lowers the vapor pressure, though eventually fragmentation leads to the loss of SOA mass through volatilization.20,21 The organic matter remaining in the particle phase after aging tends to be more highly oxidized and less volatile than its fresh SOA counterpart, and in ambient measurements is identified as low volatility oxygenated organic aerosol (LVOOA).3
While HOMs are important throughout the SOA lifecycle, the distribution of molecules is likely to change as aging proceeds.22 From a measurement perspective, defining what is meant by HOM is difficult. ELVOC is based on a gas phase measurement of individual molecules.13 The formulas distribute over a wide range of van Krevelen space (H/C ratio vs. O/C ratio) and not all can be regarded as highly oxidized. The actual range of molecular formulas that contribute to LVOOA is unknown since it is identified through an average composition measurement,3,23,24 though the average compositions reported for LVOOA do fit within the van Krevelen space encompassed by HOMs in biogenic SOA. Whether in the context of ELVOC or LVOOA or not, HOMs are characterized by high O/C ratio and/or high average carbon oxidation state (OSc). For a given molecular formula, average OSc is defined in terms of O/C and H/C elemental mole ratios 25:
LVOOA has been detected and characterized in ambient measurements23,24,26-29 where substantial aging has occurred. However, a suitable laboratory surrogate for LVOOA has not been found, perhaps in part because it is based on an average measurement and the entire aerosol must be highly oxidized for it to be identified. In the work reported here, high performance mass spectrometry is used to search for and characterize HOMs embedded within fresh and aged biogenic SOA and assess how closely these HOMs conform to ELVOC-like and LVOOA-like material.
Experimental Section
Fresh and aged SOA were generated with flow tube reactor (FTR) and photochemical chamber (PC) assembly as described previously22 and shown in Figure 1. Gas flows containing the biogenic precursor and ozone were mixed in the FTR to give approximate concentrations of 1 ppm (precursor), 20 ppm (ozone) and a reaction time of ≥20 s. Since no OH scavenger was added, it is possible that some products in the SOA exiting the FTR arose from the reaction of OH with the biogenic precursor. The aerosol exiting the FTR was combined with a flow of humidified air (35% or 70% RH depending on the experiment) containing additional ozone and sent into the PC. The volume of the PC and gas flow was such that the residence time in the PC was ∼30 min. The PC was surrounded by four ultraviolet (254 nm) lamps. When the lamps were turned on, OH was produced by the reaction of photolyzed ozone with water vapor. The magnitude of the OH concentration in the PC was controlled by adjusting the relative humidity and intensity of ultraviolet lamps. The OH concentration was estimated by feeding a known concentration of SO2 into the PC to produce sulfate aerosol. This estimation method does not take into account that oxidation of organic vapors in the PC may have produced additional OH.
Figure 1.
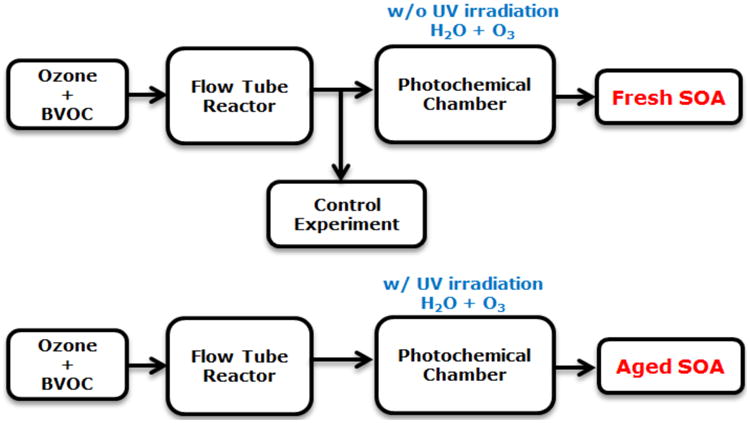
Summary of fresh and aged SOA experiments. BVOC = biogenic volatile organic carbon precursor.
For the work described here, “fresh” SOA is defined as the aerosol exiting the PC when the ultraviolet lamps were turned off. “Aged” SOA is defined as the aerosol exiting the PC when the ultraviolet lamps were turned on. The “control” sample is defined as the aerosol exiting the FTR prior to mixing with humidified air. It should be noted that aging in the PC was performed in the presence of both gas and particle phase organics exiting the FTR. When a HEPA filter was inserted between the FTR and PC to remove particles from the air flow entering the PC, no new particle mass was observed in the gas flow exiting the PC (uv lamps on). This experiment showed that gas phase organics exiting the FTR were not capable of nucleating and growing new particles in the PC, though we cannot rule out the possibility that oxidation of these vapors in the PC led to uptake and heterogeneous reaction when the particle phase from fresh SOA was present.
Most experiments were performed with β-pinene as the SOA precursor, though several experiments were also performed with limonene as the precursor. Fresh and aged SOA from α-pinene was studied previously by our group5,22, and the HOMs detected in that work are included in the discussion here. Table S1 gives the experimental conditions used in this study. Experiments with β-pinene precursor, discussed in detail below, consisted of 4 separate experiments: fresh SOA with lower/higher RH and aged SOA with lower/higher RH. A total of 5 samples (3 lower RH, 2 higher RH) were analyzed each for fresh and aged SOA (10 samples total). A total of 6 SOA samples derived from limonene precursor (3 fresh, 3 aged) were generated in the similar way (2 lower RH, 1 higher RH). The gas phase concentrations, aerosol loadings and OH exposures are higher than ambient levels 2,4 but the relative proportions are similar1,4. High aerosol loadings were needed to facilitate sample collection and analysis. Figure S1 shows example size distributions of fresh and aged SOA from β-pinene measured with a scanning mobility particle sizer (SMPS; TSI, Incorporated, St. Paul, Minnesota). Fresh SOA typically had a mode diameter in the number size distribution just above 100 nm. Upon aging, the size distribution broadened and the mode diameter increased (Figure S1), and both the number and mass concentrations of aerosol decreased (Table S1).
Both fresh and aged samples were collected and prepared for analysis in a similar manner to each other and to our previous work.22 Particles were collected on a Teflon coated, glass fiber filter (GF/D, CAT No.1823-025, Whatman, GE Healthcare, Piscataway, NJ) by passing aerosol (gas and particle phase organics) through the filter for about 24 hr so that the total amount of particulate matter collected was about 1000 μg assuming particle density of 1.3 g cm-3. While both negative and positive artifacts are possible when using a filter to collect particles in the presence of volatile and semi-volatile organic vapors, the impact of such artifacts was expected to be low in the present study since the focus was on characterization of high molecular weight HOMs that are typically nonvolatile. The filter was sonicated and extracted with ∼8 mL ACN/H2O (50%/50%). The extraction was repeated a total of 3 times (30 min each) to achieve a total extraction efficiency >97%.19 Acetonitrile was used instead of methanol to remove the possibility of esterification of acid groups. 30 The extraction solutions were combined and evaporated to near dryness in a concentrator (Savant™, SpeedVac™ Plus, Model: SC110A), followed by reconstitution in acetonitrile/water solution to give a final concentration of 100 μg/mL, which was found to be optimal for the detection of both major and minor components in relevant test samples (e.g. pinic acid, pinanediol, etc.) by the high resolution mass spectrometry under the conditions used. A chamber blank was also collected by flowing air through the PC without fresh SOA injection. Prior to each experiment, the PC was cleaned by introducing ozone (∼20 ppmv) into the chamber with the lights on for several days before each experiment and monitored with the SMPS. The mass concentration of photochemically produced aerosol in the cleaned chamber was much less than 1 μg/m3.
Sample analysis was performed with Q Exactive Hybrid Quadrupole-Orbitrap Mass Spectrometer (Thermo Scientific, Waltham, MA) coupled with a heated-electrospray ionization (HESI) probe using a spray voltage of 3.5 kV and capillary temperature of 275 °C. While direct infusion suffers quantitatively from competitive ionization effects, it tends to detect many more compounds than LC/MS.31 In our previous work with a different ESI source, a 5 eV in-source collision energy was applied to break the noncovalent bond of the clusters in the standard solution (pinonic acid) for SOA detection.32 In the current work, 5 eV and even higher (10-20 eV) in-source collision energy were applied to compare with the original spectra (no in-source collision energy applied) to identify and remove artifacts from in-source clustering. Full MS scan was acquired over the range 100-1000 m/z with a mass resolving power of 70000. Each spectrum was obtained by averaging ∼100 scans over a period of approximately 0.8 min. Representative mass spectra of fresh and aged SOA from β-pinene in the positive and negative ion modes are shown in Figures S2 and S3.
The mass spectra were processed with Xcaliber software supplied with the mass spectrometer. Initially, background subtraction was performed to remove contaminant and other background peaks. Peaks with either <0.1% intensity relative to the base peak or S/N <5 were removed from the peak lists. The remaining peaks were assigned molecular formulas with atomic constraints based on likely products of monoterpene oxidation in combination with the ‘Seven Golden Rules’ for molecular formulas described elsewhere.33 Candidate formulas had to be within 5 ppm of the expected m/z. In both ion modes, more than 90% of the peaks were assigned reasonable molecular formulas. The few unassigned peaks generally had peak intensities ≪1% relative to the base peak. About 10% of the peaks had more than one reasonable formula assigned to them. In some of these cases, elemental ratios (i.e. O/C and H/C) and RDB value (number of rings and double bonds contained in the formula) could be used exclude unlikely formulas. In the rare case that more than one reasonable formula remained after these considerations, all formulas were included in the subsequent analysis. Finally, redundancies due to ionization (i.e. [M+Na]+ and [M+H]+) and isotopic substitutions were removed, typically leaving over 1000 non-redundant assigned molecular formulas for each sample. Table S2 summarizes the total number of peaks detected and number of assigned formulas for each experiment.
The molecular composition of SOA generated in control experiments (collected before entering the chamber) was compared to that from the fresh SOA experiments (collected at the exit of the chamber). More than 96% of the molecular formulas were reproduced between the two experiments and the remaining formulas accounted for a very small fraction of the total signal intensity. This result suggests that the molecular composition of fresh SOA is not significantly affected by exposure to additional ozone in the dark, which has been noted in a separate study.31
Because of a small experiment-to-experiment variation in the distribution of molecular formulas that is inherent to this type of experiment5,22 only those formulas detected in all samples of a given type (e.g. in all 5 fresh samples or all 5 aged samples from β-pinene precursor) are considered below.
Results and Discussion
Molecular level characterization of HOMs in fresh SOA
Although the SOA produced in laboratory experiments, on average, has relatively low O/C ratio and OSc, highly oxidized compounds are embedded within it. Figure 2 shows two van Krevelen plots of assigned formulas, one for positive ions and one for negative ions, from fresh SOA produced by ozonolysis of β-pinene. Only those formulas that are detected in all five samples are shown. Not surprisingly, formulas having lower O/C ratios are more prevalent in positive ion spectra, while formulas having higher O/C ratios are more prevalent in negative ion spectra where molecules containing carboxylic acid groups tend to be more highly represented than those containing only carbonyls, peroxides and/or alcohols. There is a virtual continuum of formulas extending from an O/C ratio of ∼0.1 to ∼1.0. For the purpose of this study, HOMs are defined as assigned formulas having either O/C≥0.6 and/or OSc≥0. HOMs constitute 3-4% of the summed signal intensity (averaged over both positive and negative ion spectra after removing background/contaminant peaks as described in the experimental section) in the fresh SOA samples.
Figure 2.
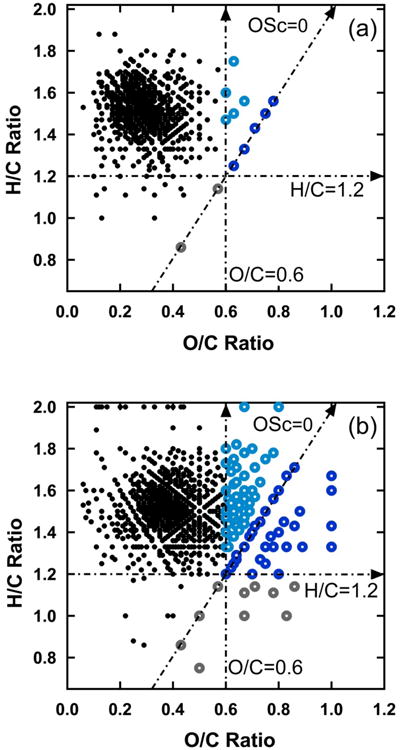
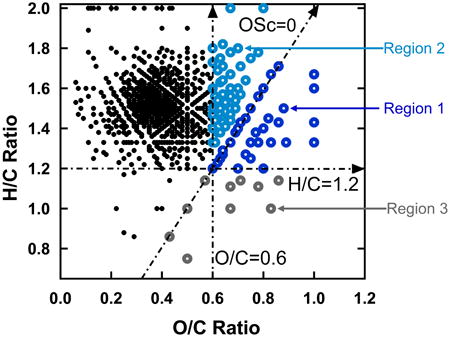
van Krevelen diagrams of the formulas in fresh SOA under a) positive and b) negative modes of ESI. HOMs considered in this study were defined by the three lines drawn in this plot: O/C=0.6, H/C=1.2, OSc=0. Region 1 HOMs are in dark blue. Region 2 HOMs are in light blue. Region 3 HOMs are in gray.
As an aid to understanding the molecular characteristics of HOMs, three lines are drawn in the Figure 2 plots: one showing O/C=0.6, another showing OSc=0, and a third showing H/C=1.2. To explore the relative importance of oxygen content vs. oxidation state, three specific regions of interest are then defined based on these lines: O/C≥0.6 and OSc≥0 (region 1, both highly oxygenated and highly oxidized), O/C≥0.6 but OSc<0 (region 2, highly oxygenated but less oxidized owing to a relatively high H/C ratio), and OSc≥0 but H/C<1.2 (region 3, highly oxidized for a moderate level of oxygenation owing to a relatively low H/C ratio). Characteristics of the HOMs in each of these regions are summarized in Table 1.
Table 1.
Summary of HOM assigned formulas in fresh and aged SOA.
| BVOC Precursor | Region | Fresh SOA | Aged SOA | ||||
|---|---|---|---|---|---|---|---|
| HOM Formulas | RA%c | Avg. Formula | HOM Formulas | RA%c | Avg. Formula | ||
| β-Pinenea | 1 | 40 | 1.5 | C9.9H13.1O7.0 | 109 | 3.7 | C12.8H16.9O9.5 |
| 2 | 49 | 1.9 | C12.6H19.6O8.1 | 65 | 4.1 | C14.3H21.5O9.1 | |
| 3 | 11 | 0.2 | C7.3H7.1O4.6 | 111 | 0.9 | C12.8H13.4O8.1 | |
| Limonenea | 1 | 76 | 2.8 | C11.8H16.6O8.9 | 315 | 2.1 | C14.4H20.5O12.4 |
| 2 | 172 | 5.8 | C15.6H25.0O10.2 | 242 | 1.4 | C17.7H28.1O12.2 | |
| 3 | 40 | 0.3 | C11.9H11.0O8.6 | 650 | 6.0 | C20.9H18.2O11.4 | |
| α- Pineneb | 1 | 64 | 2.5 | C11.0H15.2O8.4 | 211 | 8.7 | C17.0H22.4O12.9 |
| 2 | 83 | 5.3 | C17.3H26.8O11.4 | 87 | 6.4 | C19.9H28.8O12.7 | |
| 3 | 71 | 0.8 | C11.4H10.2O6.9 | 387 | 4.6 | C19.4H20.2O13.4 | |
This work.
From Hall et al (2013).
Summed intensity of HOM formulas divided by summed intensity of all assigned formulas.
HOMs in region 1 have molecular formulas most similar to LVOOA. The mass and intensity weighted average formula for these species (C9.9H13.1O7.0) is quite similar to the reported average formula of LVOOA from 10 different field measurement sites (C10.5H13.4H7.3)3 though the ambient sites were strongly impacted by anthropogenic as well as biogenic SOA precursors. About 10% of region 1 formulas have previously been reported for gas phase ELVOCs from various biogenic precursors13,34-37 and another 10% have been reported in SOA from other precursors including isoprene38 and aqueous-phase reaction between phenols and OH radical39. The similarity between HOMs in region 1 and these other experiments suggests that extensive oxidation of a variety of molecular precursors can lead to a common set of products. HOMs in region 1 constitute about half of the total signal intensity of all HOMs in regions 1-3.
HOMs in region 2 have similar oxygen content to most of the HOMs in region 1, but they have lower OSc, suggesting that they contain a greater fraction of more reduced functional groups (alcohols, ethers, peroxides, carbonyls), while region 1 contains a greater fraction of more oxidized functional groups (acids, carbonyls). The HOMs in region 2 are also biased toward higher molecular weight species that contain a greater number of carbon atoms. Most of the species in this region require coupling of at least two β-pinene molecules together (dimers and oligomers) to produce molecules having more than 10 carbon atoms, whereas region 1 contains a greater number of species that are able to be derived from one β-pinene molecule (monomers). The mass and intensity weighted average formula for formulas in region 2 is C12.6H19.6O8.1. HOMs in this region constitute about half of the total signal intensity of all HOMs in regions 1-3.
HOMs in region 3 bear little similarity to previous studies. To the authors' knowledge, none of the assigned formulas in this region match previously reported formulas for ELVOC-like species nor have they been specifically reported in previous SOA studies. The average molecular formula (Table 1) is quite different from average formulas reported in ambient studies, and the HOMs in this region account for only 10% of the total intensity in regions 1-3.
Aging of fresh SOA
Under the conditions used in this work, both fragmentation and functionalization are observed. Fragmentation is evidenced by a decrease in aerosol mass, see Table S1 in Supporting Information. Functionalization is evidenced by an increase in oxidation. The summed signal intensity from HOMs increased by more than a factor of 2 with aging, and the number of formulas in positive and negative ion spectra were more equal in aged SOA than fresh SOA (Table 1). Figure 3 shows a van Krevelen plot comparing fresh and aged SOA from β-pinene in which data from both positive and negative ion spectra are combined. In Figure 3, assigned formulas in red were observed either in aged SOA but not fresh SOA or in both samples but with higher relative abundance in aged SOA. Assigned formulas in black were observed either in fresh SOA but not aged SOA or in both samples but with higher relative abundance in fresh SOA. As shown in Figure 3, almost all formulas above O/C=0.4 are either unique to or more intensely detected in aged SOA relative to fresh SOA.
Figure 3.
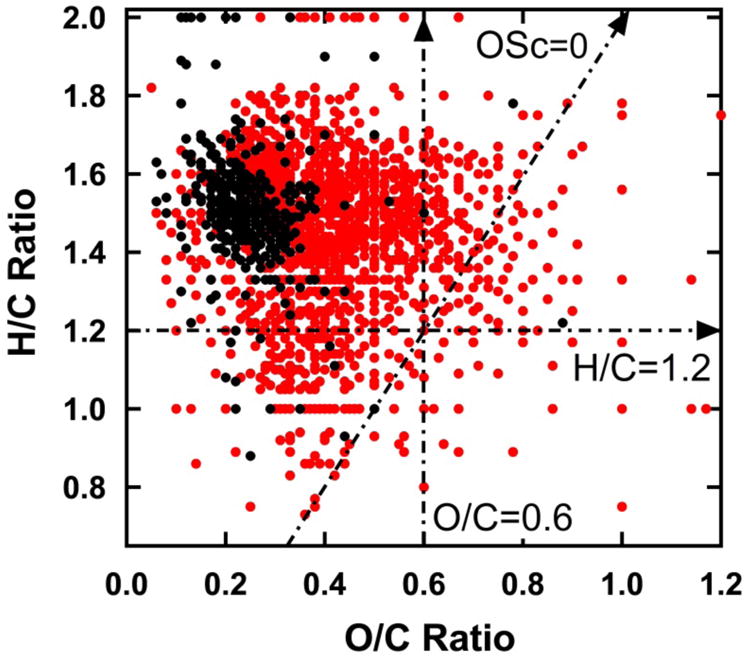
van Krevelen diagram of formulas in fresh and aged SOA (positive and negative ion spectra combined). Black dots represent formulas that were observed either in fresh SOA but not aged SOA or in both samples but with higher relative abundance in fresh SOA. Red dots represent formulas that were observed either in aged SOA but not fresh SOA or in both samples but with higher relative abundance in aged SOA.
While movement toward formulas having higher O/C ratio and increasing number of HOMs is to be expected upon aging, a surprising result is the concurrent movement toward higher carbon number among the assigned HOM formulas. As shown in Table 1, mass and intensity weighted average formulas for aged SOA from β-pinene contain several more carbon atoms than fresh SOA. This difference is further illustrated in Figure 4, a plot of OSc vs. number of carbon atoms for all assigned HOM formulas from fresh vs. aged SOA. For a given number of carbon atoms, aging produced new formulas with higher OSc i.e. higher O/C and/or lower H/C. However, aging also produced many new formulas having greater numbers of carbon atoms that observed in fresh SOA. HOMs in fresh SOA extended only up to C20 while HOMs aged SOA extended up to C26. The overall increase in carbon number is particularly striking for region 3 where the average formula increases by more than 5 carbon atoms upon aging (Table 1). Region 3 also shows the greatest increase in number of formulas and signal intensity.
Figure 4.
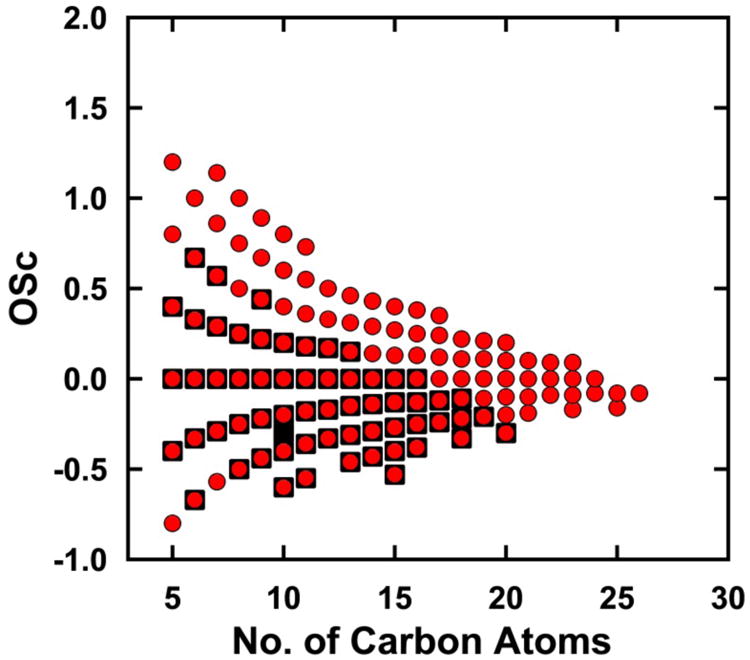
Carbon oxidation state vs. carbon number for the HOM assigned formulas from β-pinene SOA. Black squares represent assigned formulas observed in fresh SOA. Red circles represent assigned formulas observed in aged SOA.
HOMs in SOA from other biogenic precursors
To explore the generality of our observations for β-pinene SOA, HOMs from other biogenic precursors were also studied. Fresh and aged SOA from limonene were generated and analyzed in the same way as described above for β-pinene SOA. (Unlike β-pinene, only 3 samples each rather than 5 were obtained for fresh and aged SOA from limonene.) In addition, results from our previous study 22 of fresh and aged SOA from α-pinene were re-analyzed in the manner described above. The results are shown in Table 1 and Figures S4 and S5. All of the salient observations for β-pinene SOA were found for limonene and α-pinene SOA as well. Both number and signal intensity of HOM assigned formulas in fresh SOA from limonene and α-pinene were biased toward regions 1 and 2. Upon aging, both the number and signal intensity of HOMs in region 3 increased relative to 1 and 2, and the average number of carbon atoms in all three regions increased substantially with the greatest increase occurring in region 3 (Table 1). Aged SOA samples showed many new HOMs having higher carbon number than those observed in fresh SOA (Figures S4 and S5).
α-Pinene contains an endocyclic double bond while β-pinene contains an exocyclic double bond. Limonene contains both, though the endocyclic double bond is more reactive. Because of the location of the double bond, ozonolysis products of biogenic precursors containing an endocyclic double bond (e.g. α-pinene) tend to form products having greater O/C ratios and a higher incidence of carboxylic acid groups than those precursors containing an exocyclic double bond only (e.g. β-pinene).40 While these differences affect the specific molecular products observed in fresh and aged SOA from the different precursors, the general movement of products among the three HOM regions upon aging is the same owing to similar OH reaction pathways of the fresh SOA products.
HOM formation in fresh vs. aged biogenic SOA
The characteristics of HOMs in fresh vs. aged SOA shed light on their possible formation pathways. In fresh SOA, most of the HOMs detected can be derived from one or two precursor molecules (i.e. most formulas contain fewer than 20 carbon atoms). This observation is consistent with proposed formation pathways for gas-phase ELVOCs which include auto-oxidation16 of a single precursor molecule (inter- and intra-molecular hydrogen abstraction by OH radicals followed by rapid incorporation of oxygen atoms) as well as dimer formation between two partially oxidized monomers (e.g. coupling of oxidized precursors together). While there is some overlap between detected gas-phase ELVOCs and particle-phase HOMs in biogenic SOA, many species are unique to one phase or the other – an observation that was also made for laboratory vs. ambient SOA.14 These differences may arise from particle phase reaction of reactive functional groups in ELVOCs e.g. peroxides and hydroperoxides.15
Additional formation of dimers and oligomers is possible in the particle phase, but formation of higher order oligomers is unlikely in the gas phase unless the precursor concentration is extremely high. Therefore, HOMs contributing to particle formation and growth are likely to skewed toward monomers and dimers. Owing to their higher molecular mass, dimers (and higher order oligomers) need not be as highly oxidized as monomers in order to condense into the particle phase. Therefore, it is not surprising that particle phase oligomers are detected across the range from low O/C and/or OSc to high O/C and/or OSc in biogenic SOA.5,22,41
Aging of gas-phase species in biogenic SOA can lead to the formation of HOMs, which for reasons similar to the above are expected to be mostly monomers and dimers. However, aging of particle phase oligomers may also occur, which would lead to the formation of new dimer and oligomer HOMs. This effect would be especially pronounced for formation of HOMs in region 3, since incorporation of oxidized functional groups (acids, carbonyls) into a pre-existing oligomer would both increase O/C and decrease H/C. In that regard, movement from the black region of Figure 3 (O/C=0.2-0.4 and H/C=1.4-1.6) along a line with a slope of -1 in the van Krevelen plot (corresponds to replacement of alkyl groups by acid groups42) would lead preferentially to formation of HOMs in region 3. Movement from the same region with a slope of -0.5 (corresponds to replacement of alkyl groups with carbonyl groups) would lead preferentially to formation of HOMs in region 1. New HOMs in region 2 can be produced only by oxidation of oligomer precursors having an O/C ratio just below 0.6.
Particle phase aging of pre-existing non-HOM oligomers in fresh SOA provides a reasonable explanation for the substantial increase in number of carbon atoms in HOMs observed for all three biogenic SOA precursors. Because the reactants and oxidation pathways are different for particle formation and aging, it is not surprising that the molecular products are also different. For all three biogenic precursors, the increase in carbon number with aging causes average molecular formula of detected HOMs to move away from the average formula reported for ambient LVOOA. For this reason, HOMs embedded within aged biogenic SOA under the conditions studied are not reasonable surrogates for ambient LVOOA.
This study was designed to compare the effect of different biogenic precursors on HOM formation in fresh and aged SOA under a common set of experimental conditions. Particle formation and aging are strongly dependent on the conditions chosen. This study used relatively high precursor concentrations, which favors bimolecular reaction products of peroxy radicals (RO2· + RO2·) and elevated partitioning of semi-volatile compounds into the particle phase, which may be less important under ambient conditions where lower precursor concentrations and/or high NOx levels favor other pathways. Relative humidity can affect which products of the Criegee radical are dominant in fresh SOA produced by ozonolysis,40 and also the extent to which aqueous phase aging occurs.43 No significant relative humidity dependence was observed in this study between 35 and 70%. This work employed 254 nm radiation in the PC owing to the high photochemical yield of OH. How the wavelength chosen may also influence direct photochemistry of uv-absorbing species is not well understood. While the presence of both gas and particle phase organics during the aging process does not allow particle phase vs. gas-particle reactions to be distinguished, it does more closely represent ambient conditions than, for example, removing gas phase species from the aerosol flow into the PC. Because of the impact of different experimental conditions on reaction pathways/products and the wide range of experimental conditions that can be encountered in ambient air, future work would benefit from a systematic study of particle formation and aging under a variety of conditions.
Supplementary Material
Acknowledgments
This research was supported by the National Science Foundation under grant number CHE-1408455. The Orbitrap mass spectrometer used in this study was purchased under grant number S10 OD016267-01 and supported by grant number 1 P30 GM110758-01, both from the National Institutes of Health. The authors thank Andrew Horan for assistance with acquisition and processing of MS data.
References
- 1.Atkinson R, Arey J. Atmos Environ. 2003;37:S197–S219. [Google Scholar]
- 2.Hallquist M, Wenger JC, Baltensperger U, Rudich Y, Simpson D, Claeys M, Dommen J, Donahue NM, George C, Goldstein AH, Hamilton JF, Herrmann H, Hoffmann T, Iinuma Y, Jang M, Jenkin ME, Jimenez JL, Kiendler-Scharr A, Maenhaut W, McFiggans G, Mentel TF, Monod A, Prevot ASH, Seinfeld JH, Surratt JD, Szmigielski R, Wildt J. Atmos Chem Phys. 2009;9:5155–5236. [Google Scholar]
- 3.Jimenez JL, Canagaratna MR, Donahue NM, Prevot ASH, Zhang Q, Kroll JH, DeCarlo PF, Allan JD, Coe H, Ng NL, Aiken AC, Docherty KS, Ulbrich IM, Grieshop AP, Robinson AL, Duplissy J, Smith JD, Wilson KR, Lanz VA, Hueglin C, Sun YL, Tian J, Laaksonen A, Raatikainen T, Rautiainen J, Vaattovaara P, Ehn M, Kulmala M, Tomlinson JM, Collins DR, Cubison MJ, Dunlea EJ, Huffman JA, Onasch TB, Alfarra MR, Williams PI, Bower K, Kondo Y, Schneider J, Drewnick F, Borrmann S, Weimer S, Demerjian K, Salcedo D, Cottrell L, Griffin R, Takami A, Miyoshi T, Hatakeyama S, Shimono A, Sun JY, Zhang YM, Dzepina K, Kimmel JR, Sueper D, Jayne JT, Herndon SC, Trimborn AM, Williams LR, Wood EC, Middlebrook AM, Kolb CE, Baltensperger U, Worsnop DR. Science. 2009;326:1525–1529. doi: 10.1126/science.1180353. [DOI] [PubMed] [Google Scholar]
- 4.Johnson D, Marston G. Chem Soc Rev. 2008;37:699–716. doi: 10.1039/b704260b. [DOI] [PubMed] [Google Scholar]
- 5.Heaton KJ, Sleighter RL, Hatcher PG, Hall WA, Johnston MV. Environ Sci Technol. 2009;43:7797–7802. doi: 10.1021/es901214p. [DOI] [PubMed] [Google Scholar]
- 6.Ma Y, Marston G. Phys Chem Chem Phys. 2008;10:6115–6126. doi: 10.1039/b807863g. [DOI] [PubMed] [Google Scholar]
- 7.Romonosky DE, Laskin A, Laskin J, Nizkorodov SA. J Phys Chem A. 2015;119:2594–2606. doi: 10.1021/jp509476r. [DOI] [PubMed] [Google Scholar]
- 8.Song C, Na K, Warren B, Malloy Q, Cocker DR. Environ Sci Technol. 2007;41:7409–7416. doi: 10.1021/es070429r. [DOI] [PubMed] [Google Scholar]
- 9.Walser ML, Desyaterik Y, Laskin J, Laskin A, Nizkorodov SA. Phys Chem Chem Phys. 2008;10:1009–1022. doi: 10.1039/b712620d. [DOI] [PubMed] [Google Scholar]
- 10.Aiken AC, DeCarlo PF, Jimenez JL. Anal Chem. 2007;79:8350–8358. doi: 10.1021/ac071150w. [DOI] [PubMed] [Google Scholar]
- 11.Canagaratna MR, Jimenez JL, Kroll JH, Chen Q, Kessler SH, Massoli P, Ruiz LH, Fortner E, Williams LR, Wilson KR, Surratt JD, Donahue NM, Jayne JT, Worsnop DR. Atmos Chem Phys. 2015;15:253–272. [Google Scholar]
- 12.Ehn M, Kleist E, Junninen H, Petaja T, Lonn G, Schobesberger S, Dal Maso M, Trimborn A, Kulmala M, Worsnop DR, Wahner A, Wildt J, Mentel TF. Atmos Chem Phys. 2012;12:5113–5127. [Google Scholar]
- 13.Ehn M, Thornton JA, Kleist E, Sipila M, Junninen H, Pullinen I, Springer M, Rubach F, Tillmann R, Lee B, Lopez-Hilfiker F, Andres S, Acir IH, Rissanen M, Jokinen T, Schobesberger S, Kangasluoma J, Kontkanen J, Nieminen T, Kurten T, Nielsen LB, Jorgensen S, Kjaergaard HG, Canagaratna M, Dal Maso M, Berndt T, Petaja T, Wahner A, Kerminen VM, Kulmala M, Worsnop DR, Wildt J, Mentel TF. Nature. 2014;506:476–+. doi: 10.1038/nature13032. [DOI] [PubMed] [Google Scholar]
- 14.Mutzel A, Poulain L, Berndt T, Iinuma Y, Rodigast M, Boge O, Richters S, Spindler G, Sipila M, Jokinen T, Kulmala M, Herrmann H. Environ Sci Technol. 2015;49:7754–7761. doi: 10.1021/acs.est.5b00885. [DOI] [PubMed] [Google Scholar]
- 15.Mentel TF, Springer M, Ehn M, Kleist E, Pullinen I, Kurten T, Rissanen M, Wahner A, Wildt J. Atmos Chem Phys. 2015;15:6745–6765. [Google Scholar]
- 16.Crounse JD, Nielsen LB, Jorgensen S, Kjaergaard HG, Wennberg PO. J Phys Chem Lett. 2013;4:3513–3520. [Google Scholar]
- 17.Heaton KJ, Dreyfus MA, Wang S, Johnston MV. Environ Sci Technol. 2007;41:6129–6136. doi: 10.1021/es070314n. [DOI] [PubMed] [Google Scholar]
- 18.Pankow JF. Atmos Environ. 2003;37:4993–4993. [Google Scholar]
- 19.Hall WA, Johnston MV. Aerosol Sci Tech. 2011;45:37–45. [Google Scholar]
- 20.Kroll JH, Smith JD, Che DL, Kessler SH, Worsnop DR, Wilson KR. Phys Chem Chem Phys. 2009;11:8005–8014. doi: 10.1039/b905289e. [DOI] [PubMed] [Google Scholar]
- 21.Lambe AT, Chhabra PS, Onasch TB, Brune WH, Hunter JF, Kroll JH, Cummings MJ, Brogan JF, Parmar Y, Worsnop DR, Kolb CE, Davidovits P. Atmos Chem Phys. 2015;15:3063–3075. [Google Scholar]
- 22.Hall WA, Pennington MR, Johnston MV. Environ Sci Technol. 2013;47:2230–2237. doi: 10.1021/es303891q. [DOI] [PubMed] [Google Scholar]
- 23.Daumit KE, Kessler SH, Kroll JH. Faraday Discuss. 2013;165:181–202. doi: 10.1039/c3fd00045a. [DOI] [PubMed] [Google Scholar]
- 24.Ng NL, Canagaratna MR, Jimenez JL, Chhabra PS, Seinfeld JH, Worsnop DR. Atmos Chem Phys. 2011;11:6465–6474. [Google Scholar]
- 25.Kroll JH, Donahue NM, Jimenez JL, Kessler SH, Canagaratna MR, Wilson KR, Altieri KE, Mazzoleni LR, Wozniak AS, Bluhm H, Mysak ER, Smith JD, Kolb CE, Worsnop DR. Nat Chem. 2011;3:133–139. doi: 10.1038/nchem.948. [DOI] [PubMed] [Google Scholar]
- 26.Aiken AC, Decarlo PF, Kroll JH, Worsnop DR, Huffman JA, Docherty KS, Ulbrich IM, Mohr C, Kimmel JR, Sueper D, Sun Y, Zhang Q, Trimborn A, Northway M, Ziemann PJ, Canagaratna MR, Onasch TB, Alfarra MR, Prevot ASH, Dommen J, Duplissy J, Metzger A, Baltensperger U, Jimenez JL. Environ Sci Technol. 2008;42:4478–4485. doi: 10.1021/es703009q. [DOI] [PubMed] [Google Scholar]
- 27.DeCarlo PF, Ulbrich IM, Crounse J, de Foy B, Dunlea EJ, Aiken AC, Knapp D, Weinheimer AJ, Campos T, Wennberg PO, Jimenez JL. Atmos Chem Phys. 2010;10:5257–5280. [Google Scholar]
- 28.Crippa M, El Haddad I, Slowik JG, De Carlo PF, Mohr C, Heringa MF, Chirico R, Marchand N, Sciare J, Baltensperger U, Prevot ASH. J Geophys Res Atmos. 2013;118:1950–1963. [Google Scholar]
- 29.Docherty KS, Aiken AC, Huffman JA, Ulbrich IM, DeCarlo PF, Sueper D, Worsnop DR, Snyder DC, Peltier RE, Weber RJ, Grover BD, Eatough DJ, Williams BJ, Goldstein AH, Ziemann PJ, Jimenez JL. Atmos Chem Phys. 2011;11:12387–12420. [Google Scholar]
- 30.Bateman AP, Walser ML, Desyaterik Y, Laskin J, Laskin A, Nizkorodov SA. Environ Sci Technol. 2008;42:7341–7346. doi: 10.1021/es801226w. [DOI] [PubMed] [Google Scholar]
- 31.Kourtchev I, Doussin JF, Giorio C, Mahon B, Wilson EM, Maurin N, Pangui E, Venables DS, Wenger JC, Kalberer M. Atmos Chem Phys. 2015;15:5683–5695. [Google Scholar]
- 32.Hall WA, Johnston MV. J Am Soc Mass Spectr. 2012;23:1097–1108. doi: 10.1007/s13361-012-0362-6. [DOI] [PubMed] [Google Scholar]
- 33.Kind T, Fiehn O. Bmc Bioinform. 2007;8 doi: 10.1186/1471-2105-8-105. [DOI] [PMC free article] [PubMed] [Google Scholar]
- 34.Hyttinen N, Kupiainen-Maatta O, Rissanen MP, Muuronen M, Ehn M, Kurten T. J Phys Chem A. 2015;119:6339–6345. doi: 10.1021/acs.jpca.5b01818. [DOI] [PubMed] [Google Scholar]
- 35.Jokinen T, Berndt T, Makkonen R, Kerminen VM, Junninen H, Paasonen P, Stratmann F, Herrmann H, Guenther AB, Worsnop DR, Kulmala M, Ehn M, Sipila M. Proc Natl Acad Sci, USA. 2015;112:7123–7128. doi: 10.1073/pnas.1423977112. [DOI] [PMC free article] [PubMed] [Google Scholar]
- 36.Rissanen MP, Kurten T, Sipila M, Thornton JA, Kangasluoma J, Sarnela N, Junninen H, Jorgensen S, Schallhart S, Kajos MK, Taipale R, Springer M, Mentel TF, Ruuskanen T, Petaja T, Worsnop DR, Kjaergaard HG, Ehn M. J Am Chem Soc. 2014;136:15596–15606. doi: 10.1021/ja507146s. [DOI] [PubMed] [Google Scholar]
- 37.Schobesberger S, Junninen H, Bianchi F, Lonn G, Ehn M, Lehtipalo K, Dommen J, Ehrhart S, Ortega IK, Franchin A, Nieminen T, Riccobono F, Hutterli M, Duplissy J, Almeida J, Amorim A, Breitenlechner M, Downard AJ, Dunne EM, Flagan RC, Kajos M, Keskinen H, Kirkby J, Kupc A, Kurten A, Kurten T, Laaksonen A, Mathot S, Onnela A, Praplan AP, Rondo L, Santos FD, Schallhart S, Schnitzhofer R, Sipila M, Tome A, Tsagkogeorgas G, Vehkamaki H, Wimmer D, Baltensperger U, Carslaw KS, Curtius J, Hansel A, Petaja T, Kulmala M, Donahue NM, Worsnop DR. Proc Natl Acad Sci, USA. 2013;110:17223–17228. doi: 10.1073/pnas.1306973110. [DOI] [PMC free article] [PubMed] [Google Scholar]
- 38.Nguyen TB, Laskin J, Laskin A, Nizkorodov SA. Environ Sci Technol. 2011;45:6908–6918. doi: 10.1021/es201611n. [DOI] [PubMed] [Google Scholar]
- 39.Yu L, Smith J, Laskin A, Anastasio C, Laskin J, Zhang Q. Atmos Chem Phys. 2014;14:13801–13816. [Google Scholar]
- 40.Emanuelsson EU, Watne AK, Lutz A, Ljungstrom E, Hallquist M. J Phys Chem A. 2013;117:10346–10358. doi: 10.1021/jp4010218. [DOI] [PubMed] [Google Scholar]
- 41.Reinhardt A, Emmenegger C, Gerrits B, Panse C, Dommen J, Baltensperger U, Zenobi R, Kalberer M. Anal Chem. 2007;79:4074–4082. doi: 10.1021/ac062425v. [DOI] [PubMed] [Google Scholar]
- 42.Kroll JH, Lim CY, Kessler SH, Wilson KR. J Phys Chem A. 2015;119:10767–10783. doi: 10.1021/acs.jpca.5b06946. [DOI] [PubMed] [Google Scholar]
- 43.Aljawhary D, Zhao R, Lee AKY, Wang C, Abbatt JPD. J Phys Chem A. 2016;120:1395–1407. doi: 10.1021/acs.jpca.5b06237. [DOI] [PubMed] [Google Scholar]
Associated Data
This section collects any data citations, data availability statements, or supplementary materials included in this article.